How to Use Stochastic in Trending vs. Ranging Markets
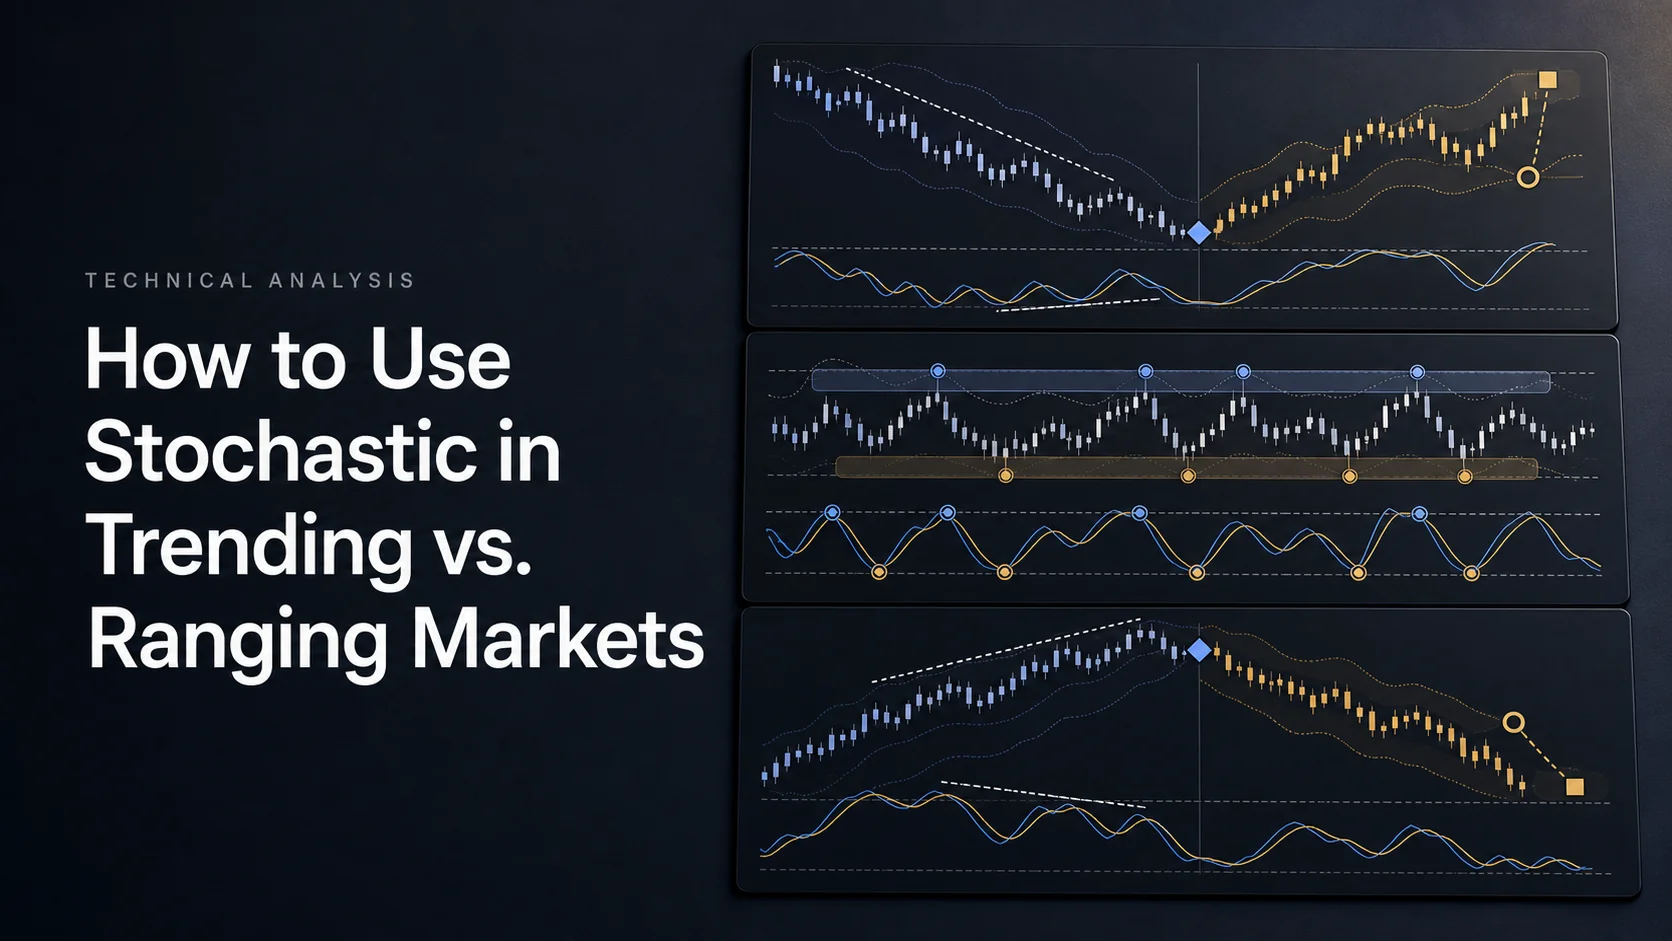
The stochastic oscillator can support either a trend-following or a range-reversal hypothesis, but the trading rules must match the context you defined. An extreme reading does not automatically mean reversal, and a mid-range bounce does not guarantee continuation.
Use LuxAlgo’s native charts and Quant, our coding agent, to specify the market-state filter, signal and exits together. Test the complete rule rather than changing its interpretation after seeing whether a trade won or lost.
Identify the Market State Before Choosing the Signal
Stochastic locates the close within a recent high–low range, with smoothing depending on the implementation. During a sustained advance, repeated closes near the range highs can keep it elevated. During a decline, it can remain low. In a bounded range, movements between the boundaries may produce repeated swings through the oscillator’s reference levels.
Those are possible behaviors, not a reliable classification system by themselves. Define a trend or range using information available before the entry. Allow an uncertain or transitional state rather than forcing every bar into one of two categories.
| Market hypothesis | What to define | Main failure to test |
|---|---|---|
| Uptrend or downtrend | Direction condition and a separate strength or persistence measure | A trend filter remains active after the move weakens |
| Trading range | Previously established boundaries, tolerance and invalidation | A breakout turns a reversal entry into a trade against a new move |
| Transition or uncertainty | Conditions that suspend new entries or retain the prior state | Frequent switching generates excessive trades and costs |
For example, a research filter might combine price above a specified moving average with that average’s value above its value several completed bars ago. The periods and comparison interval are choices to test, not universal definitions of an uptrend. Specify the chart timeframe separately.
ADX measures strength, not direction
Fidelity’s DMI guide describes an ADX reading above 25 as a typical indication of a strong trend. Treat that as a convention to evaluate, not proof that a trend will persist. ADX does not by itself tell you whether the direction is up or down.
A low reading also does not prove that price is contained within useful support and resistance boundaries. If ADX is part of your rule, define its calculation period and how direction is determined. Test the effect of its lag and of signals near the threshold.
Use Stochastic Differently Within a Defined Trend
In an uptrend hypothesis, you might investigate pullbacks followed by renewed upward oscillator movement. In a downtrend hypothesis, you might investigate rallies followed by renewed downward movement. Neither requires treating every overbought reading as a short or every oversold reading as a long.
A pullback into 40–60, a return above 20 and a %K crossover above %D are different triggers. Choose one, define its sequence and evaluate it. Do not substitute one for another when a historical example looks better.
Illustrative long-side trigger: while the predeclared uptrend filter is active, require %K to have closed within 40–60 on at least one of the preceding three completed bars, then cross above %D on the current completed bar. Decide the simulated entry time, exit and risk assumptions before testing. This is a research specification, not a proven strategy.
Extreme readings should not override an existing exit rule. A high stochastic value is not, by itself, a reason to close a long trade; it is also not a reason to ignore a stop or hold indefinitely.
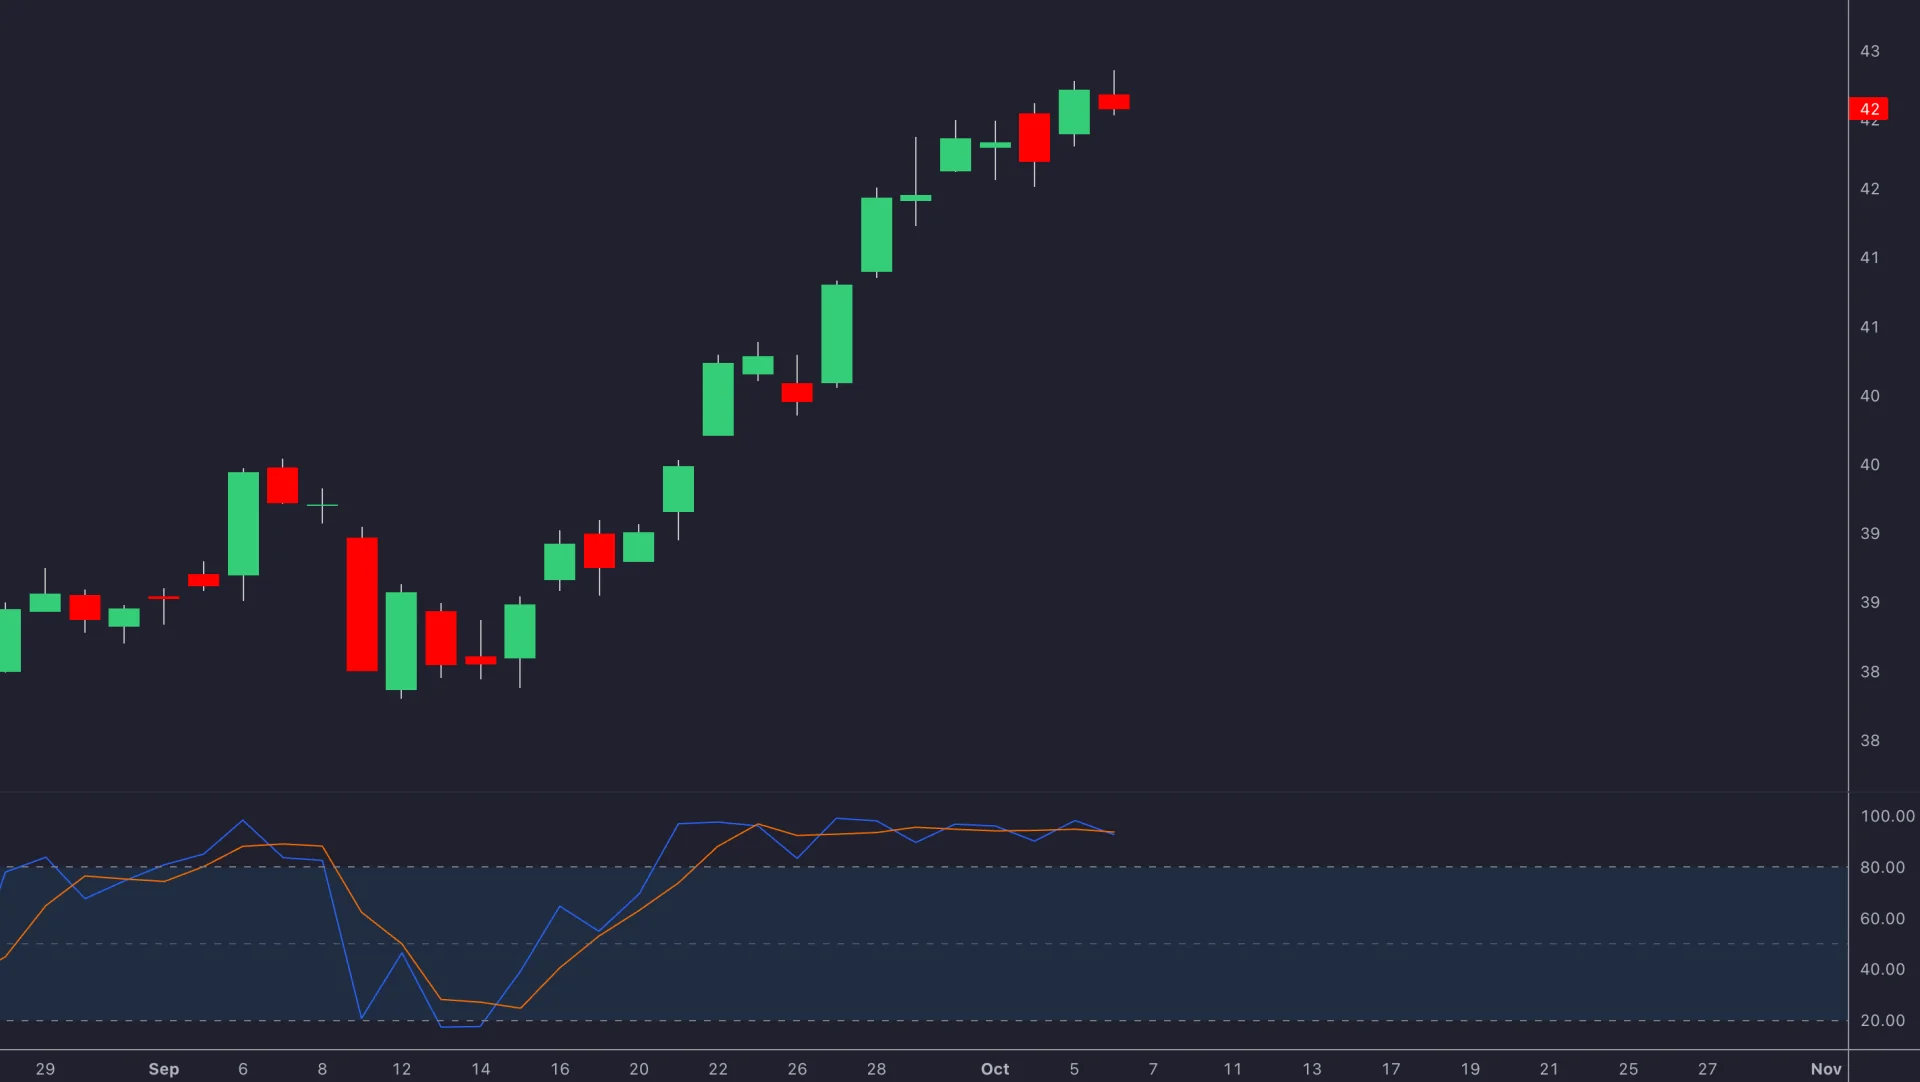
Use Range Boundaries Before Oscillator Extremes
A range strategy needs boundaries established before the trade. Define how those levels are selected, how near price must be to qualify and what invalidates the range. A later swing high or low cannot be used retroactively as a level known at entry.
Illustrative range trigger: require price to be within a defined distance of previously established support, then wait for a completed-bar %K crossover above %D with both below 20. Specify when the order can fill and how the strategy exits if support fails.
An exit near resistance is a separate decision from opening a short position there. If the strategy permits shorts, define that rule independently. A bearish crossover does not automatically mean both “close a long” and “enter short.”
Volume can add context, but a spike near a boundary may accompany a breakout rather than a reversal. Test a defined volume condition instead of treating increased activity as confirmation that the range must hold.
Compare Settings Without Prescribing Them by Regime
There is no general rule that 14,3,3 is best for trends and 5,3,3 is best for ranges. Use named inputs because implementations can order the numbers differently. A period means a bar, not a day unless you are using daily bars.
| Research choice | What it changes | What to measure |
|---|---|---|
| Shorter range lookback | The high–low window used by the oscillator | Signal timing, trade count and whipsaws after costs |
| More smoothing | The variation in %K or its %D comparison line | Delay and changes in the complete strategy’s result |
| 70/30 instead of 80/20 | The regions used to qualify extreme observations | Which additional setups are included and whether they help |
| Different chart interval | The time represented by each bar and formation | Whether the original hypothesis still makes sense |
Start by holding the settings constant while comparing the two context filters. Then test limited parameter changes. Otherwise, a result can improve because of a different timeframe, entry condition or exit without revealing anything about the regime filter itself.
Keep Risk Sizing Consistent Across Both Approaches
Trend trades do not automatically deserve larger positions, and range trades do not automatically need tighter stops. Determine invalidation from the strategy, then size the position using a monetary risk budget and estimated costs.
Hypothetical example: a $100 planned risk budget with an estimated $1 loss per share allows 100 shares before other constraints. If a different setup has a $2 estimated loss per share, the same budget allows 50 shares. A wider stop generally reduces size when the risk budget stays fixed. Check capital, margin, fees and slippage, and remember that an actual fill can exceed the estimate.
Define what happens when the market-state filter changes while a trade is open. The strategy might retain its original exit rules, close under an explicit condition or stop opening new positions. Choose that behavior before the test. A stop on new entries is not the same as closing an existing position.
Test Both Hypotheses with Quant
- Specify the inputs and context rules. State the instrument, timeframe, stochastic implementation, named parameters and exact trend or range criteria.
- Define the complete trade. Include the trigger, order timing, exits, size and behavior during a regime change. Ask Quant to identify missing assumptions.
- Review code and plotted events. Check completed-bar timing, higher-timeframe inputs and whether support, resistance or pivots become available only after later bars.
- Run realistic tests. Review commission, slippage and capital assumptions. Inspect individual trades as well as net profit, drawdown, profit factor and trade count.
- Evaluate separate periods. Keep a record of the trials used to select the rule and test the chosen version on data not used in development.
Evaluate the whole strategy as well as results within each predeclared state. A filter that looks good only because difficult periods were relabeled afterward has not been tested fairly. Quant can help implement the rules; it does not make an ordinary backtest an automatic regime-classification or live-adaptation system.
Where Multi-Length Stochastic Average Fits
The Multi-Length Stochastic Average averages stochastic calculations from length 4 through a selected maximum length. It offers source and pre- and post-smoothing choices. It is a different oscillator construction, not an automatic detector of trending versus ranging markets.
Changing smoothing changes its behavior; the documented least-squares smoothing option can produce overshoots. If you use it instead of standard stochastic, label the implementation clearly and test its thresholds separately rather than assuming identical signals.
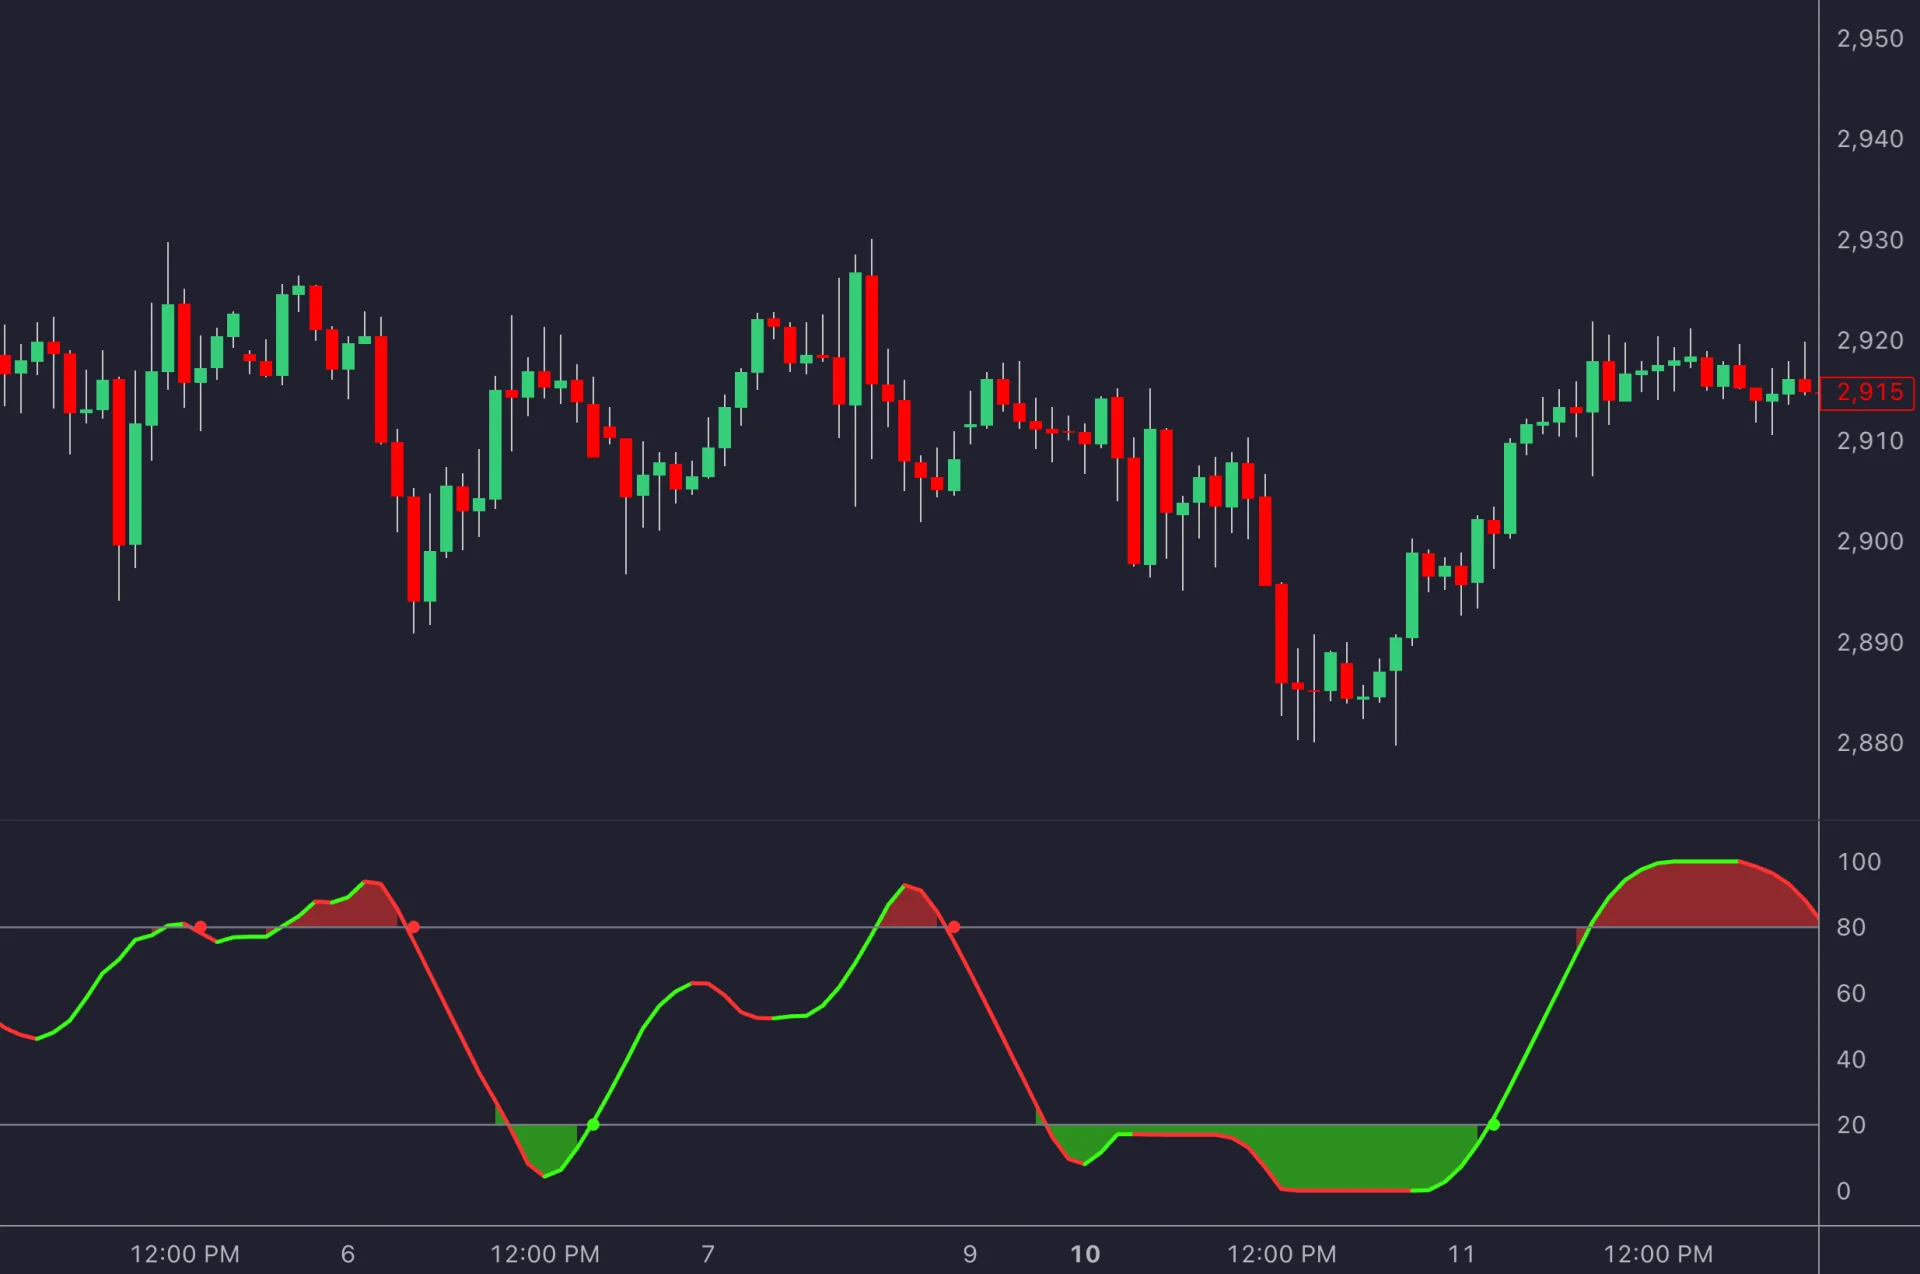
Divergence can be another hypothesis, but matching price and oscillator pivots requires explicit rules. If a pivot needs later bars for confirmation, the divergence cannot be acted on at the earlier pivot time. Neither regular nor hidden divergence guarantees a reversal or continuation.
Review the Process Alongside the Results
Use the LuxAlgo Journal for recorded trades and notes. Track the strategy version and the state assigned at the decision time, with a separate signal log for setups that never became trades.
Paper trading can help test execution procedures, but simulated fills do not reproduce every live condition. The useful goal is a consistent rule for interpreting stochastic in a defined context, with risks and limitations visible before capital is committed.
FAQs
When should you use a stochastic oscillator to buy or sell?
Use it only within a defined strategy that specifies context, trigger, entry timing, exits and risk. A trend strategy might test a pullback-and-recovery signal, while a range strategy might test a crossover near a previously established boundary. Neither an extreme reading nor a crossover is an automatic instruction to buy or sell.
Read next