How to Use Volume for High Volatility Breakouts
Volume helps measure participation in a high-volatility breakout; it does not prove that the move will continue. A surge can accompany a sustained trend, a news-driven reversal, or a failed break of resistance. The useful question is whether a clearly defined volume filter improves your breakout rules after costs.
Start by comparing like-for-like volume, combine it with price structure and volatility, and size the trade around a planned exit. LuxAlgo’s native charts provide a workspace for this analysis, while Quant can help turn your rules into a strategy you can review and test.
How Volume Changes Breakout Analysis
A breakout occurs when price moves beyond a defined range or level. Specify whether your rule requires an intrabar trade beyond that level, a completed candle close, or a later retest. Volume describes how much activity accompanied the move on the selected data feed.
| Observation | What it tells you | What still needs checking |
|---|---|---|
| Price breaks resistance as volume rises | More reported activity accompanied the move | Whether price holds the level and the trade meets your entry and risk rules |
| Price breaks resistance on lower volume | Participation is lower against the chosen baseline | Time of day, data coverage, and whether the filter has predictive value in this market |
| An isolated volume spike | Unusually concentrated activity | News, auctions, liquidation events, and possible reversal |
| Price makes a new high as volume declines | A price-volume divergence | It is a caution to investigate, not a timed reversal signal |
Total traded volume does not identify institutions or establish which side will win. Every executed trade has a buyer and seller. Even a side-classified volume measure describes execution activity, not every participant’s motive or remaining position.
Calculate Relative Volume Against a Clear Baseline
Relative volume = current volume ÷ comparison average. State the lookback, interval, session, and whether you are comparing individual bars or cumulative activity. If a completed bar trades 100,000 shares against an average of 50,000, relative volume is 2.0: 200% of average, or a 100% increase. “200% above average” instead means three times the baseline.
Intraday comparisons need particular care. Comparing an opening bar with quiet midday bars can distort the result. A time-matched approach compares activity at corresponding points in prior sessions. TradingView’s Relative Volume at Time reference distinguishes regular bar volume from cumulative volume and explains why an unfinished bar can understate the comparison.
Two times average can be a candidate threshold to test, but it is not a universal definition of a genuine breakout. Do not select a threshold only because it makes a few historical winners look obvious.
Video: Relative Volume at Time
This Trade Nation + TradingView tutorial demonstrates a time-matched volume indicator on TradingView. It illustrates the comparison method; the interface shown is separate from LuxAlgo’s native charts.
Combine Volume with ATR, Bollinger Bands, and Price Structure
Use each tool for a different question. Average True Range measures the scale of price movement, including gaps relative to the previous close; it does not indicate direction. Narrow Bollinger Bands describe reduced price dispersion. A squeeze may precede expansion, but does not tell you which way price will break or guarantee follow-through.
Mark the consolidation high and low before the signal. Then record the breakout price, volume ratio, and volatility reading. Distinguish a band expansion from a price break of the range: these are separate events. John Bollinger’s indicator rules also caution that touching a band is not, by itself, a buy or sell signal.
A practical review follows three stages: observe activity during consolidation, measure it at the specified breakout trigger, and monitor what happens afterward. Follow-through is useful evidence as it develops; a backtest must not use tomorrow’s volume to decide whether today’s entry was allowed.
Use VWAP as Context for the Breakout
VWAP weights a selected price measure by volume over an anchored window. It provides a reference for where reported activity occurred, not the market’s intrinsic value or the cost basis of every trader. Price above VWAP does not guarantee a profitable long position.
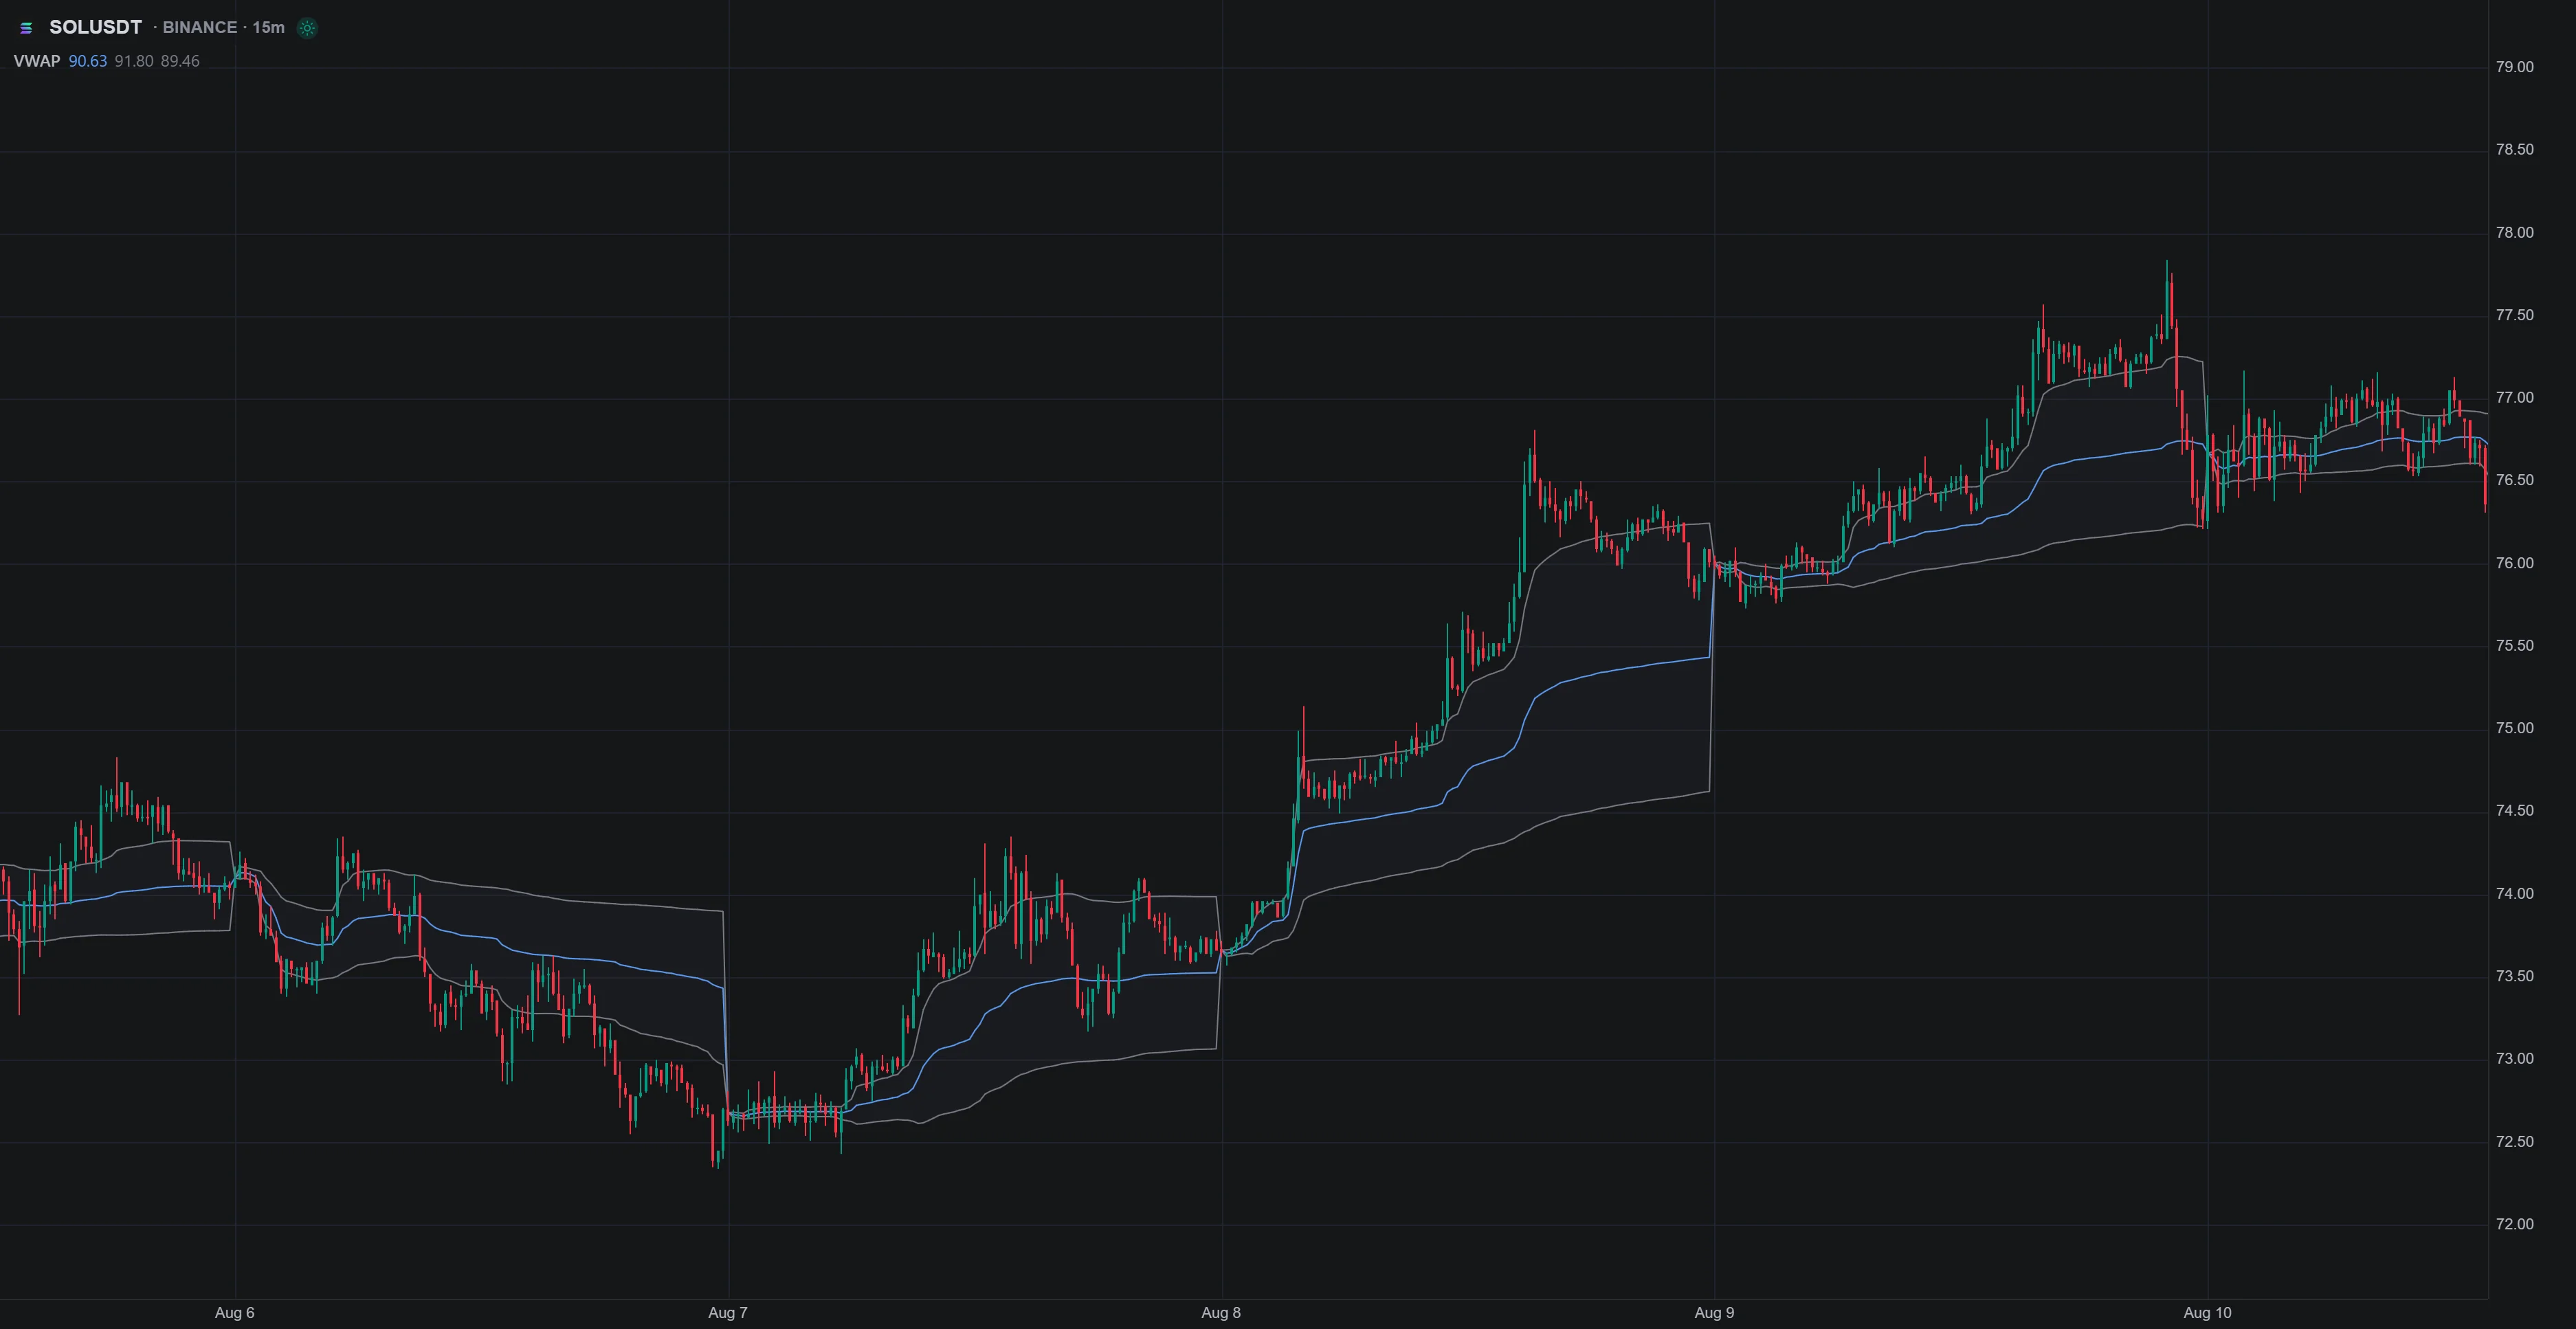
In LuxAlgo’s native charts, add VWAP from Indicators → Orderflow. Choose a Day, Week, or Month anchor; these periods reset in UTC. HLC3 is the default price source, with OHLC4 and Close also available. Match that anchor to your analysis rather than assuming it is your exchange’s regular-session VWAP.
For a candidate long setup, you might require both a close above the premarked range high and price above the selected VWAP. Test whether that extra condition helps compared with the range breakout alone. A later move below VWAP should trigger only the action specified by your strategy; it does not automatically justify reversing short or guarantee that an exit will secure a profit.
Manage Risk Before Acting on a Volume Spike
Choose an invalidation level and a risk budget before entry. A stop just below resistance may be too close during a volatile retest; a wider stop requires a smaller position if planned risk is to stay constant. An ATR buffer is a parameter to test, not protection against every gap.
For example, assume an entry at $60.50, a planned stop at $58.50, and a $200 risk budget. The price distance is $2 per share. Allowing another $0.10 per share for estimated trading costs and adverse execution gives $2.10 planned risk per share: floor($200 ÷ $2.10) = 95 shares, or $199.50 planned risk. Check buying power and any existing correlated exposure as well.
A $64.50 target offers $4 per share against the $2 price risk, or 2:1 before costs. That ratio alone does not establish positive expectancy. Stops may fill worse than their trigger price, especially during fast moves or gaps; a stop-limit order adds price control but can remain unfilled. Review the SEC’s stop-order guidance and LuxAlgo’s breakout risk-management guide.
Stock and Crypto Volume Examples
Hypothetical Stock Breakout
Suppose a stock has traded between $50 and $60, with average daily volume of 50,000 shares. A completed breakout day above $60 records 400,000 shares. That is 8 times average, 800% of average, or a 700% increase. These figures are a hypothetical illustration, not a documented historical trade.
The increase establishes unusual activity against that daily baseline. It does not prove institutional buying or a durable trend. Check where the day closed, whether the average includes the breakout day, and whether earnings or another event changed the context. If the strategy needs the final daily volume, its entry cannot assume that total was known earlier in the session.
Crypto Breakout Checklist
For a crypto pair breaking a consolidation range, keep the venue and instrument consistent. Spot and perpetual futures volume are different series, and base-asset units are not interchangeable with quote-currency turnover. A venue-specific spike is not automatically a market-wide spike.
Define the comparison window for the continuously traded market, inspect liquidity and spread, and test the same price/volume rules across different periods. Funding and liquidation effects may matter for derivatives. A universal “200% volume” condition or a stop just below the breakout cannot remove these risks. Forex feeds may report tick activity rather than consolidated traded volume, so check what the selected series actually measures.
Build and Test the Rules in LuxAlgo
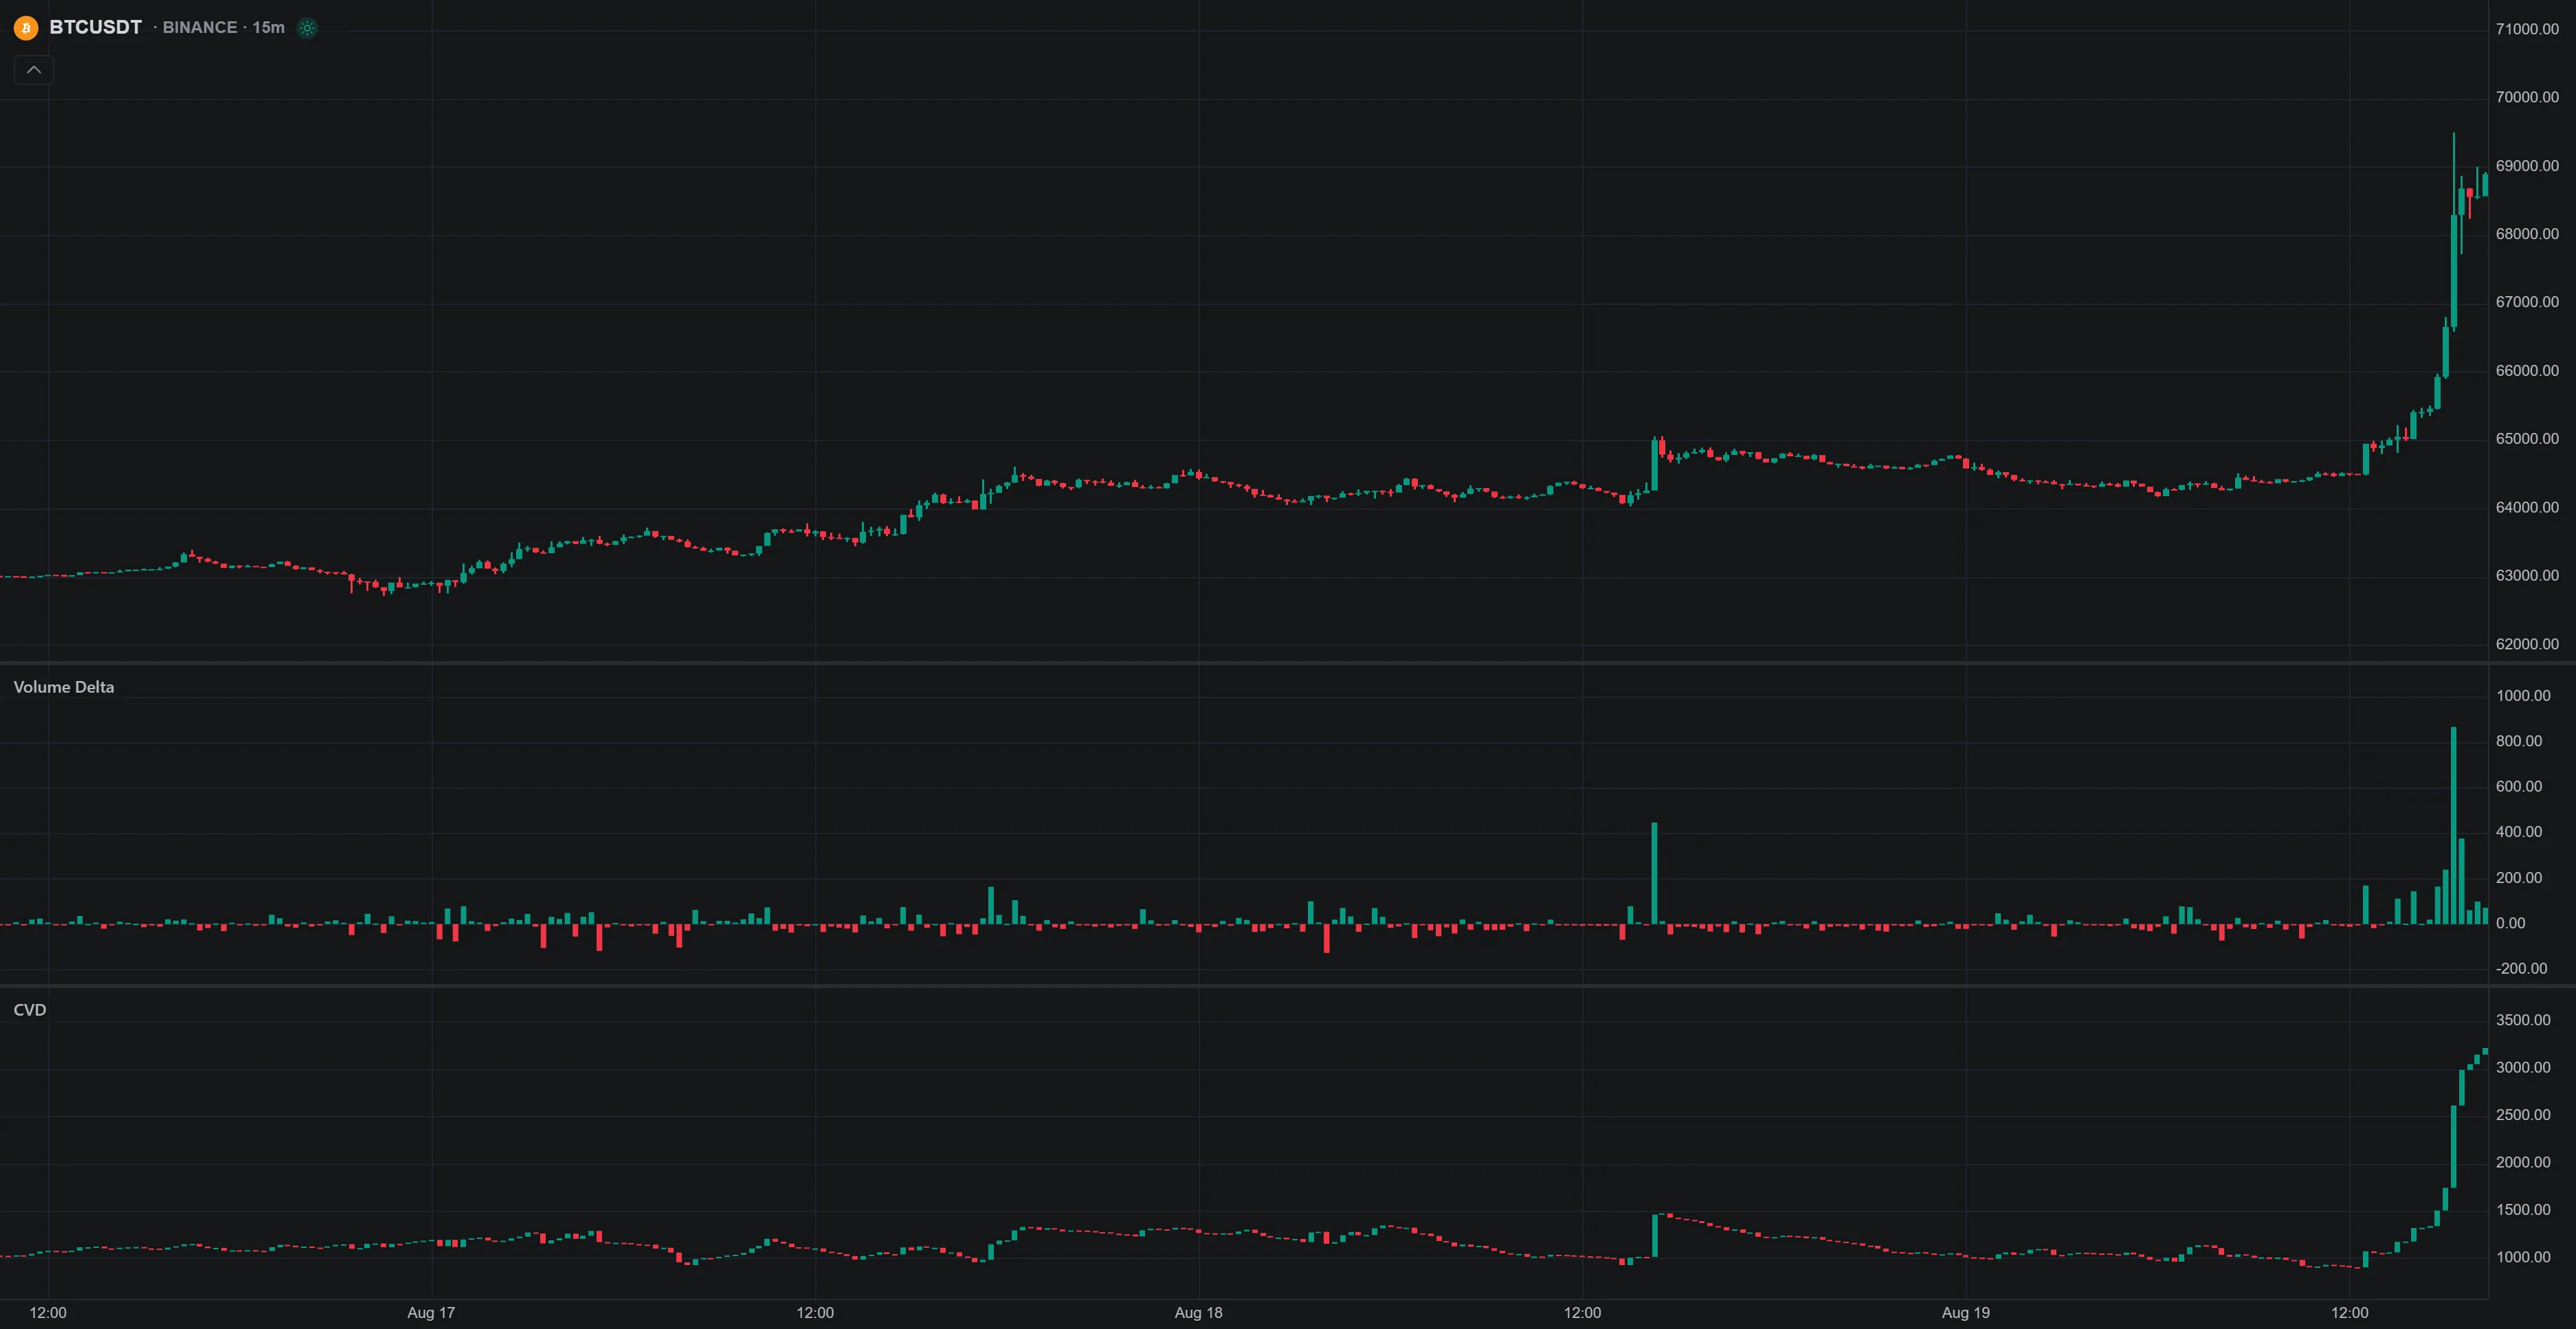
Use the native chart to mark the range, add VWAP, and inspect the underlying volume data. Where supported, Volume Delta adds side-classified activity context. Its footprint-data requirements differ from candle-based VWAP; consult market-data coverage before assuming the same tools or history are available on every symbol.
Give Quant an explicit specification: the prior-bar range lookback, completed-bar breakout condition, volume baseline excluding the signal bar, optional VWAP filter, entry timing, stop, target, and position-sizing rule. Ask it to expose the settings so you can compare a basic breakout with the same strategy plus the volume filter.
Review the generated logic before running it. Use native strategy settings and results to account for commission and slippage, inspect individual trades, and compare drawdown and net results alongside win rate. Reserve a later period for validation and examine nearby settings. Successful compilation is not evidence that the strategy is correct or profitable.
A backtest or chart alert is not a broker execution guarantee. Keep data availability, script compatibility, and order handling explicit when moving from analysis to another platform.
How Does Volume Confirm Breakouts?
Volume can provide supporting evidence that a price breakout attracted unusual activity relative to a defined baseline. It cannot confirm that the breakout will remain valid. Compare equivalent intervals and sessions, wait for the information your entry rule requires, and test whether the volume filter improves results after costs. Combine it with price structure, volatility context, and a predefined risk plan.
References and Further Reading
Read next