How to Use Volume for Scalping in Real Time
Use real-time volume to judge participation around a planned price setup, then decide whether the trade still makes sense after spreads, fees, and execution risk. A volume spike measures activity; it does not guarantee direction, liquidity, or a profitable scalp.
Start with Quant Charts for price, VWAP, and volume context. Use Quant to help turn explicit scalping rules into a strategy you can inspect and test, and verify the volume data available for your selected symbol.
- Before the session: check the feed, session settings, spread, and relevant news.
- Before entry: define the price trigger, volume comparison, invalidation level, and maximum planned risk.
- During the trade: follow predefined adjustment and exit rules rather than treating every volume fluctuation as a new signal.
Setting Up Your Platform for Volume Analysis
Choose the Feed Before the Indicator
A fast-looking chart is not enough. Confirm the symbol and venue, whether data is delayed, which sessions are included, and what “volume” means. Exchange volume can represent shares or contracts; a crypto feed may cover only one venue. Spot-forex tick volume measures feed activity rather than total currency traded worldwide. Check LuxAlgo’s market-data coverage before relying on an order-flow study.
One- and five-minute charts are possible starting points, not universally best settings. Shorter bars can produce more signals and greater sensitivity to spread and latency. Match the interval to the instrument and the execution method you can actually use.
Add a Small Set of Volume Tools
In LuxAlgo, open Indicators and choose the relevant study. Native order-flow tools are grouped under Orderflow. For a basic setup, use a volume pane, VWAP, and a clearly defined volume profile rather than several overlapping oscillators.
| Tool | What it contributes | Setting to define |
|---|---|---|
| Volume bars | Activity during each bar | Feed, session, interval, and comparison baseline |
| VWAP | Volume-weighted price over an anchored window | Anchor and price source |
| Volume Profile | Historical activity distributed across price bins | Session or range, rows, and value-area percentage |
| Volume Delta | Buy-side minus sell-side volume from supported footprint data | Data availability and Total versus Average mode |
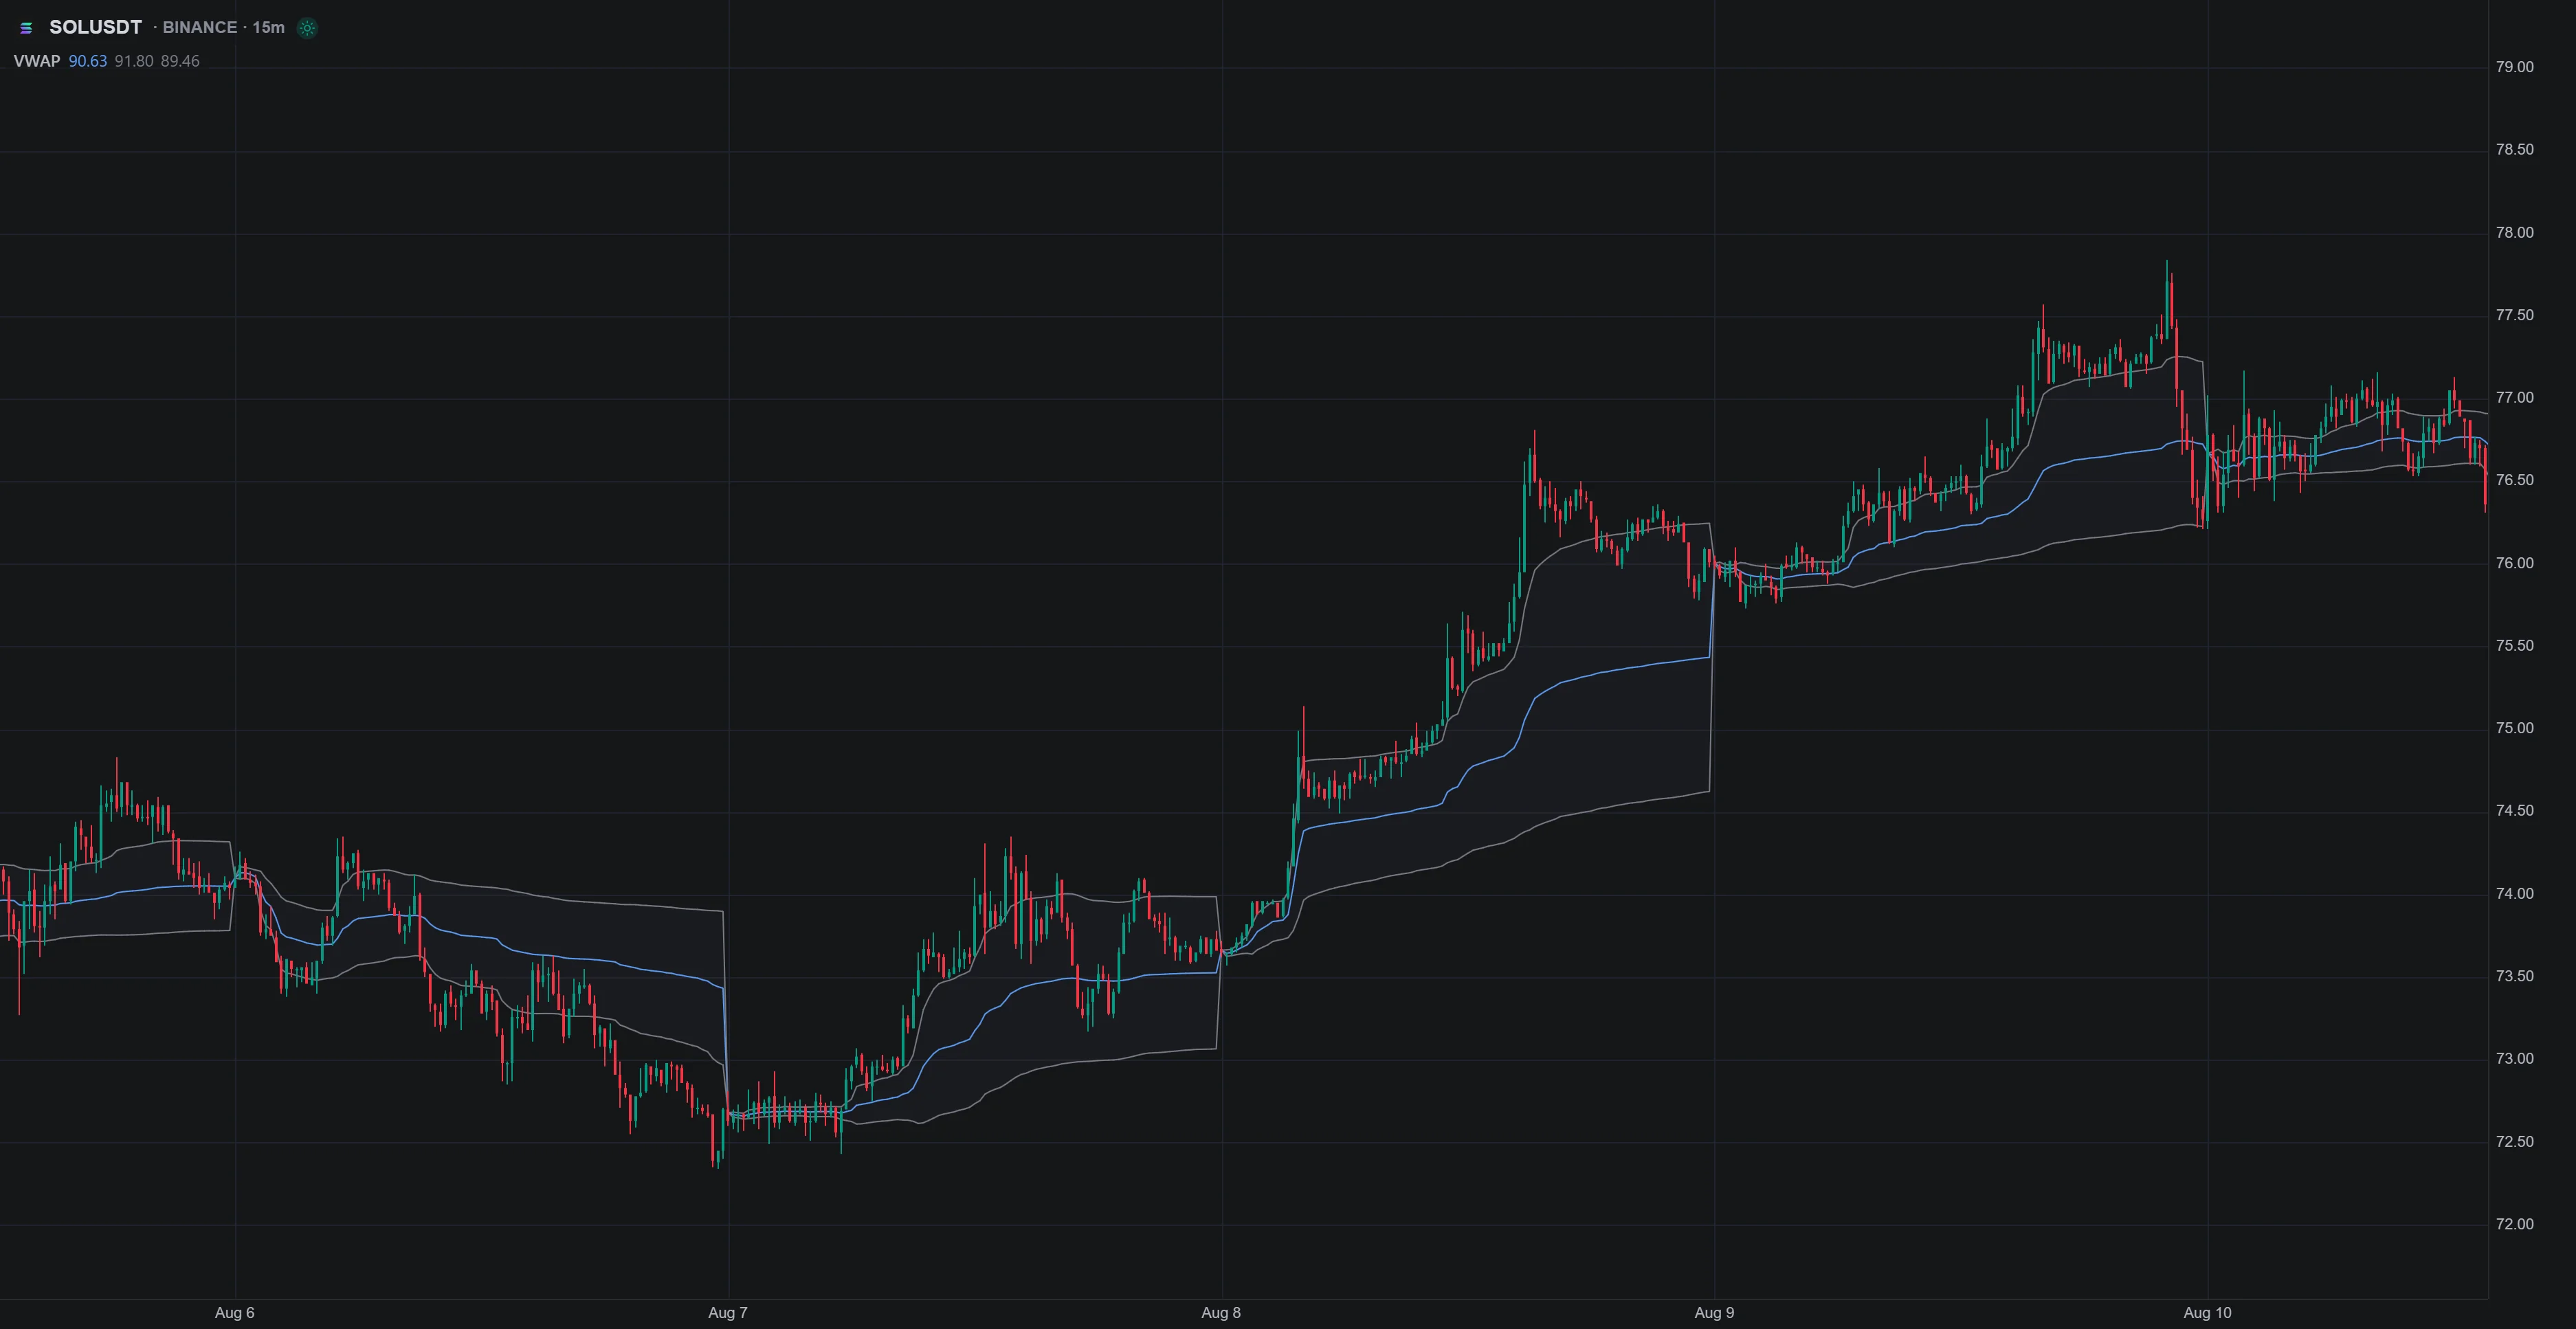
LuxAlgo VWAP supports Day, Week, and Month anchors with UTC boundaries. Check that the reset matches your intended analysis. A daily UTC anchor and a particular exchange’s regular session are not interchangeable.
Momentum and money-flow tools from the Library add context on a Quant Chart; their readings are not a direct record of institutional positions, resting liquidity, or every trade’s aggressor.
Techniques for Real-Time Volume Analysis
Identify Spikes with a Defined Baseline
Volume Rate of Change (VROC) compares current volume with volume a specified number of periods earlier. Expressed as a percentage, the calculation is 100 × (current volume − earlier volume) / earlier volume. If those values are 150,000 and 100,000, VROC is 50%. A zero denominator makes this comparison undefined.
That is different from dividing volume by an average. Relative volume of 1.5 means 50% above the chosen baseline; 2.0 means 100% above it. Neither reading is a universal entry requirement. Also distinguish 75% of average, which is below average, from 75% above average, which is 1.75 times average.
Time of day matters. Comparing opening activity with quiet midday bars can exaggerate the apparent surprise. A matched-time baseline, such as the approach described in Relative Volume at Time, can help make the comparison more meaningful. An unfinished bar is still accumulating volume; do not compare its partial total with completed bars and treat the result as final.
Read Divergence Without Assigning Direction to Raw Volume
A price high accompanied by weaker activity can prompt closer inspection, but rising raw volume during a decline is not automatically bullish. It can accompany continued selling. For directional divergence, name the indicator and compare corresponding price and indicator swings.
For example, OBV adds a bar’s volume when the close rises from the previous close and subtracts it when the close falls. Price making a higher high while OBV makes a lower high is a bearish divergence candidate. A lower price low with a higher OBV low is a bullish candidate. Either can persist while the trend continues; require a separate price trigger.
Use Volume Profile to Plan Locations
The point of control is the highest-volume price bin in the selected profile. High-volume nodes mark concentrations of historical activity, while low-volume nodes show less activity within that same range. They can help frame support, resistance, and potential paths between levels, but do not guarantee a bounce or reveal today’s available order-book depth.

LuxAlgo’s Session and Rolling profiles use footprint data and require supported symbols. Visible Range Volume Profile uses candle volume; its directional colors should not be interpreted as actual aggressor-side trades. For supported markets, native Volume Delta can add a different perspective, but it still cannot identify the institutions behind a trade.
Making Trades with Volume Signals
Define an Entry You Can Reproduce
A long setup might combine a break of resistance, price above a chosen VWAP, and activity above a specified baseline. A short setup can reverse the price conditions. Select thresholds through testing rather than assuming longs need a 50% increase, shorts 40%, or every breakout twice average volume.
Illustrative long setup: mark resistance at $25.00. A completed one-minute candle closes above it and above the chosen VWAP, with 180,000 shares versus a defined 100,000-share baseline: 1.8 times baseline, or 80% above. A later entry might fill at $25.05. The completed candle’s final volume was not known earlier within that candle, so a backtest must not use it to justify an earlier fill.
Define when the opportunity expires and which price change cancels it. If you instead trade intrabar, test with data and execution assumptions that support that timing. A candle-level simulation cannot establish queue position, exact spread, or the sequence of every intrabar move.
Size from Planned Risk, Not Volume Excitement
Choose an invalidation level before calculating size. Suppose the hypothetical $25.05 entry uses a $24.85 stop and allows $0.05 per share for estimated round-trip costs and slippage. With a $100 risk budget, the size is $100 / ($0.20 + $0.05) = 400 shares. This represents $10,020 of position value, so capital and buying-power limits also matter. A worse stop fill can exceed the estimate.
The CME position-sizing framework links size to the stop and the amount at risk. A larger volume spike does not by itself justify increasing that budget. Tightening a stop simply to make the position larger can invalidate the original trade logic.
Plan Adds, Reductions, and Exits
Price holding the intended side of VWAP, supportive OBV, or renewed activity can be conditions in a scaling plan. Before adding, recalculate the entire position’s exposure and loss at the planned stop, including costs. Reducing when price stalls at a profile level or exiting on a confirmed VWAP break are also rules to test, not mandatory reactions to every fluctuation.
Specify what “volume against the trade” means: a falling price bar on high volume, a defined delta reading, or an indicator condition. Raw volume alone has no bullish or bearish direction. Keep the protective stop and cancellation rules explicit even if an alert is delayed or never arrives.
Avoiding Mistakes in Volume-Based Scalping
Low Activity and News Require Execution Checks
Low volume can coincide with difficult execution, but historical volume is not the same as current liquidity. Check spreads, quote stability, and the depth information available from your execution venue. Switching to a 15-minute chart, raising a threshold by 50%, or tightening a stop does not automatically solve thin trading. Reducing size or skipping the setup may fit the plan better.
Monitor scheduled announcements and define an event policy before the session. News-driven volume is real activity, but prices and spreads can change sharply. Waiting five to fifteen minutes does not guarantee stabilization. Resume only when your predefined spread, volatility, and data conditions are satisfied; do not assume a toolkit automatically detects a safe return to normal.
Avoid Redundant Confirmation
Volume measures participation; MACD and moving averages describe aspects of price momentum or trend, and RSI describes relative price momentum. Several agreeing indicators may share much of the same input rather than provide independent evidence. Test whether each added filter improves results after costs, and retain only useful ones.
Test the Scalping Rules in Quant
Give Quant the symbol, interval, session, VWAP anchor, volume formula, entry timing, stop, target, and cancellation rules. Ask for those choices as explicit inputs where appropriate. Review the generated logic before running it; successful code execution does not establish strategy accuracy.
In Quant strategy testing, inspect trades and results with realistic commission and slippage assumptions. Compare periods beyond the one used to choose settings. Verify that the required inputs are available; do not assume a custom script can access every footprint field or reproduce a private toolkit’s calculations.
Then practice the same rules in a demo environment and record signals, intended orders, actual fills, spreads, and reasons for skipped trades. Two to four weeks is not a universal readiness test: evaluate enough relevant conditions and execution examples to assess the process. If moving to live trading, keep exposure within the tested risk plan and continue comparing fills with the assumptions.
References
Read next