In-Depth Exploration of the Swing Failure Pattern
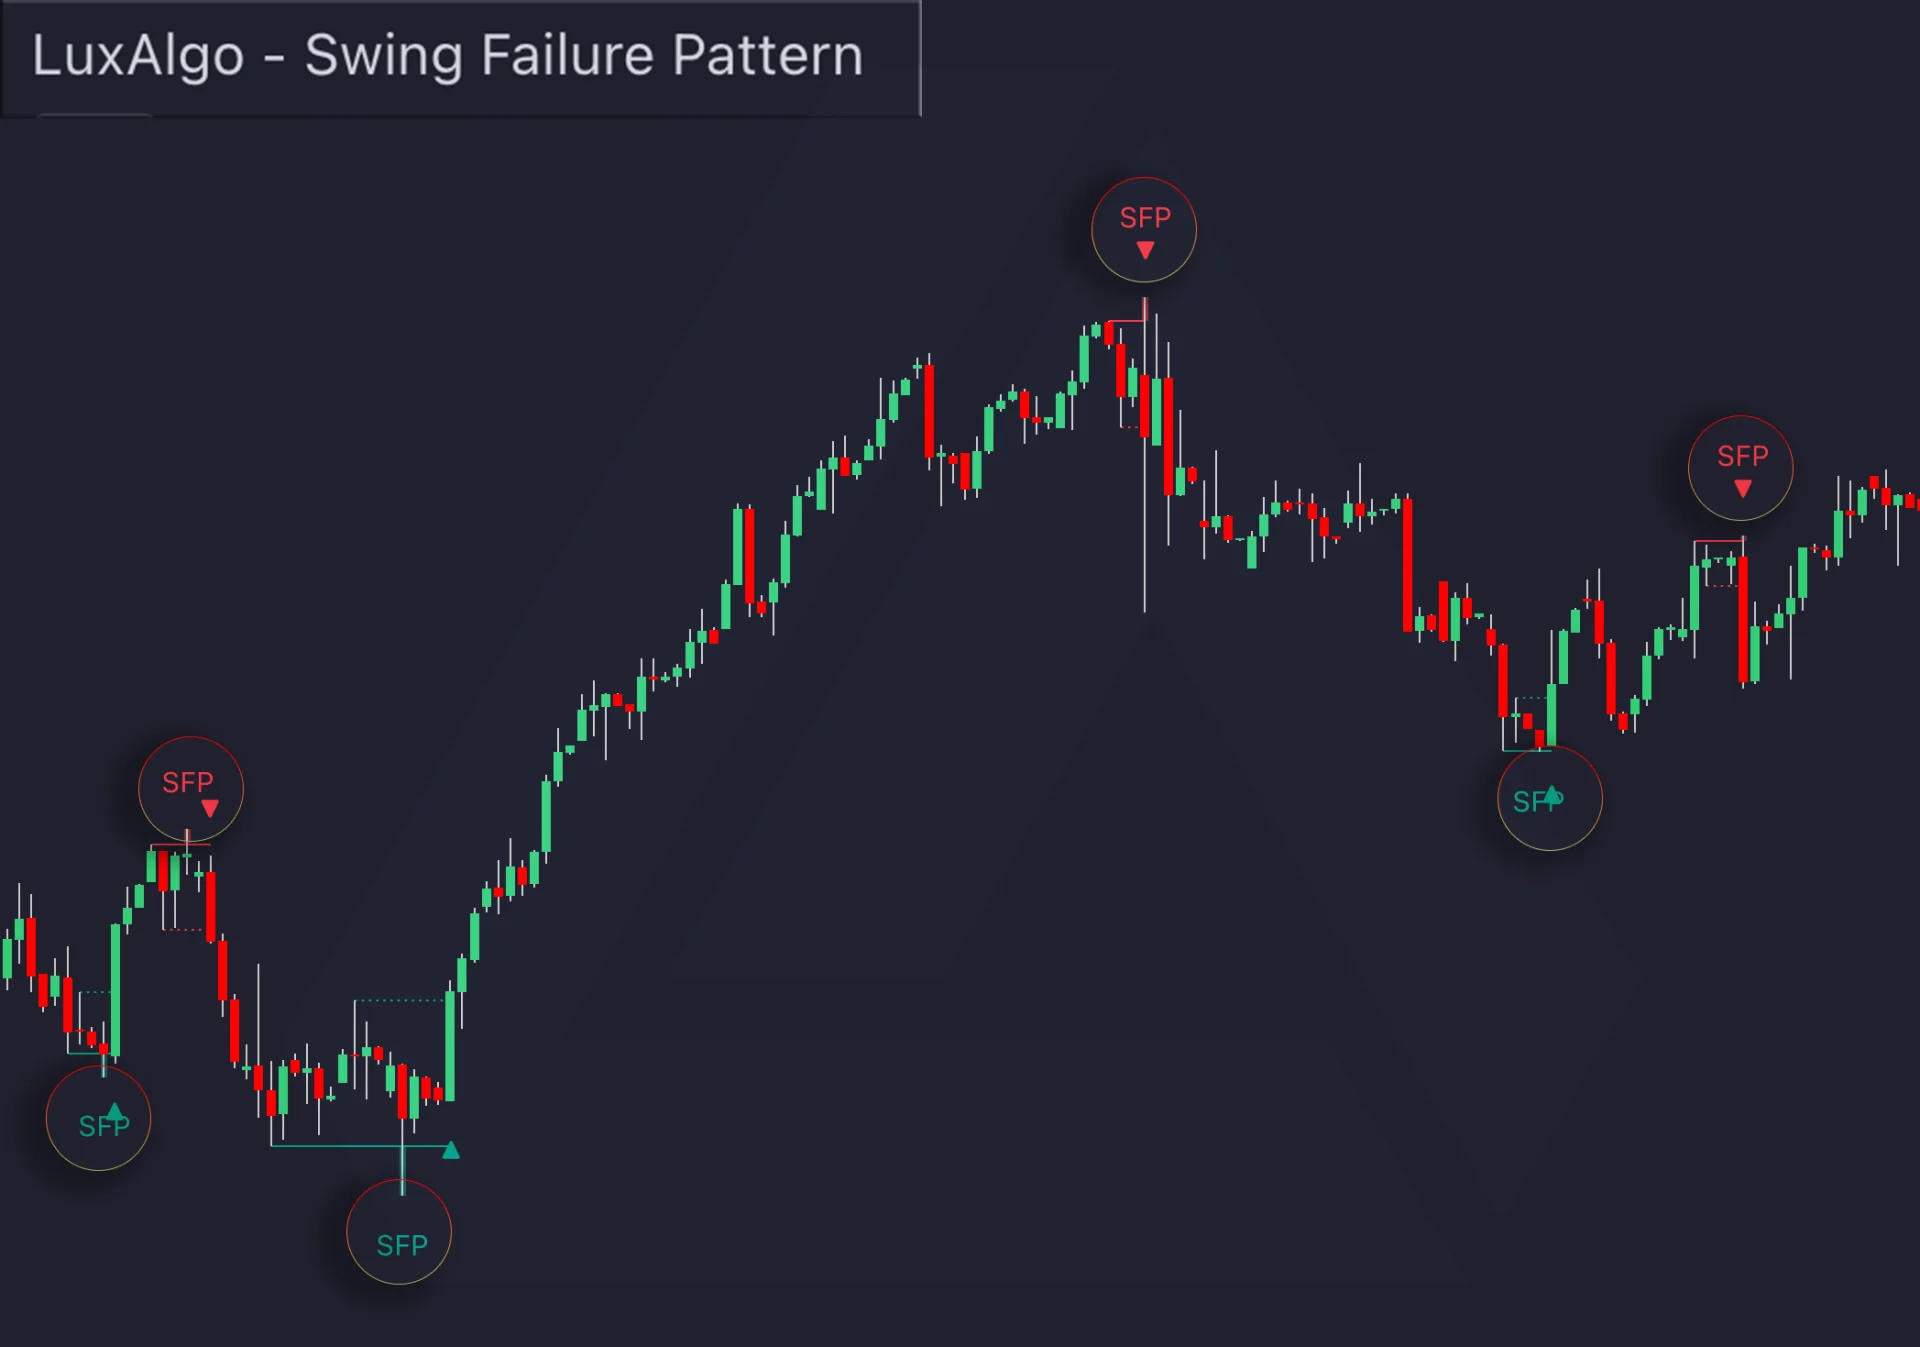
A price swing failure pattern (SFP) occurs when price trades beyond a previously identified swing level and closes back on the original side. A bearish version rejects above a swing high; a bullish version rejects below a swing low. It describes an observed rejection, not proof that a reversal must follow.
This guide separates the pattern from a complete trading strategy, explains the LuxAlgo indicator’s confirmation and volume settings, and shows how to research a supported setup in the current native platform. The historical diagrams remain useful for learning the structure; they are not trading records or current interface instructions.
Start with a Defined Swing Level
A sequence of higher highs and higher lows is one way to describe an uptrend; lower highs and lower lows describe a downtrend. These descriptions depend on which turns you select and the chart interval. A short-term swing can move against a larger trend without ending it.
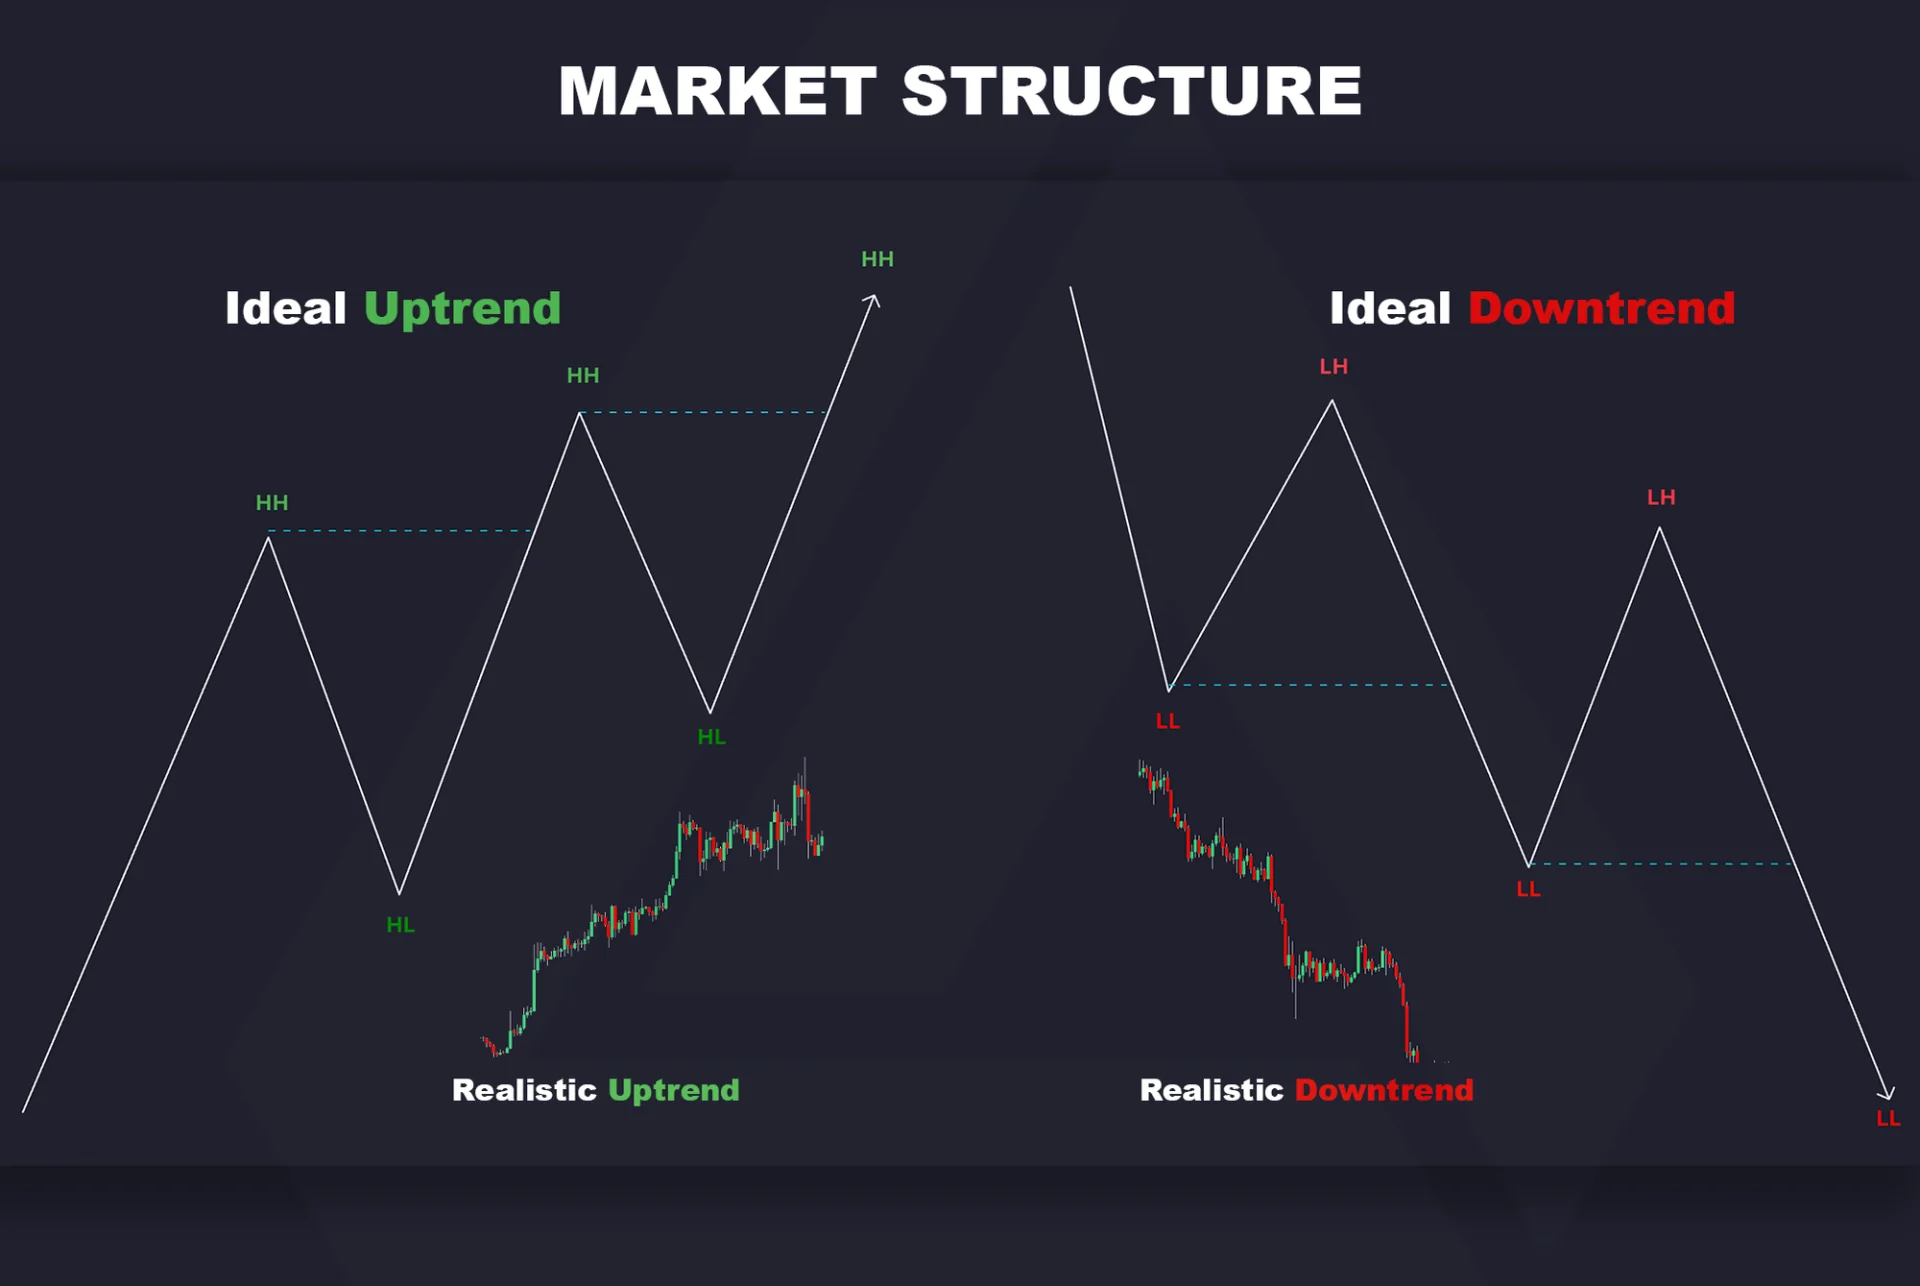
Specify whether swings use candle highs and lows or another series, how many bars must lie on either side, and how equal prices are handled. If a pivot requires later bars, it cannot be known at the pivot’s timestamp. A marker drawn back at that location does not remove the confirmation delay.
For example, the published source linked from the LuxAlgo SFP indicator page uses the selected Swings length on the left and one bar on the right. At the default length of five, that is a five-left, one-right pivot calculation—not a five-bar requirement on both sides. Other implementations can use different definitions.
Bullish and Bearish SFP Conditions
| Component | Bearish example | Bullish example |
|---|---|---|
| Reference | Previously identified swing high | Previously identified swing low |
| Excursion | Candle high trades above that level | Candle low trades below that level |
| Return | Candle closes below the level | Candle closes above the level |
| Published LuxAlgo source detail | Also requires the open below the level | Also requires the open above the level |
| Possible adverse-exit reference | Above the rejected wick, with a defined buffer | Below the rejected wick, with a defined buffer |
The general description emphasizes the close returning inside. The inspected LuxAlgo source is more specific: both the open and close must be strictly inside, with the wick strictly beyond the level. A candle opening outside and closing back inside may fit another trader’s rejection rule while failing this implementation’s test. Equality at the level is another rule choice to document.
Use completed candles when testing a close-based condition. The latest candle’s high, low and close can change before it finishes. The published script evaluates those changing values, so a live label should not be treated as a final signal merely because it appeared briefly.
Separate Detection, Confirmation and Entry
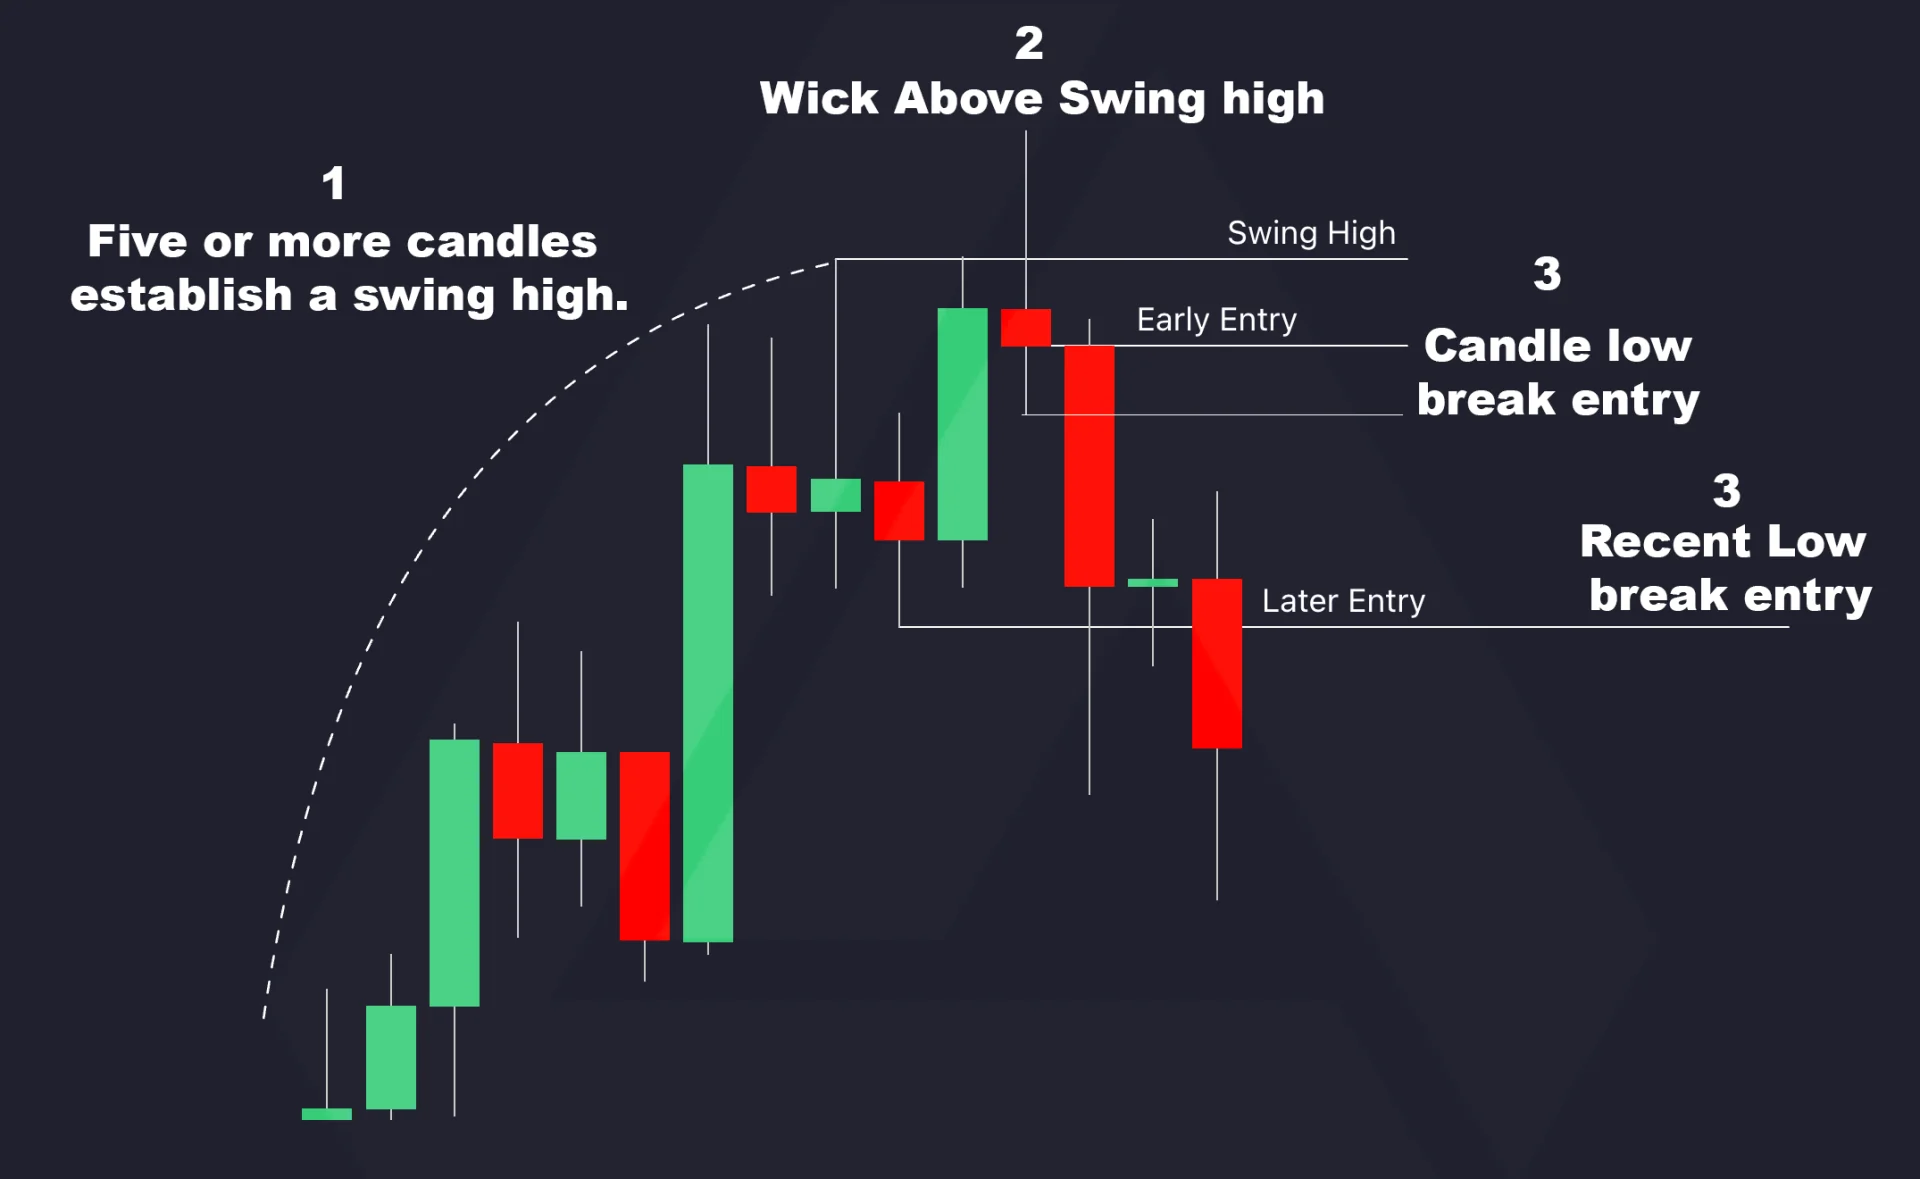
A rejection candle, a break of that candle’s opposite end and a break of an intervening swing are three different events. They can lead to different entry times and prices. Waiting for an additional condition may reduce the number of setups, but does not by itself prove better results.
The LuxAlgo indicator’s confirmation level uses the lowest intervening low between the prior swing high and a bearish SFP, or the highest intervening high between the prior swing low and a bullish SFP. A close beyond that opposite level produces its confirmation marker. The rejection candle itself can meet that condition; confirmation is not necessarily a later candle.
The triangle confirms the programmed condition, not a guaranteed market reversal. The source can replace an unconfirmed candidate with a newer one and remove unconfirmed drawings after its invalidation or age conditions. Preserve when a condition appeared in a test rather than assuming every historical drawing is a permanent live record.
A Symmetric Risk Example
Suppose a bearish candidate forms above a prior high of 100, reaches 102 and closes at 99.5. An illustrative short entry at 99 with a planned stop at 102.5 has 3.5 price units of planned risk. A target at 92 is 7 units away, giving a planned reward-to-risk ratio of 2 before costs. Those prices are hypothetical, not an execution recommendation.
For the bullish mirror, a prior low at 100, a wick to 98 and a close at 100.5 could be followed by an illustrative entry at 101. A planned stop at 97.5 again gives 3.5 units of risk, with a target at 108 giving 7 units of potential reward. The stop belongs below the bullish wick, not above it.
Define the order type, buffer, target, expiry and position size separately. An order based on the final close cannot assume a fill before that close was known. Gaps and slippage can increase losses beyond a planned stop distance, while a limit order may not fill. Include fees and, where relevant, borrowing or funding costs.
SFP, False Breakout and Other Rejection Concepts
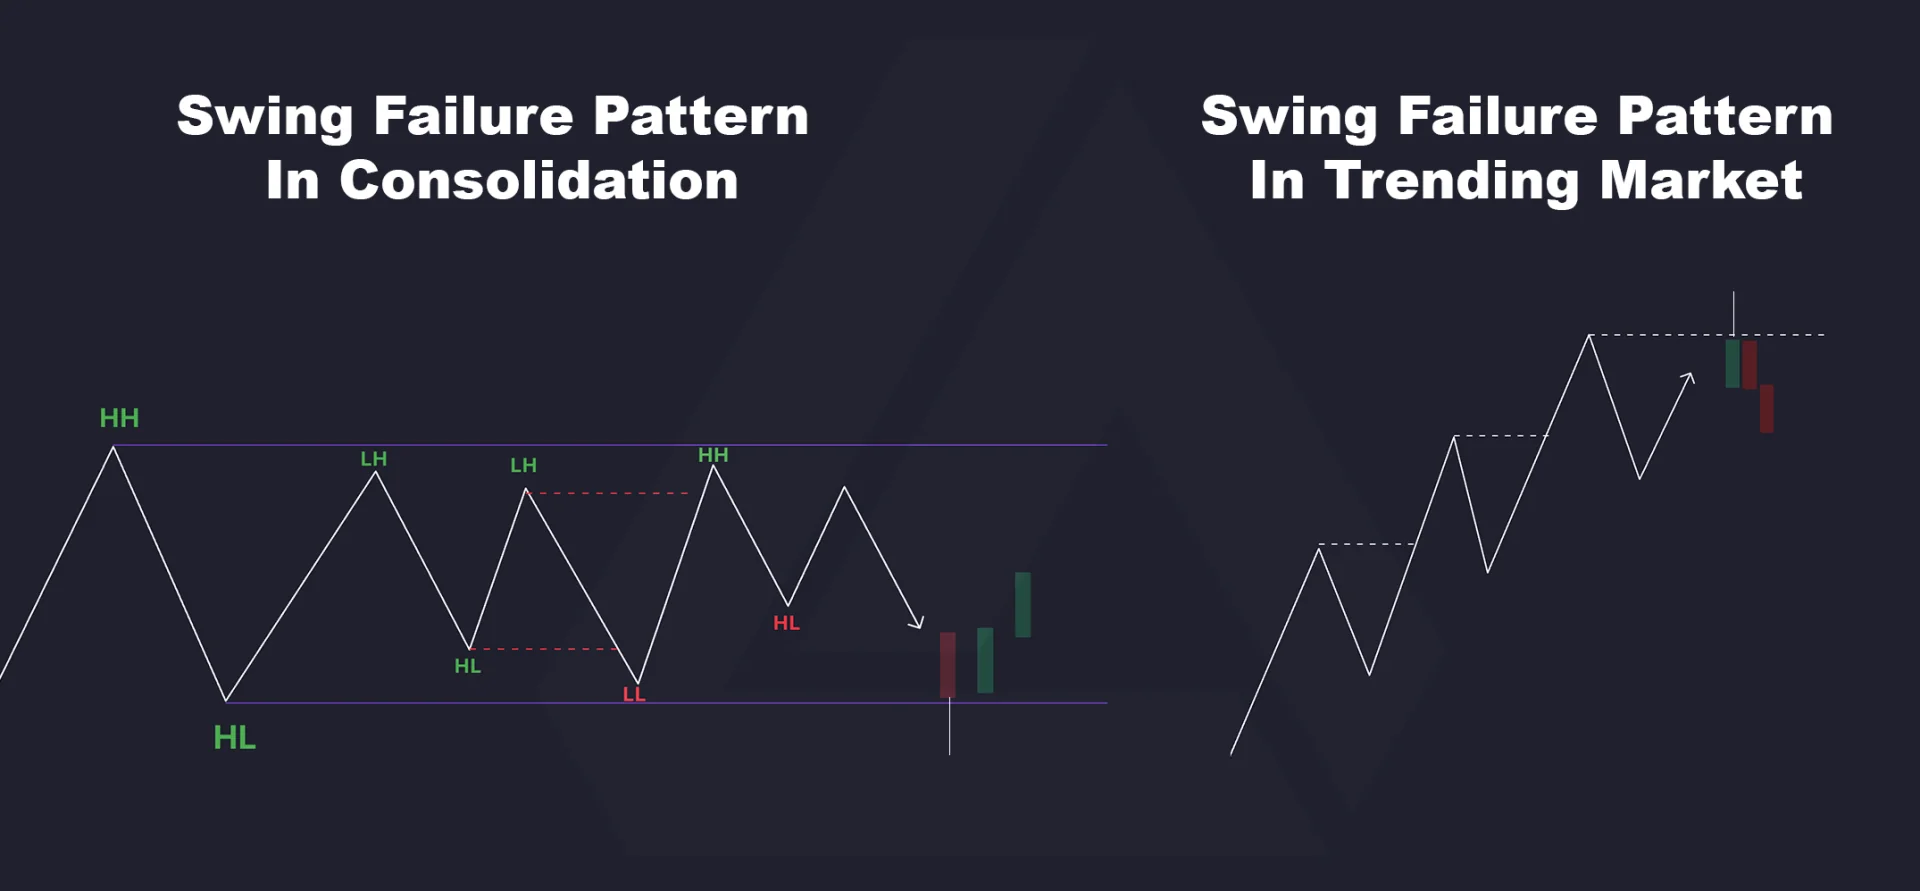
These labels are not universally exclusive. Some traders use false breakout broadly for a failed attempt beyond a level, which can include an SFP. Others distinguish a single-candle wick rejection from a multi-candle move that first closes outside a range and later returns. Write down the actual sequence instead of relying on the name alone.
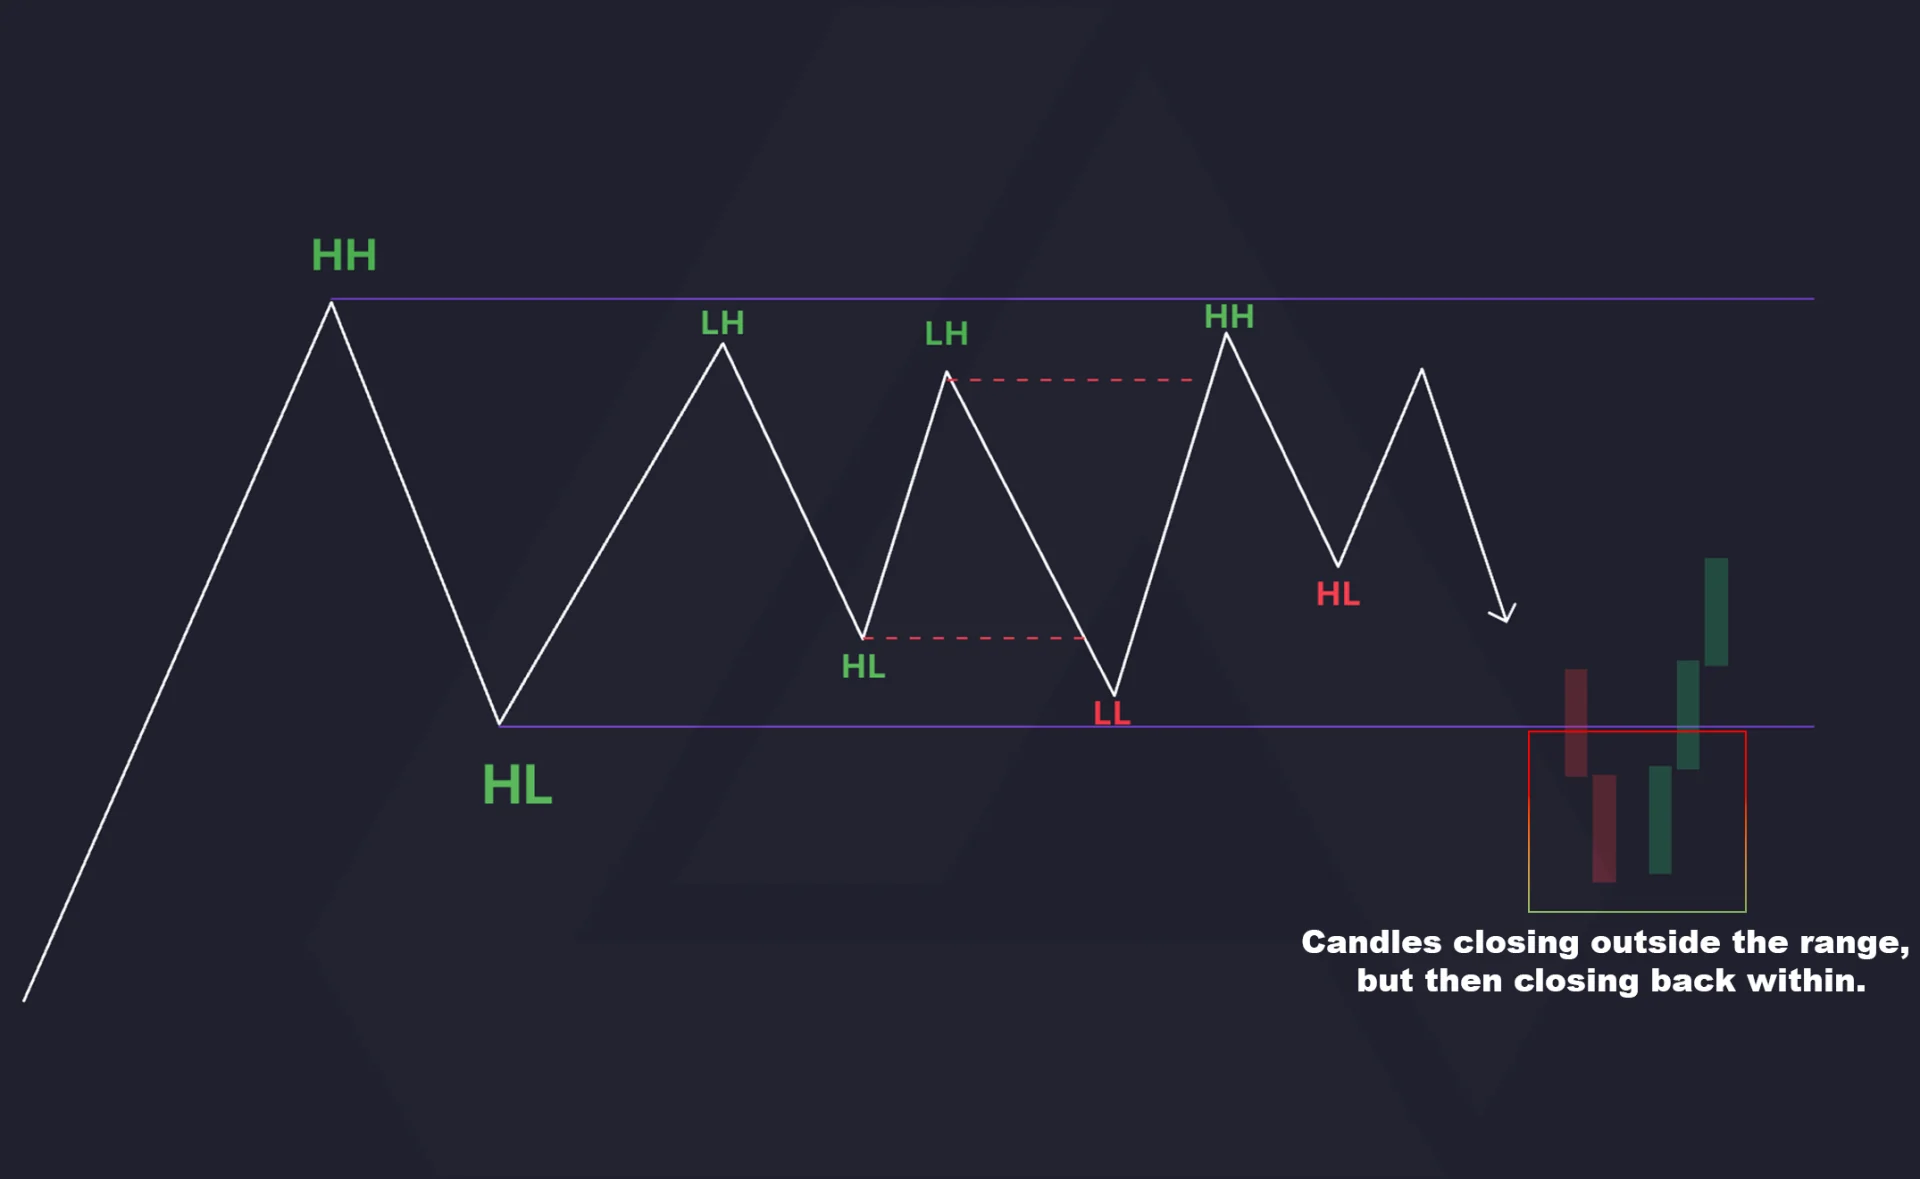
An SFP can occur at a range boundary or at a selected swing in a trending market. A consolidation range itself needs a reproducible boundary rule. Do not redraw it after the outcome or require every trader’s definition of a false breakout to use the same range structure.
| Concept | What is being observed | Why it is not interchangeable |
|---|---|---|
| Price SFP | A move beyond a selected price swing followed by a return | The swing rule, candle conditions and timing define this setup |
| RSI failure sequence | A sequence of turns and threshold behavior in an oscillator | It is measured in RSI values, not simply a wick beyond a price level |
| Wyckoff spring or related range analysis | A test below support within a broader range interpretation | The surrounding structure and method add conditions beyond one candle |
| Liquidity-sweep interpretation | A move through a level where traders suspect orders may cluster | The chart alone does not reveal hidden orders or prove who caused the move |
The original article associated the price pattern with Trader Dante and older technical-analysis methods. Similarity does not establish an inventor, the earliest use of a name or a direct historical lineage. The useful comparison is between observable rules. In particular, Wilder’s RSI failure sequence and a price SFP should not be treated as the same calculation.
What the LuxAlgo Volume Filter Actually Measures
The indicator offers no volume validation, a lower-side threshold condition or an upper-side threshold condition. Its published source requests lower-timeframe closes and volumes, then classifies each retrieved lower-timeframe candle by where its close lies relative to the swing level.
- For a bearish SFP, volume from a lower-timeframe candle is counted outside when that candle closes above the swing high.
- For a bullish SFP, it is counted outside when the lower-timeframe candle closes below the swing low.
- The outside percentage is the sum of those selected volumes divided by all retrieved lower-timeframe volume, multiplied by 100.
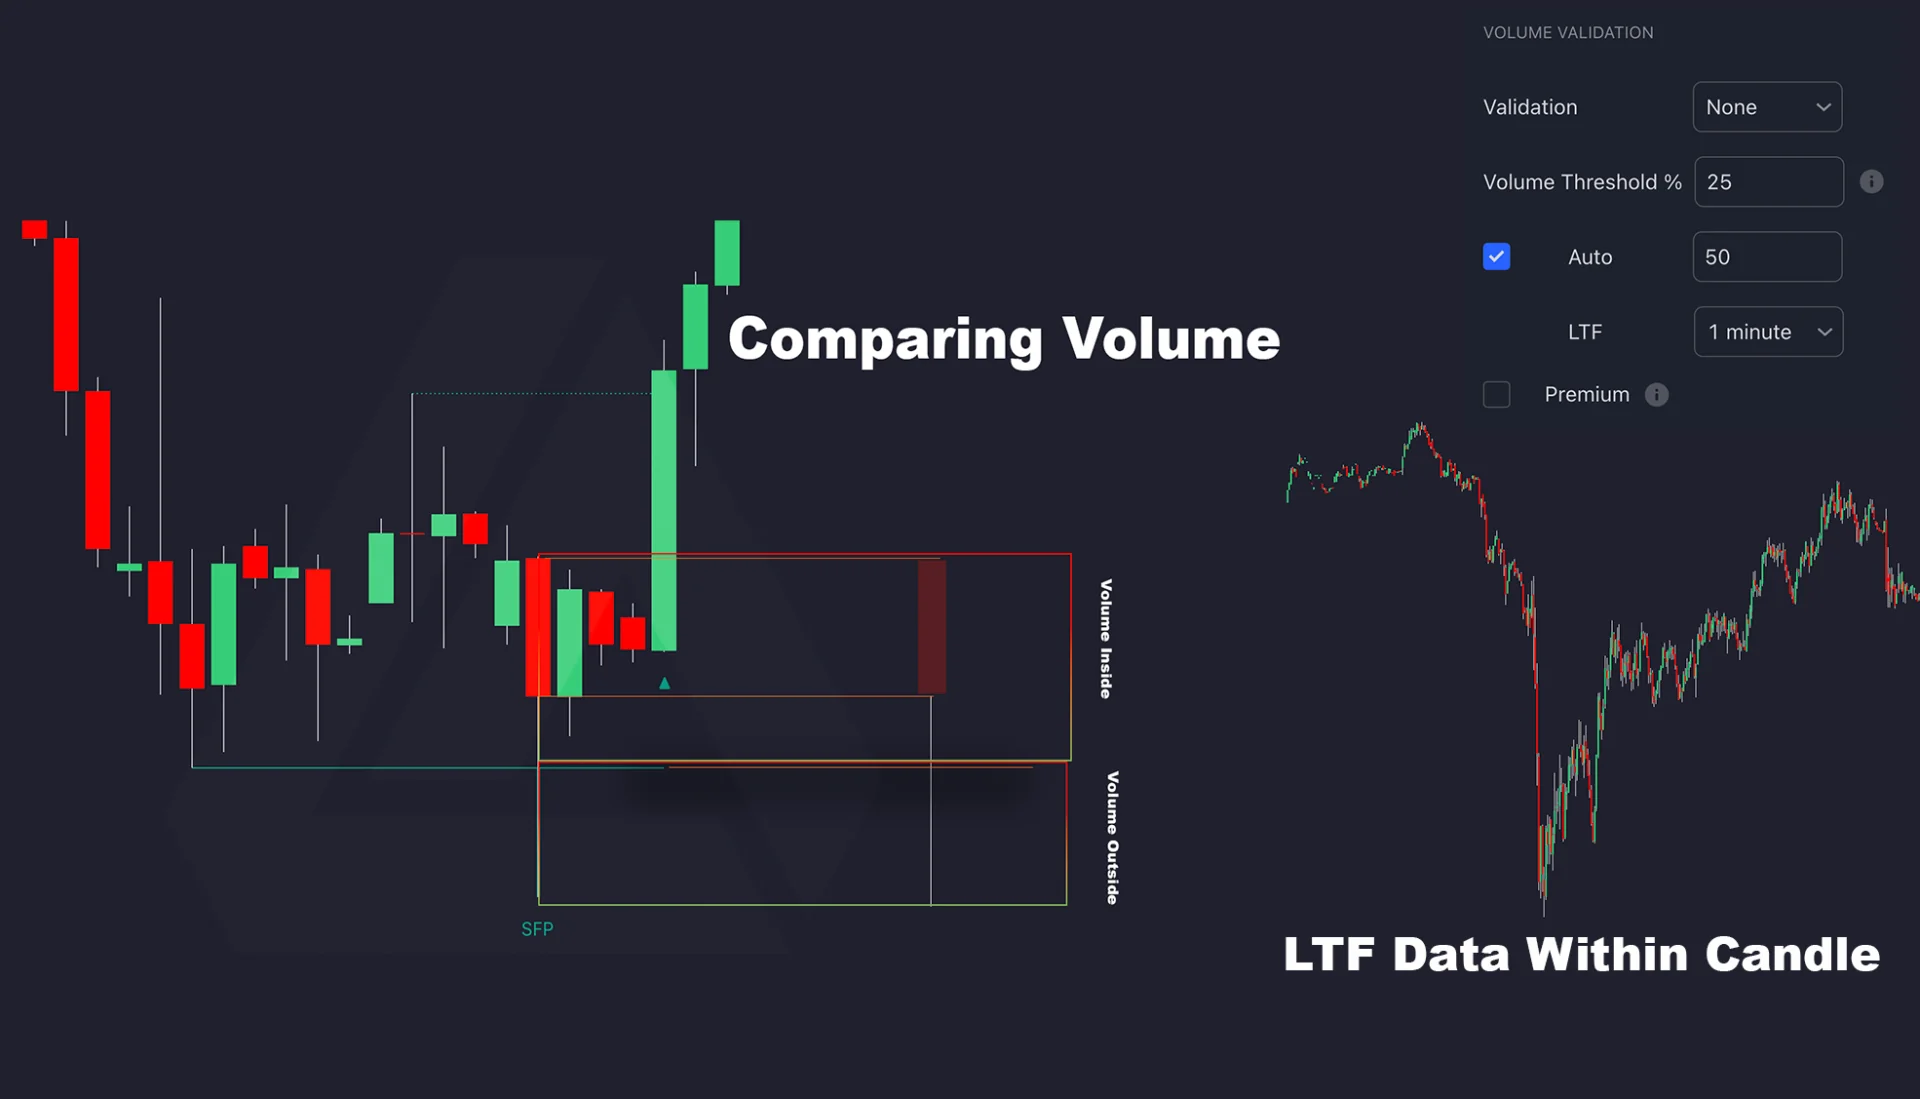
This is a proxy. If a lower-timeframe candle trades on both sides of the level but closes outside, its entire volume is assigned to the outside group. That is different from measuring the exact executed quantity beyond the level, identifying buyer or seller aggression, or observing resting orders in an order book.
For example, suppose retrieved candle volumes are 40, 35 and 25, and only the first candle closes beyond the level. The proxy reports 40% outside volume. It cannot tell you how much of that first candle’s 40 actually traded outside, or whether the other candles briefly traded there before closing inside.
Thresholds and Missing Data Need Care
The inspected source rejects a higher-side condition when the computed percentage is below the threshold, and rejects a lower-side condition when it is above the threshold. Consequently, equality passes either mode even though the setting labels use greater-than and less-than symbols. Record the implementation being tested rather than inferring every detail from a label.
When no lower-timeframe candles are returned, the inspected code does not run that comparison and can leave a candidate valid. It also does not explicitly guard a zero total volume before the division. A displayed candidate therefore does not by itself prove that a meaningful volume filter was applied. Check coverage, missing values and the actual timeframe used.
Changing the lower timeframe can change the proxy, because it changes the aggregation. Compare the same symbol, source and available history. A stricter threshold is another hypothesis to test; it is not an automatic accuracy improvement.
Volume Does Not Reveal Every Order
A wick beyond a swing can be consistent with several market processes. Candles and aggregated volume do not establish that stops were present at a particular price, identify the participants or prove deliberate stop hunting. Even an order-book view shows only the orders exposed by that feed at that moment; it is not a complete map of hidden intentions.
Centralized exchange data can offer useful detail, but its coverage still matters. A single equity venue is not the consolidated market. Crypto venues have different trades, and some instruments or feeds provide different forms of volume. Do not compare a volume threshold across sources as though the underlying measurements were identical.
Research the Setup in LuxAlgo’s Native Platform
Start from the current SFP Library page and its native-chart access. Fix the symbol, interval, swing rule and candle-close requirements first. The historical figures above explain the setup; they do not establish identical behavior across every platform version.
Ask Quant, our coding agent to express a supported strategy hypothesis, including the entry variant, adverse exit, target and sizing. Inspect the generated code and run it manually. Review strategy settings and individual trades with realistic costs and a later evaluation period.
Check native data coverage before adding volume conditions. The documented US-equity source is Cboe EDGX rather than a consolidated all-venue feed. Native executed-volume analytics, where supported, are distinct from this indicator’s lower-timeframe close-based proxy and from live resting-order depth.
Frequently Asked Questions
Is a price swing failure the same as an RSI failure sequence?
No. A price SFP uses a move beyond a selected price swing and a return. An RSI failure sequence is defined by turns and thresholds in the oscillator.
Where does a bullish SFP place its adverse-exit reference?
A common reference is below the rejected lower wick, with a defined buffer. The order type, sizing and execution risks still need to be specified; the pattern does not guarantee a fill or maximum loss.
Does the volume filter measure exact volume traded outside the swing?
No. The inspected source groups entire lower-timeframe candle volumes according to whether their closes are beyond the level. This is an aggregation proxy, not exact volume at each price.
Does an SFP prove institutional stop hunting?
No. A price rejection does not identify the traders involved or reveal hidden orders. That interpretation requires evidence beyond the candle pattern.
Does a confirmation triangle guarantee a reversal?
No. It marks the indicator’s opposite-level condition. Its timing and the behavior of unconfirmed candidates must be understood before turning it into a trading rule.
Read next