Inside & Outside Bars: Signal Insights for Trades
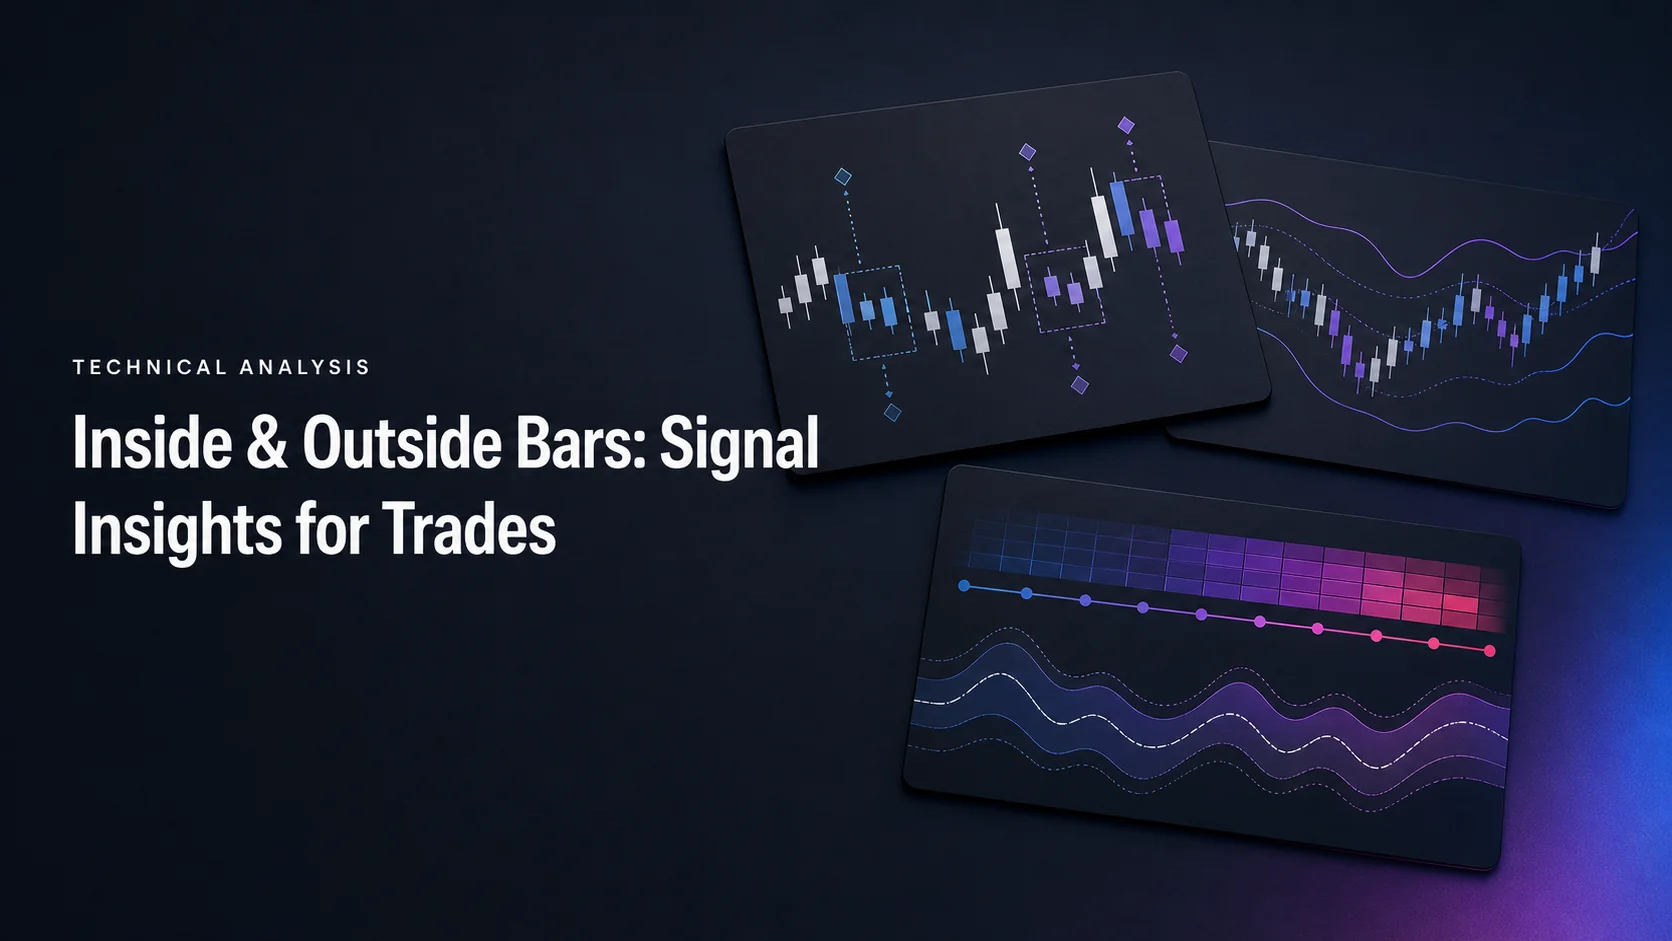
Inside and outside bars describe how a candle’s full high-low range relates to the preceding candle. An inside bar records contraction; an outside bar records expansion beyond both previous extremes. Neither formation determines the direction of the next move. Location, the close, and a clearly defined entry rule give the pattern its trading context.
Use LuxAlgo’s charting and AI platform to inspect these relationships, compare examples, and test explicit rules. Quant Charts provides the chart workspace, the Library includes bar-classification tools such as The Strat, and Quant, our coding agent, can help turn a precise definition into a study or strategy that you inspect and run manually.
Key Takeaways
- Inside bar: under a strict definition, its high is lower and its low higher than the preceding “mother bar.”
- Outside bar: its high exceeds the previous high and its low falls below the previous low. A bullish or bearish close is an additional filter.
- Context: support, resistance, trend and volume help frame a hypothesis; they do not guarantee a successful breakout.
- Execution: specify which bar supplies the trigger and stop, when the signal is confirmed, and how much the position can lose before costs.
| Pattern | What it establishes | What it does not establish |
|---|---|---|
| Inside bar | Containment within the prior high-low range. | Breakout direction or a guaranteed move. |
| Outside bar | Expansion beyond both prior extremes. | The order in which those extremes were reached. |
| Harami / engulfing candle | A relationship between candle bodies under the chosen definition. | Necessarily an inside / outside relationship between full ranges. |
Inside Bar Trading Methods
Inside Bars: Up vs Down Trends
In an uptrend, an inside bar near support can be studied as a pause before possible continuation. In a downtrend, the corresponding setup may occur near resistance or a declining trendline. An inside bar can also appear at a turning point. The pattern itself remains direction-neutral.
For example, a mother bar with a high of $105 and a low of $95 contains a subsequent bar with a high of $102 and a low of $98. Under a strict rule, a second high of exactly $105 would not qualify. Some implementations allow equality at one extreme; choose the convention before comparing signals or backtests.
A smaller contained range describes greater contraction relative to that mother bar. It does not, by itself, establish a higher probability of a profitable breakout. An unusually large mother bar can contain several ordinary candles without indicating exceptional compression.
Trading Inside Bar Breakouts
Keep the inside bar’s range separate from the mother bar’s range. In the example above, trading above $102 enters before price has cleared $105. These are different setups with different stop distances and exposure to failed breaks.
| Approach | Example trigger | Invalidation choice to test |
|---|---|---|
| Mother-bar breakout | A move above $105 or below $95 after the inside bar is confirmed. | The opposite mother-bar extreme, or another explicitly defined level. |
| Inside-bar breakout | A move above $102 or below $98. | The opposite inside-bar extreme; a tighter stop may be reached more often. |
| Several bars within one mother bar | Keep the original $105–$95 boundaries until the setup expires or resolves. | Do not silently switch the stop or trigger to the last contained candle. |
The PriceAction.com inside-bar tutorial describes the mother-bar trigger as a classic approach and discusses both trend and countertrend variations. Treat that as a trading method to evaluate, not evidence of a universal success rate. A stop order may fill beyond its trigger during a gap or fast move.
Inside Bars in Trending Markets
Use a consistent trend definition, such as price relative to a 20-period EMA, the relationship between 20- and 50-period EMAs, or a sequence of swing highs and lows. Record support and resistance before the trade. Drawing a favorable trendline afterward introduces hindsight.
Several bars can remain inside the same mother bar without each fitting inside the immediately preceding bar. A truly nested sequence meets that additional condition. Daily charts provide a different aggregation of prices from intraday charts; neither timeframe has an automatic reliability advantage across all instruments.
How to Trade Inside & Outside Bar Strategies
Outside Bar Trading Methods
Outside Bars: Up vs Down Trends
If the previous bar spans $98–$102, a new bar spanning $97–$103 is an outside bar. A close near $103 gives a bullish interpretation under many methods; a close near $97 gives a bearish interpretation. Requiring a close above $102 or below $98 is a stricter directional filter, not part of the basic range definition.
The candle’s body need not engulf the previous body, and its color alone is insufficient to describe where it closed within the full range. A small body with long wicks can still be an outside bar.
| Market context | Candidate reading | Evidence to record |
|---|---|---|
| Uptrend | Possible continuation after expansion. | Close location, prior resistance and subsequent follow-through. |
| Downtrend | Possible continuation lower. | Close location, prior support and subsequent follow-through. |
| Extended move at a major level | Possible reversal. | Whether price rejected the level or remained beyond it. |
| Sideways range | Expansion that may still remain inside the broader range. | Whether the broader boundary actually broke; a two-bar pattern alone is insufficient. |
Trading Market Reversals
A bearish outside bar after an advance may motivate a reversal study, especially near previously identified resistance. A bullish outside bar at support offers the opposite hypothesis. Wait for the selected close or subsequent trigger before treating the pattern as confirmed.
For a bullish setup, a stop beyond the outside bar’s low is one possible invalidation; for a bearish setup, the high is the corresponding reference. A wide outside bar can make that stop expensive in price terms, requiring a smaller position. It does not justify increasing the risk budget.
Outside Bars in Sideways Markets
Compare the outside bar with the entire consolidation area, not just the preceding candle. Price can exceed both of yesterday’s extremes and still finish in the middle of a longer range. Volume, a close beyond the broader boundary, or a momentum filter can define additional conditions, but none eliminates false breaks.
OHLC data does not reveal whether the high or low came first. If a strategy places orders on both sides and both levels are touched within one candle, use suitable lower-timeframe data or an explicit conservative execution assumption. Do not choose whichever sequence produces the better result.
Technical Analysis Integration
Support and Resistance Analysis
Support and resistance supply context rather than automatic confirmation. The PriceAction.com tutorial illustrates a pin-bar rejection at support followed by an inside bar; that historical example explains a setup, but it does not establish how often the combination succeeds.
| Location | Question before entry |
|---|---|
| Inside bar at support | Is the proposed trade a trend continuation or a countertrend reversal, and which boundary must break? |
| Inside bar at resistance | What would invalidate the bearish hypothesis if price resolves upward? |
| Outside bar at support | Did price reject support or close through it? The same location can lead to different readings. |
| Outside bar at resistance | Did the close reclaim the range or remain above resistance? Record the actual behavior. |
Use the Library’s support and resistance reference and trendline guide when comparing static and dynamic levels. The Candle Body Support and Resistance indicator offers another way to study levels. Compare each tool’s definition with your manually chosen levels rather than assuming different methods identify the same boundary.
Adding Trend Indicators
Moving averages, RSI and MACD can make a trend or momentum filter explicit. For example, require a completed close above both the 20- and 50-period EMAs before considering a bullish break. Then compare that version with an otherwise identical version without the filter. Several indicators derived from the same prices are not necessarily independent evidence.
Volume Pattern Confirmation
Compare breakout volume with an appropriate recent baseline for the same instrument, feed and session. Higher volume establishes increased activity; it does not prove that a move is authentic or will continue. Missing volume is not zero activity. In Quant Charts, check market-data coverage: exchange-specific volume should not be described as consolidated market volume.
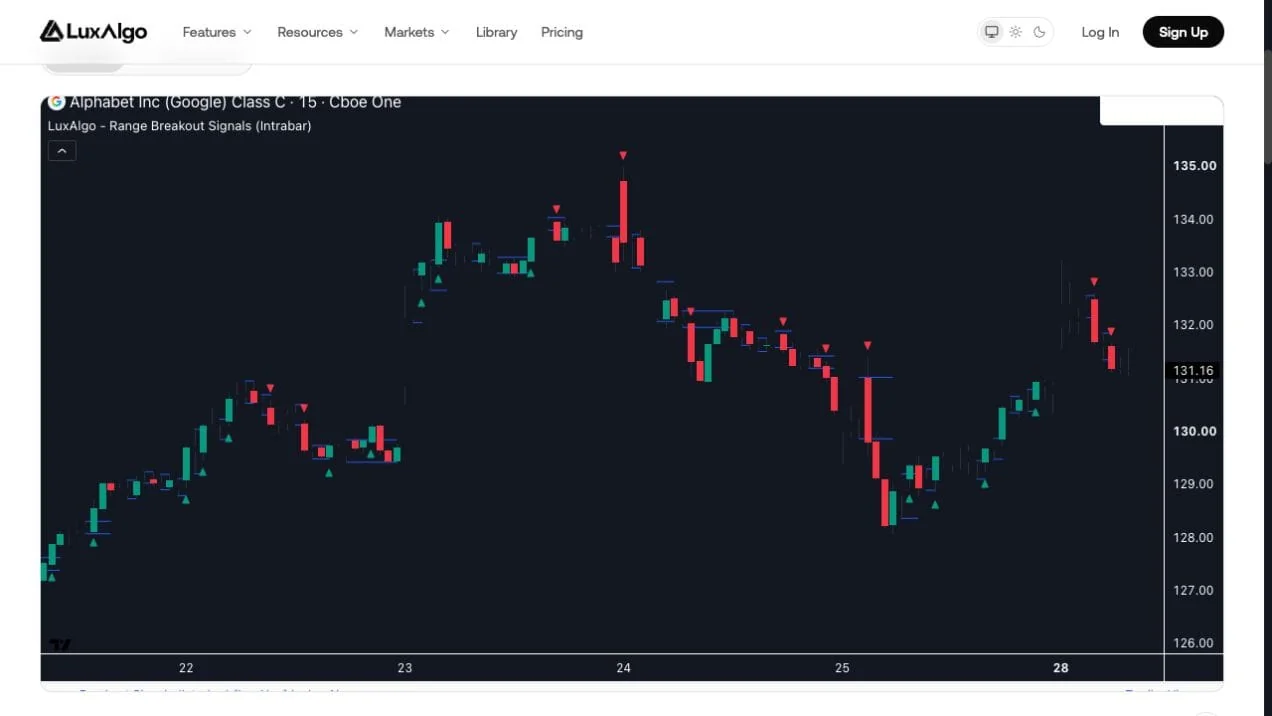
Range Breakout Signals (Intrabar) is a related LuxAlgo tool with different logic. It uses lower-timeframe price behavior to classify a chart candle as trending or ranging and looks for breaks of a ranging candle’s extremes. It is not simply an inside/outside-bar detector and does not guarantee precise entries.
A LuxAlgo Workflow for Bar-Pattern Research
Start with The Strat Library indicator for a dedicated bar-classification vocabulary: 1 denotes an inside bar, 2 a directional bar breaking one side, and 3 an outside bar. Its counts describe occurrences, not profitable trades. Pivot-combo statistics use a lookback and should not be mistaken for signals known at the earlier pivot.
Candlestick Structure is a separate tool covering classic formations such as harami and engulfing patterns. Its trend-alignment percentage measures agreement with the selected trend definition, not a probability of winning. Full-range bar comparisons and body-based candlestick formations need separate rules.
On Quant Charts, keep the symbol, venue, session and timeframe consistent while checking examples. Use the chart’s drawing tools to mark a mother bar’s high and low. The platform demonstration below shows adding a drawing tool; the same preparation helps make the boundary used in your research visible.
Ask Quant, our coding agent, to implement a small, testable study first:
On completed candles, identify strict inside bars using high < previous high and low > previous low. Store the previous candle’s high and low at confirmation. For the next three completed bars, record the first close outside those fixed boundaries, then expire the setup. Ignore new overlapping setups while one is active. Report direction and occurrence counts without assuming trades.
This is a study, not yet a complete strategy. Add order timing, entry price, stops, exits, sizing and costs before evaluating returns. Follow Making Strategies with Quant: inspect the generated code and run it manually, then check individual events against the chart. Do not backdate a close-confirmed signal to an earlier intrabar price.
Risk Control Methods
Setting Stop Losses
Choose the invalidation that matches the setup: the inside bar, mother bar, outside bar or a separately defined structural level. An ATR-based distance is another rule to test. State the ATR length, multiplier and price anchor. A tighter stop changes both position size and the chance of being stopped; it does not automatically improve the strategy.
Calculating Trade Size
First select a risk budget appropriate to the account and instrument. A percentage such as 1% is an illustrative input, not a universally suitable recommendation. For shares, planned quantity before costs equals dollar risk divided by entry-to-stop distance. Futures and forex also require the contract’s point or pip value and any account-currency conversion.
Consider a hypothetical $10,000 USD account with a 1% budget: $100. For EUR/USD, assume a pip is 0.0001 and one 10,000-unit mini lot is worth $1 per pip. A 10-pip stop therefore risks $10 per mini lot, not $100. Ten mini lots, or 100,000 units, would risk $100 before spread, commission and slippage. This arithmetic is not a recommendation to use that leverage; check margin requirements and actual broker specifications.
For a share example, an entry at $105.10 and stop at $102.60 creates $2.50 of planned risk per share. A $100 budget allows 40 shares before costs. A target at $110.10 offers $5 per share, or 2R. Actual loss can exceed the calculation when execution is worse than assumed.
Managing Trades
- Define whether to exit all at a target or take partial profits at a level such as 2R or 3R. Compare the resulting average outcome after costs.
- Specify how a reversal signal changes the trade; avoid discretionary rule changes that cannot be reproduced in the test.
- Set position size using the initial invalidation distance. Do not widen a stop or add exposure merely to avoid realizing a loss.
- Evaluate drawdown, trade count and unseen history as well as the equity curve. Record every parameter variation tried.
Conclusion: Putting Patterns into Practice
Main Pattern Concepts
Inside bars identify containment; outside bars identify expansion beyond both prior extremes. Trend, levels, close location and volume give these simple observations context. A pattern becomes a strategy only after execution, invalidation, sizing and exit rules are defined.
Implementation Steps
- Choose strict or inclusive range comparisons and distinguish mother-bar breaks from inside-bar breaks.
- Review trend and countertrend examples, including failed setups, on a consistent feed and timeframe.
- Use Quant Charts and Library tools to inspect the pattern, then develop explicit rules with Quant.
- Verify event timing and position-size arithmetic, include costs, and evaluate unseen data before relying on results.
Frequently Asked Questions
What is the difference between an inside and outside bar?
An inside bar is contained within the preceding bar’s high-low range; an outside bar exceeds both preceding extremes. Neither alone determines the next move.
Must an outside bar close beyond the previous high or low?
No. That is an additional directional filter. The basic outside-bar definition compares the two highs and two lows.
Is an inside bar the same as a harami?
No. An inside bar compares full ranges including wicks, while a harami compares candle bodies under its chosen definition.
Should I trade the inside bar or mother bar breakout?
They are different setups. Specify which boundary triggers the entry and which level invalidates it, then evaluate each version consistently.
Does rising volume guarantee a valid breakout?
No. It indicates increased activity on the selected feed, but a high-volume breakout can still fail.
How much does a ten-pip stop risk on one mini lot?
For a USD account trading EUR/USD with a mini lot worth $1 per pip, ten pips risks $10 before costs. Pip values vary with the pair, quantity and account currency.
References
LuxAlgo Resources
- The Strat
- Candlestick Structure
- Range Breakout Signals (Intrabar)
- Support and Resistance Zones
- Trendline Guide
- Candle Body Support and Resistance
- Quant Charts Data and Market Coverage
- LuxAlgo Quant
- Making Strategies with Quant
External Resources
Read next