Intraday Breakout Strategies Using Support Levels
An intraday support breakout is a move below a price area that previously attracted buying. Traders use it to look for downside continuation, often entering after a completed candle closes below support or after a failed retest. The useful question is whether the entry, exit, and position size form a repeatable plan—not whether one red candle guarantees a trend.
LuxAlgo brings native charts, order-flow analysis, and Quant, our coding agent, into that workflow. You can map the support area, inspect participation where the data supports it, and turn a precisely defined breakout rule into a historical test. This guide explains how to connect those steps without confusing a visual signal with a profitable strategy.
Key Takeaways
- Define support before the break: Use a marked price zone, a completed session level, or an explicit rolling-low rule.
- Choose one entry method: A close below support and a failed retest have different timing and trade-offs.
- Use volume as context: Compare equivalent session periods; no volume multiple eliminates false breakouts.
- Match the stop to direction: A protective buy stop for a short belongs above the relevant price structure. Position size follows the stop distance.
- Test after costs: Review losing trades, execution assumptions, and unseen periods as carefully as winners.
Video: Evaluating False Breakouts
TradingLab’s third-party tutorial illustrates false-breakout concepts. Its techniques are ideas to evaluate, not a way to avoid every losing trade.
Finding Strong Support Levels
Support is an area where buying has previously interrupted a decline. As Fidelity’s support and resistance guide explains, broken support can subsequently act as resistance. That possible role reversal is the basis of the failed-retest entry.
Horizontal Support Areas
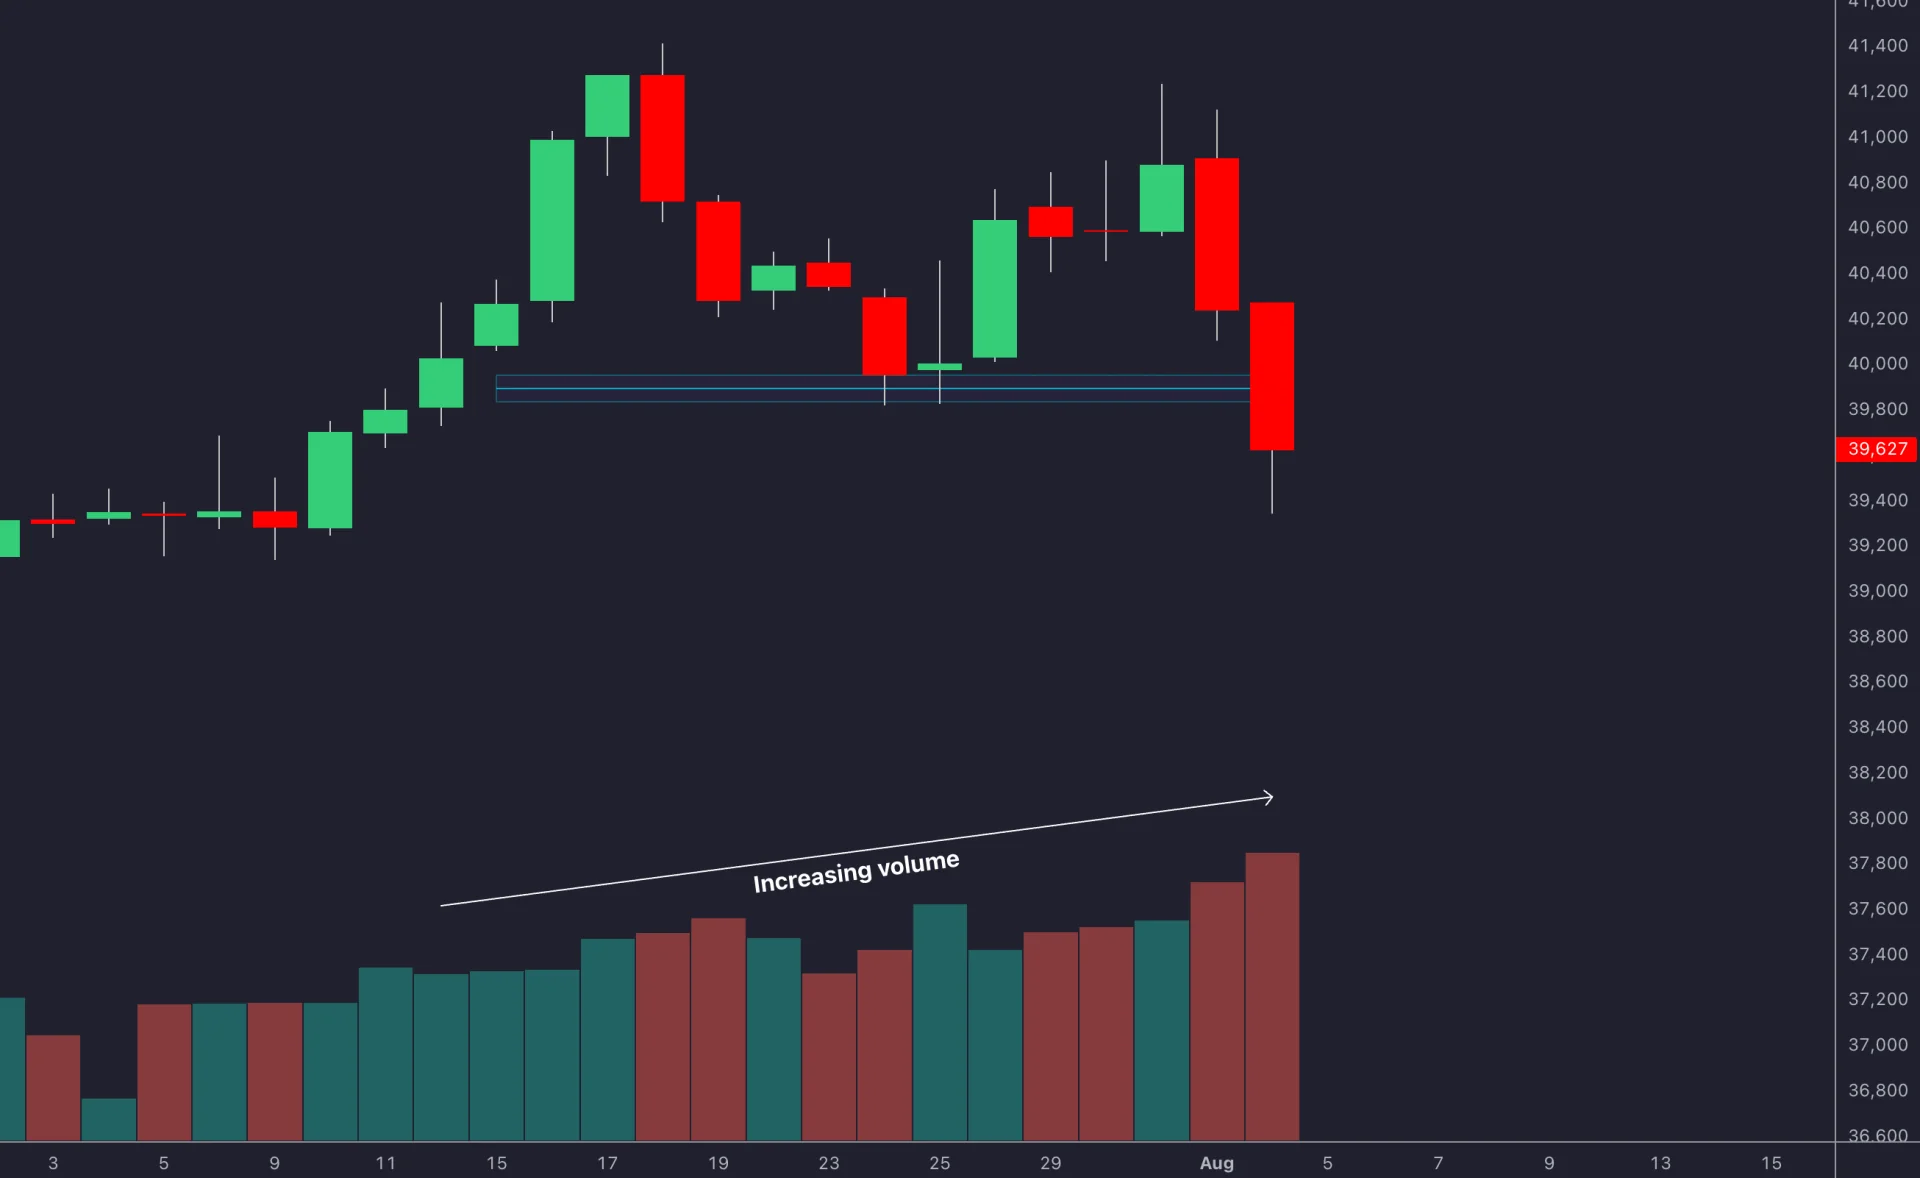
Start with previous reaction lows, the prior session’s low, or a clearly bounded consolidation. Draw a zone around the relevant prices rather than assuming an exact cent must hold. Round numbers can help organize the chart, but a round number alone is not evidence of demand.
Record when the level became available. A swing low that requires later candles for confirmation cannot justify an earlier entry. Repeated touches make an area visible, but do not establish a universal probability that it will hold or break.
Volume and Liquidity Checks
A breakout with expanding volume may indicate greater participation. Compare the current bar with a baseline that fits the instrument and time of day: opening activity and a quiet midday period are not interchangeable. A threshold such as twice average volume is a test parameter, not a universal definition of a valid breakout.
Also inspect the bid-ask spread and realistic order size. A dramatic candle in a thin market can offer poor execution even when its volume is unusually high. Candle volume alone does not reveal resting liquidity or identify the traders involved.
Support Level Tools on LuxAlgo Charts
Use native volume profiles to compare the support zone with areas where trading concentrated. Session and Rolling profiles use footprint-level data on supported symbols. Visible Range uses candle volume, works across markets, and recomputes when you pan or zoom; its directional coloring is not an aggressor buy/sell split.

For an intraday decision, use a previous completed session’s levels or the developing profile available at that moment. The current session’s final point of control and value-area boundaries are future information earlier in the day. A profile’s value-area percentage describes included volume, not the probability that a support level will hold.
For automated visual structure, the open-source Breakouts with Tests & Retests indicator marks swing-derived areas and uses candle opening and closing interactions to distinguish breaks, tests, and retests. Review its confirmation timing before using historical drawings as entry evidence. It is a separate Library indicator, not the native volume-profile engine.
Breakout Signals and Risk Control
Choose a Breakout Entry Rule
| Approach | Example short trigger | Main trade-off |
|---|---|---|
| Close below support | A completed five-minute candle closes below the premarked zone; enter using a specified subsequent order. | Can participate without a retest, but may enter an extended move. |
| Failed retest | After the break, price returns to the former support zone and closes back below it within a defined number of bars. | May offer a closer structural stop, but many breaks never retest. |
| Multi-timeframe filter | Take either trigger only when a condition on the last completed hourly candle agrees. | Reduces some trades and adds delay; the still-forming hourly candle can change. |
Specify whether a wick through support counts or a closing price is required. A bearish engulfing formation can add context, but its defining relationship concerns the real bodies of the candles, not necessarily the entire high-low ranges. Whatever pattern you choose, define its boundaries consistently.
Using Momentum Indicators
RSI below 30, a bearish MACD crossover, or Stochastic %K below %D near the lower end of its range can describe downside momentum. They do not prove continuation: an oscillator can stay oversold during a decline or turn upward after an exhausted move.
Pick a filter with a clear job and compare the strategy with and without it. Requiring RSI, MACD, and Stochastic to agree may largely repeat information derived from the same price series. More agreement is not automatically more independent evidence.
Check Participation with Native Volume Delta
On supported symbols, Volume Delta and Cumulative Volume Delta provide a different view. Total-mode delta subtracts sell-aggressor volume from buy-aggressor volume; CVD accumulates it. Negative delta during a support break shows more sell-side aggression in that feed, not proof that institutions are selling or that price must keep falling.
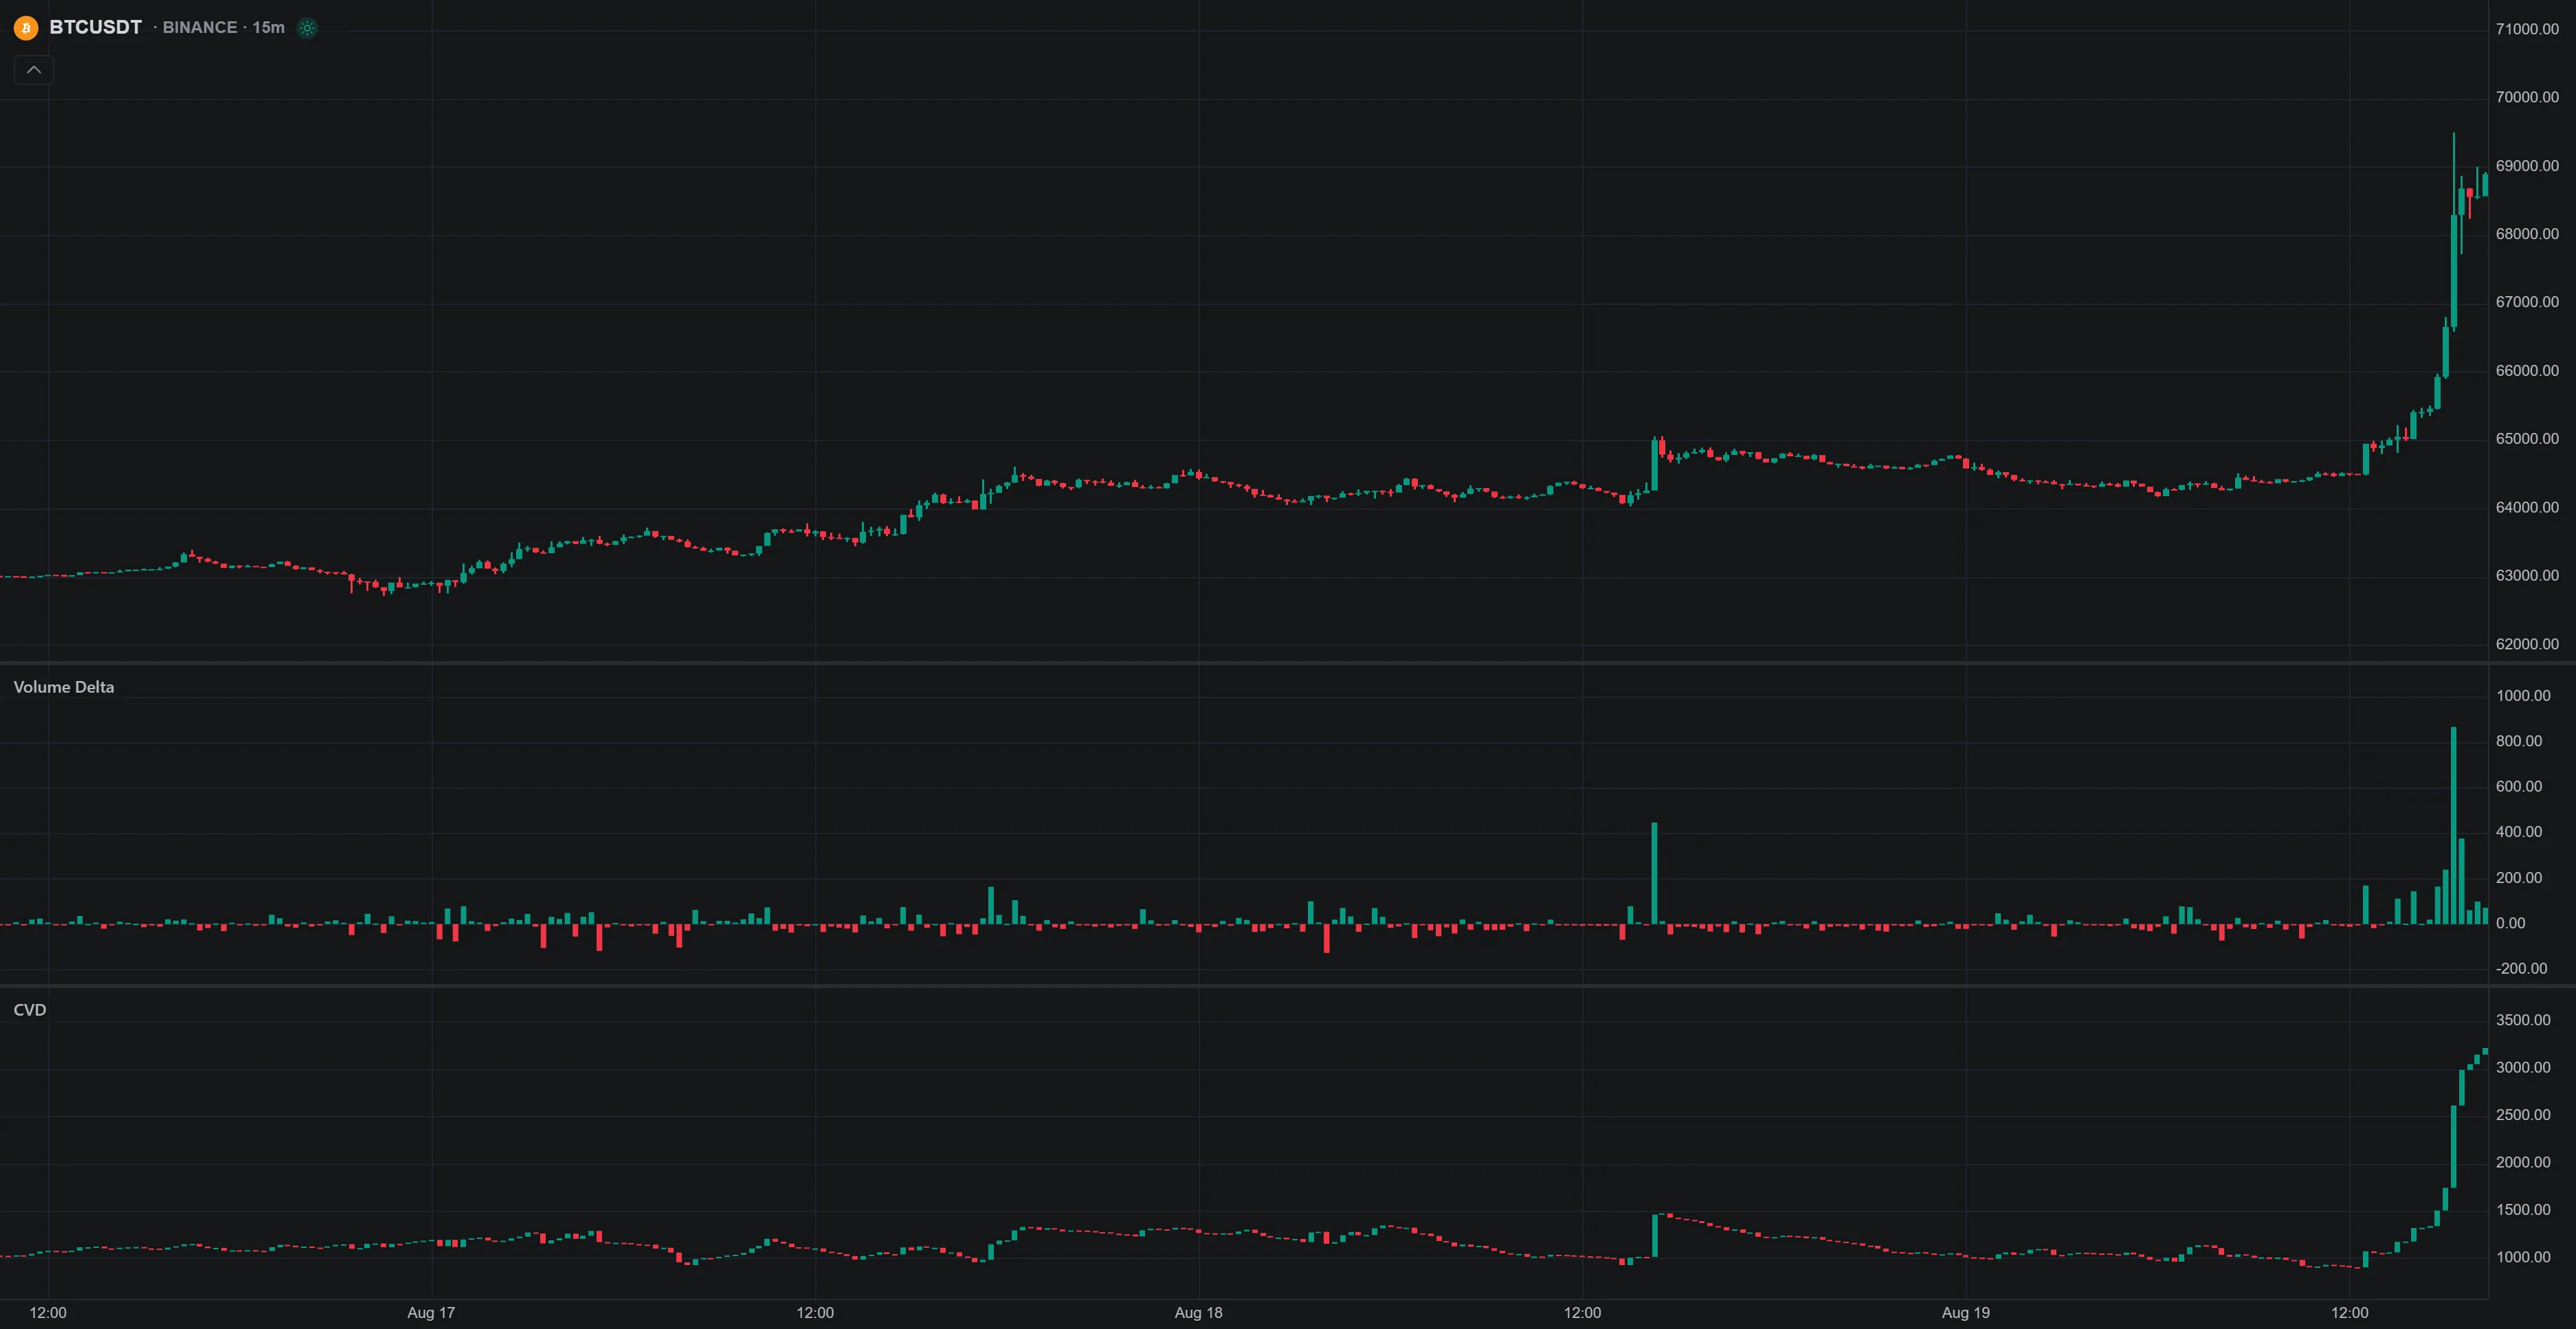
For a daily cumulative view, explicitly choose a Day anchor and check its UTC reset. Month is the default. Keep Total mode when evaluating net volume; Average mode instead compares average trade size on each side.
Footprint data availability matters. Native footprints cover supported crypto venues and U.S. equities through Cboe EDGX; that equities feed is not a consolidated view of every exchange. Forex, commodities, and CME futures do not currently have native footprint data. A candle-based futures breakout test should not claim a native footprint confirmation it cannot access.
Inspect the Break with Footprints
Official LuxAlgo demo of native footprint controls. Use footprints to inspect executed volume at price around the break; they are not a display of unfilled orders.
Stop-Loss and Profit Targets: A Worked Short Example
Suppose a stock has a premarked support zone of $99.80–$100.10. A five-minute candle closes at $99.50, and the subsequent short entry actually fills at $99.40. The completed signal candle’s 14-period ATR is $0.60. All figures below are hypothetical.
A stop at $100.30 sits above the zone and $0.90 above entry, equal to 1.5 times that ATR. This is an example placement to evaluate, not a recommended multiplier for every market. ATR measures volatility, not the direction of the next move.
| Calculation | Hypothetical result |
|---|---|
| Price risk per share | $100.30 − $99.40 = $0.90 |
| Planned risk budget, including a $10 total cost allowance | $100; amount available for price risk = $90 |
| Maximum size under those assumptions | $90 ÷ $0.90 = 100 shares |
| Target at twice the initial price risk | $99.40 − (2 × $0.90) = $97.60 |
| Profit if covered at the target | $180 before costs; $170 after the assumed $10 |
| Loss if covered at the stop price | $90 before costs; $100 after the assumed $10 |
The gross target is 2R, but the assumed net reward-to-risk ratio is 1.7:1. Check whether intervening support makes that target plausible before entering. Size also depends on buying power, borrow availability, and the instrument’s contract value; the share calculation is not a futures sizing formula.
A stop order does not guarantee its execution price. If the buy-to-cover fill is $101.40, this example loses $200 before costs, or $210 with the same allowance. A stop-limit order can remain unfilled. Define a session-end exit and a daily loss limit as well as the individual trade stop.
The Library’s Volume Delta Trailing Stop offers a separate trailing reference based on lower-timeframe candle-volume estimates. It is not a position-size calculator, and its volume proxy should not be confused with native footprint aggressor data.
Test a Precise Support-Breakout Rule with Quant
After mapping discretionary setups, use Quant to build a strategy with explicit conditions. A reproducible baseline can use the lowest low of the previous 20 completed five-minute bars. This rolling-low definition differs from a manually drawn zone or the swing logic of a Library indicator.
Build a short-only strategy on standard five-minute candles. Set support to the lowest low of the previous 20 completed bars, excluding the signal bar. Signal when the current completed close crosses below that support. Use the next bar’s open for the simulated entry, one position at a time, and no pyramiding. Freeze ATR(14) from the signal candle; set the initial stop 1.5 ATR above the entry fill and the target twice that distance below it. Add configurable entry-session and end-of-session exit rules with an explicit timezone. Expose the lookback and ATR multiplier as inputs.
Review the generated code and its fill timing before running it. Set the session inputs for the chosen venue, account for fees and slippage in Properties, and confirm that the session-end order actually exits within the intended trading session. A strategy that compiles can still implement the wrong rule.
Use the backtest report and trade log to inspect entries, exits, net profit, drawdown, trade count, and profit factor. Compare the baseline with a separately defined volume filter or retest variant. Keep a later period untouched while developing the rules, then test it without tuning to its outcome.
Check bars where both stop and target fall inside the high-low range: assumed execution order can materially change the result. A profitable historical report does not establish live profitability. Quant helps generate and test the code; it does not remove the need to inspect data, assumptions, or overfitting.
Build a Repeatable Intraday Process
- Before the session, mark support and record why it qualifies.
- Define the entry, failure condition, stop, target, and time exit before the break.
- Use volume and momentum for specific questions, with the correct feed and completed bars.
- Check execution costs and size from the actual entry-to-stop distance.
- Review the resulting trades, including failed breaks and missed retests, before changing one rule at a time.
The value of LuxAlgo’s integrated charts and Quant is that the visual idea and the test can sit in the same research workflow. The standard remains the same: a level known at the time, a rule you can reproduce, and results assessed after realistic costs.
FAQs
What is the best indicator for a breakout strategy?
There is no universal winner. On-Balance Volume (OBV) adds a bar’s volume when the close rises and subtracts it when the close falls; an unchanged close leaves OBV unchanged. It can add participation context, but it does not measure actual buy/sell aggression or reliably predict every breakout.
What is the breakout trading strategy for intraday?
It trades a move beyond a predefined level, such as support or resistance, with a planned exit within the session. A completed-candle trigger and a failed-retest trigger are different strategies; define and test them separately.
How to find breakout stocks for intraday trading?
Start with liquid stocks near an identifiable level. Review spreads, relevant news, sector context, and volume relative to comparable session periods. A 50% volume increase is a possible filter to test, not a requirement that establishes a good trade. For shorts, confirm that the instrument can actually be borrowed and traded in your account.
Which indicator is best for breakout trading?
Choose by function: price structure defines the level; volume or delta describes participation; RSI, MACD, or Stochastic describes momentum; ATR helps scale a volatility-based distance. Test whether each addition improves the rule after costs instead of treating several indicators as independent votes.
How to trade support and resistance breakouts?
Mark the level, wait for your specified trigger, and calculate size from the planned exit. For a short below support, the protective buy stop is above the relevant failure area. For a long above resistance, the protective sell stop is below it. Neither direction is protected by a guaranteed fill, and neither requires a retest unless your rule specifies one.
References
- Fidelity: Support and resistance
- Fidelity: Average True Range
- Fidelity: On-Balance Volume
- SEC Investor Bulletin: Stop, stop-limit, and trailing stop orders
- LuxAlgo: Market data and footprint coverage
- LuxAlgo: Native volume profiles
- LuxAlgo: Volume Delta and CVD
- LuxAlgo: Making strategies with Quant
- LuxAlgo: Backtest reports and strategy settings
Read next