Level 1 vs Level 2: What Traders Need to Know
Level 1 shows the top of the quoted market; Level 2 adds displayed interest at multiple prices. The difference matters when evaluating spread, available size, and potential execution. Neither label guarantees complete market coverage, immediate updates, or a profitable trading signal.
Start with the decision you need to make. A quote can help you price an order, depth can reveal the displayed liquidity behind it, and a chart can put the activity in context. LuxAlgo’s native charts and Quant, our coding agent, support chart analysis and strategy research. Their role is different from a broker’s live order-book and execution tools.
Level 1 vs Level 2 at a glance
| Feature | Level 1 | Level 2 / market depth |
|---|---|---|
| Quoted prices | Best bid and ask within the feed’s coverage | Several bid and ask prices, sometimes the full displayed book for a venue |
| Size | Displayed size at the best quotes, when provided | Displayed quantity at additional prices |
| Last trade and volume | Often bundled with quotes | May appear alongside depth; executed trades are a separate type of information |
| Order detail | No deeper order breakdown | Price-level totals or individual orders, depending on the feed |
| Participant labels | Feed-dependent | Some products show participant codes; others remain anonymous |
| Speed and cost | Depend on subscription and provider | Also depend on subscription and provider; depth does not itself mean faster |
What Level 1 tells you
The bid is a displayed buying price and the ask is a displayed selling price. Their difference is the bid-ask spread. If the best bid is $50.00 and the best ask is $50.02, the spread is $0.02. The last trade might have occurred at another price; it is not a promise that your next order can execute there.
Quote size helps distinguish a price available for a small quantity from one supported by more displayed interest. Level 1 therefore does show some resting interest: it simply does not describe the deeper book. Daily volume reports completed trading, not the quantity currently waiting to trade.
Coverage matters. A venue’s best quote and a consolidated quote across venues are different products. In U.S. equities, NBBO means National Best Bid and Offer; do not assume every screen labeled Level 1 supplies it. Check the data description, entitlement, session, and any delayed-data label.
When Level 1 may be enough
Top-of-book data can support monitoring prices, comparing spreads, and placing appropriately priced orders when deeper liquidity is not central to the strategy. That can apply to long-term investors or active traders. Experience level alone does not determine the required feed.
Its limitation becomes more important when your intended quantity exceeds the displayed size or the market is moving quickly. It cannot show the prices and quantities behind the best quote, and even that best quote can change before an order arrives.
What Level 2 adds—and what it leaves out
Depth displays additional buying and selling interest, usually arranged as a ladder or book. “Full depth” generally refers to the displayed book covered by a particular feed, not every possible source of liquidity.
For example, Nasdaq TotalView covers displayed orders on Nasdaq, including other exchange-listed securities trading there. It is not a consolidated view of every U.S. venue or undisplayed order.
Market by price versus market by order
Market by price (MBP) combines displayed quantity at each price. Market by order (MBO) exposes individual orders within the covered book. The number of levels, available identifiers, and update format depend on the product.
CME’s MBO documentation describes anonymous order and priority identifiers that help represent individual orders and queue ordering. They do not reveal customer names or firm identities. A market-maker code in another product should not be treated as the identity or intention of an underlying investor.
Time and Sales reports executed trades. A depth ladder describes displayed resting orders. Platforms may place both windows together, but their information is not interchangeable. Hidden liquidity, other venues, and orders submitted after your snapshot remain outside what that snapshot reveals.
Example: why depth changes an execution estimate
Assume a stock has a $50.00 best bid and the following displayed asks. For illustration, all quantities remain available and accessible while a 400-share market buy executes:
| Ask price | Displayed shares | Illustrative purchase cost |
|---|---|---|
| $50.02 | 100 | $5,002 |
| $50.04 | 200 | $10,008 |
| $50.08 | 100 | $5,008 |
| Combined | 400 | $20,018 |
The weighted average execution price is $20,018 ÷ 400 = $50.045. That is $10 more than purchasing all 400 shares at the initial $50.02 ask, before fees. Level 1 alone would not describe those deeper prices.
This is arithmetic under fixed assumptions, not a fill forecast. Quotes may cancel, other orders may consume the size, or additional liquidity may appear. Routing, latency, and venue rules affect the result.
A buy limit of $50.04 restricts the acceptable purchase price. In this example, only 300 shares are displayed at or below that price; the remaining 100 might stay unfilled. Even the 300 are not guaranteed. Investor.gov’s order guide explains the distinction between a market order’s execution objective and a limit order’s price constraint.
Read changing depth without assuming intent
| Observation | Useful question | Conclusion to avoid |
|---|---|---|
| Large bid or ask “wall” | Does the quantity persist as trading reaches that price? | The level must hold or reverse price |
| Resting bids repeatedly execute | Are aggressive sellers being absorbed, and how does price respond? | Bid executions automatically mean aggressive buying |
| Displayed quantity disappears | Was it executed, canceled, replaced, or affected by the feed’s update format? | Removal alone proves a directional intention or spoofing |
| Thin depth during a breakout | How does available size compare with the intended order? | The breakout is confirmed or execution will be easy |
Depth can help frame possible support, resistance, and execution risk, but displayed interest is conditional and can change. Combine observations with completed trades, price response, and the relevant session. The open, close, earnings releases, and major news may make depth especially informative—and especially unstable.
Use LuxAlgo footprints for executed-volume context
On LuxAlgo’s native charts, footprints show volume traded at prices inside a bar, separated by aggressor side. They help examine where activity occurred and how price responded.
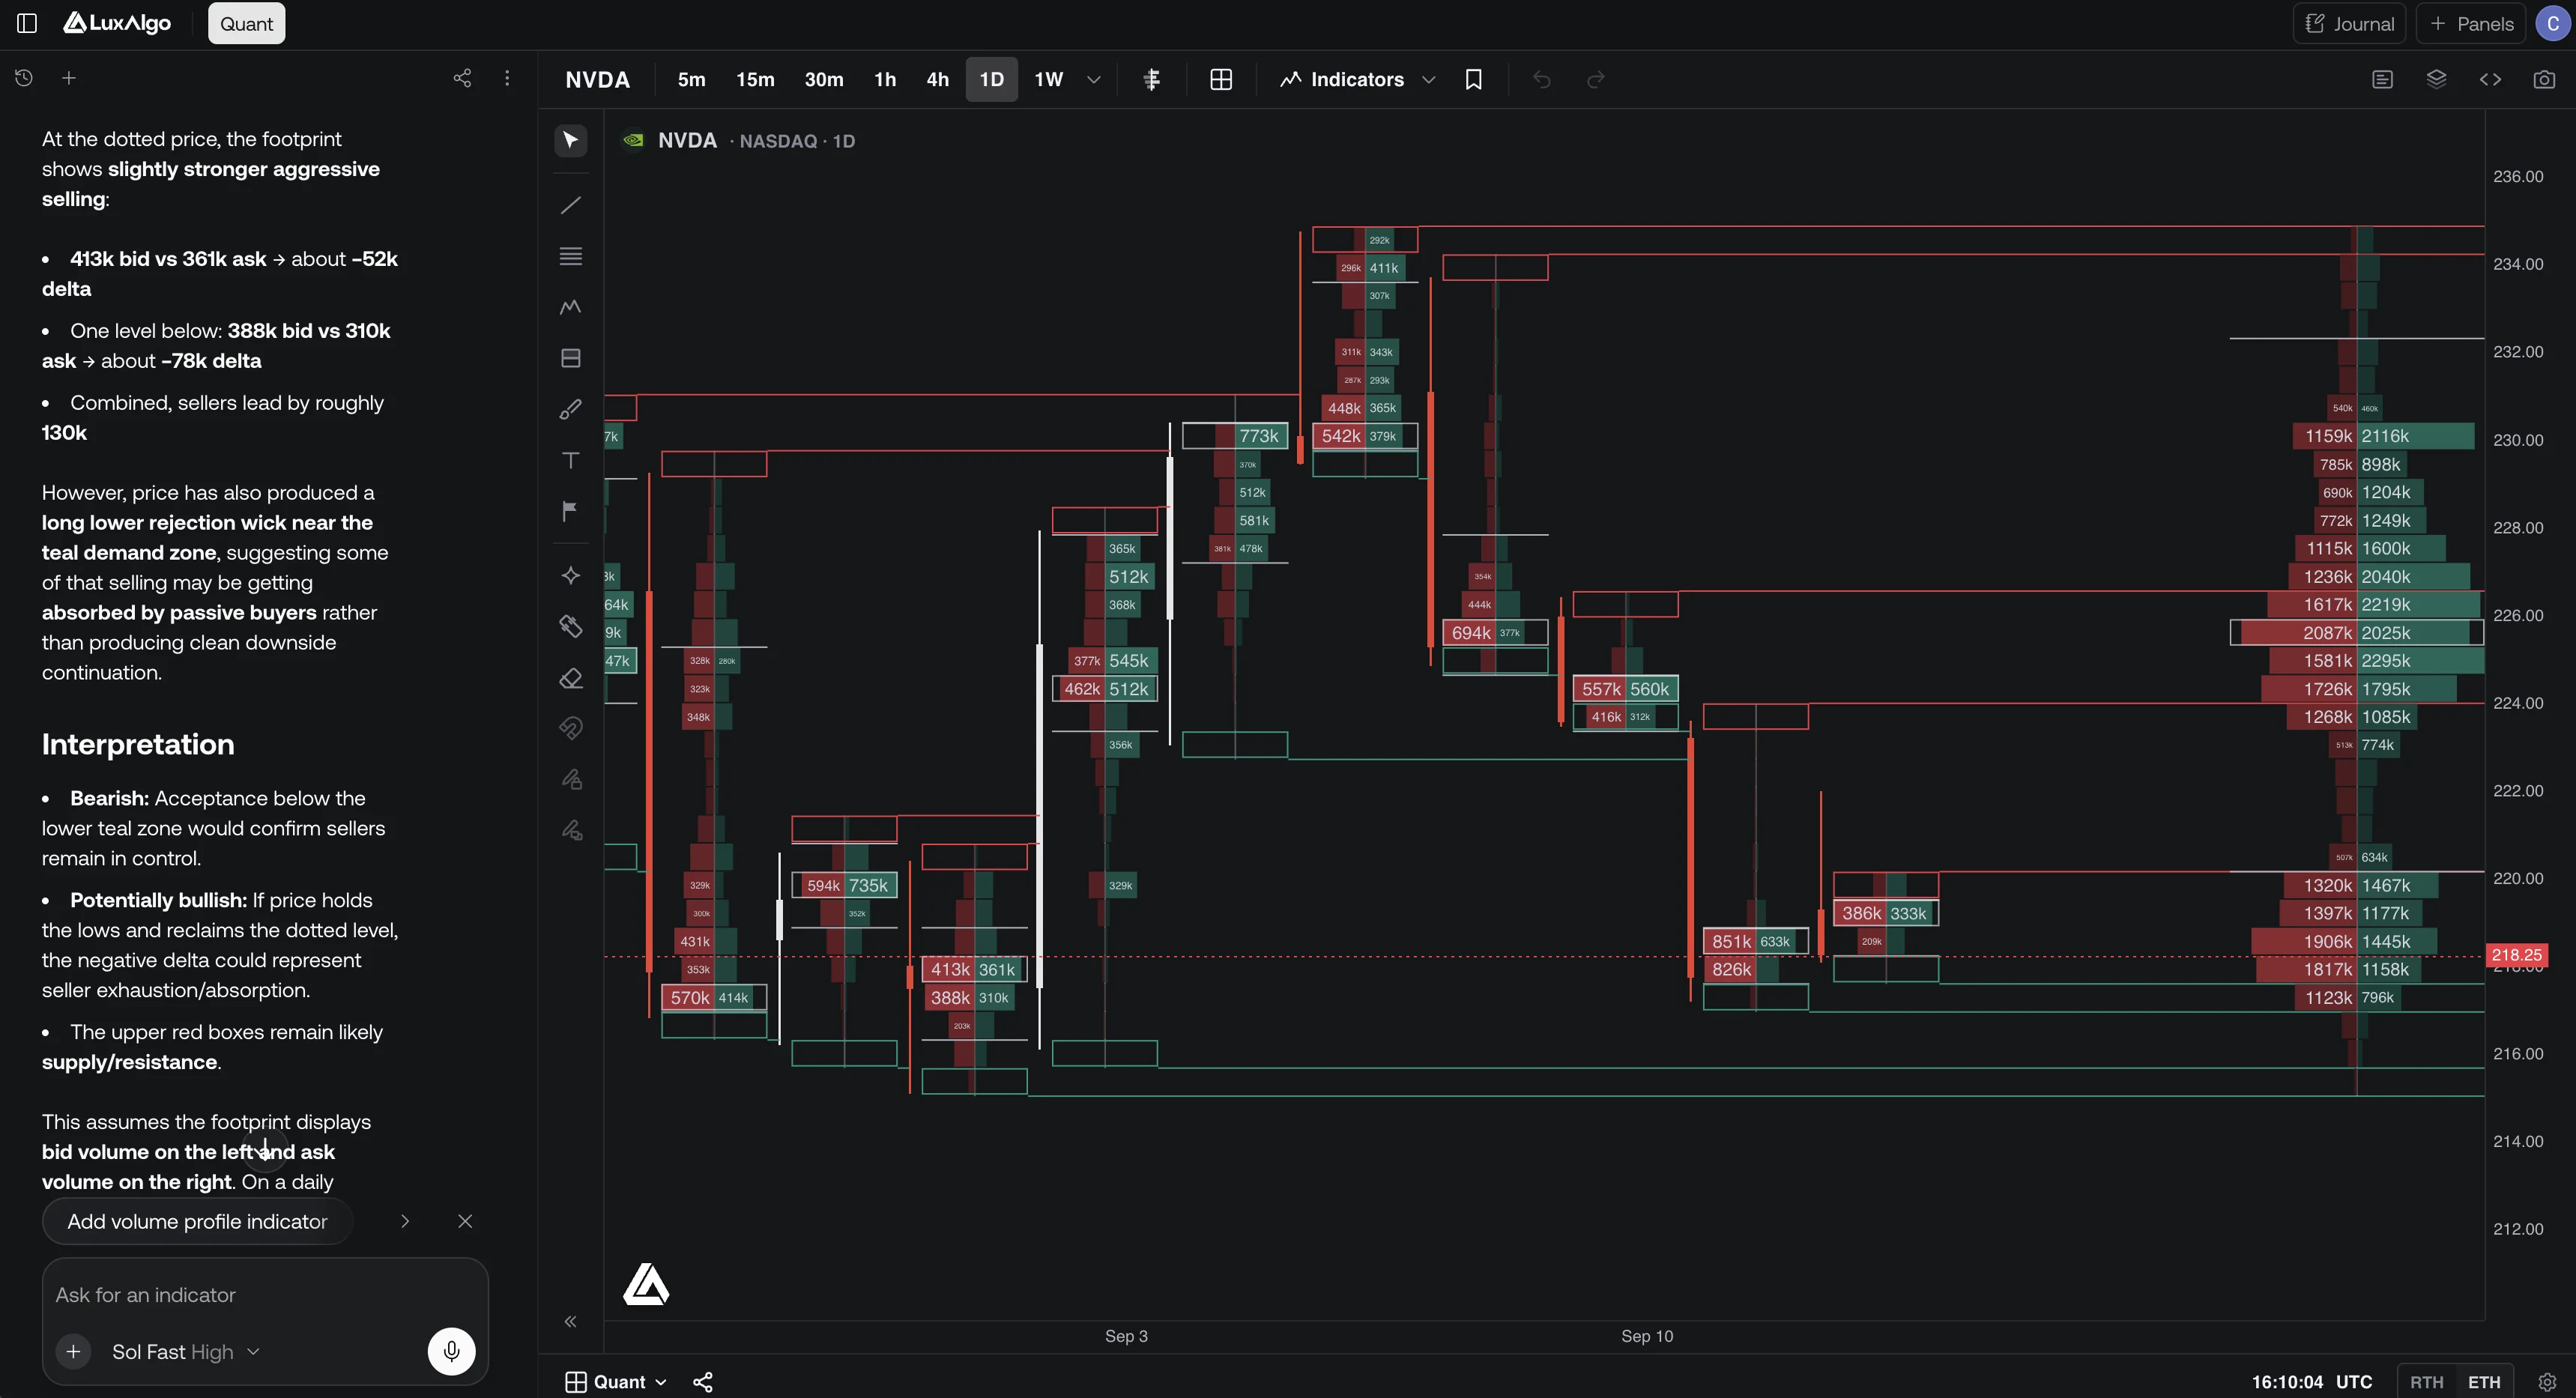
LuxAlgo’s market-data documentation specifies pre-aggregated, one-minute footprint slices. Supported crypto venues and Cboe EDGX U.S. equities provide this data; forex, commodities, and CME futures currently provide candles only. EDGX activity is not the entire U.S. equity market.
The native order-flow tools do not provide a live order book or trade tape. Do not interpret them as DOM playback or a reconstruction of individual cancellations and queue events. Likewise, a chart indicator estimating liquidity from candles is not an exchange depth feed.
Research explicit chart rules with Quant
Use Quant to turn a defined chart idea into a strategy with explicit entries, exits, and risk settings. Specify the symbol, session, timeframe, and data the rule requires. Review the generated implementation and its backtest settings and trade log.
A candle-based test cannot reconstruct historical Level 2 queues or order cancellations from OHLC bars. If a hypothesis depends on those events, it needs suitable historical depth data and an execution model. For chart strategies, include realistic cost assumptions and evaluate a separate period before drawing conclusions.
Video: seeing Level 1 and Level 2 together
This InformedTrades lesson illustrates quote and depth windows on an older trading interface. Use it to visualize the distinction; confirm current feed coverage and platform behavior with your provider. The displayed orders are observations, not reliable standalone predictions.
Choose the feed around the trading decision
Before paying for additional data, confirm the venues, instruments, displayed levels, MBP or MBO format, delay, timestamps, and historical availability. Check subscription costs and professional-user classifications with the provider. A free feed is not necessarily delayed, and a paid feed is not necessarily comprehensive.
Choose Level 1 when the top quote addresses the task. Add depth when displayed liquidity and execution conditions matter to the process. Use charts and executed-volume analysis for context, and keep order placement and risk controls tied to the execution platform’s actual capabilities.
Read next