Long Trading: Capitalize on Upward Trends
A long trade seeks to benefit from a rise in the value of the position. For a straightforward share purchase, profit comes from selling above the purchase price, after costs, with any eligible dividends contributing to the overall result. “Long” describes direction, not duration: a long trade can last minutes, months or years.
Use native LuxAlgo charts to define the trend, entry and exit you want to study. Then use Quant, our coding agent, to help implement explicit rules on supported data, inspect the generated code and run it manually. An upward-looking chart is a starting point for research, not a guarantee that the next trade will make money.
Understand what you are buying
Buying fully paid shares in a cash account gives you ownership in a company. Those shares can lose their entire value, but the price loss on that fully paid holding is limited to the amount invested. That statement does not extend to every position described as long: borrowing on margin or using a leveraged derivative changes the obligations and potential losses.
FINRA distinguishes cash and margin accounts: a cash purchase is paid in full, while a margin account can fund part of a securities purchase with borrowing. Margin losses can exceed the funds deposited. A long derivative position also need not provide ownership or dividends; read the instrument’s terms rather than assuming it behaves like a cash share purchase.
| Aspect | Fully paid long shares | Conventional short sale of shares |
|---|---|---|
| Price objective | Benefit from a rise above the purchase price. | Benefit from buying back below the sale price. |
| Position mechanics | Own shares purchased with available cash. | Borrow shares, sell them and later buy shares to return. |
| Price-loss exposure | The shares can become worthless. | A rising share price can create theoretically unlimited losses. |
| Costs and constraints | Spreads, applicable commissions, account fees and taxes can matter. | Borrowing costs, collateral requirements and stock-loan availability can also matter. |
| Distributions | Eligible holders may receive declared dividends; they are not guaranteed. | The short seller may owe payments associated with distributions on borrowed shares. |
This comparison describes share positions, not every option, futures contract or leveraged product. Also distinguish a position’s market value from the amount you plan to risk at a stop. A $5,000 position does not mean a $5,000 planned stop loss, and a stop does not guarantee that the actual loss stays within the plan.
FINRA’s stock overview explains ownership, dividends and capital gains alongside stock-price volatility. An individual company can decline even during a rising market. Avoid treating a broad index’s historical average as the expected return for a selected stock or a short holding period. Tax treatment depends on the jurisdiction, account and transaction; going long does not automatically create a lower tax rate.
Identify an upward trend without assuming it will continue
Price structure and moving averages
A sequence of higher swing highs and higher swing lows is one way to describe an uptrend. A rising moving average with price above it provides a different, lagging description. Define the lookback and decision timeframe before testing either idea; they need not agree at every moment.
A simple moving average gives equal weight to observations within its window. An exponential moving average gives greater weight to recent observations. A faster response can also create more frequent changes during choppy conditions. There is no universal rule that one average is best for all short trades or all long holding periods.
The term golden cross commonly refers to a 50-period average crossing above a 200-period average, often on daily charts. A 9/21 crossover is another possible rule, not the same test. Multiple lengths on one chart are also different from using multiple chart timeframes. Specify the price input, averaging method, lengths and bar timing instead of relying on a label.
For a drawn trendline, identify the lows used and when each became observable. Two points define a candidate line; a later touch can test it. A pivot that needs bars to its right is confirmed only after those bars exist. Backdating a trade to the pivot’s visual location would use information unavailable at that time.
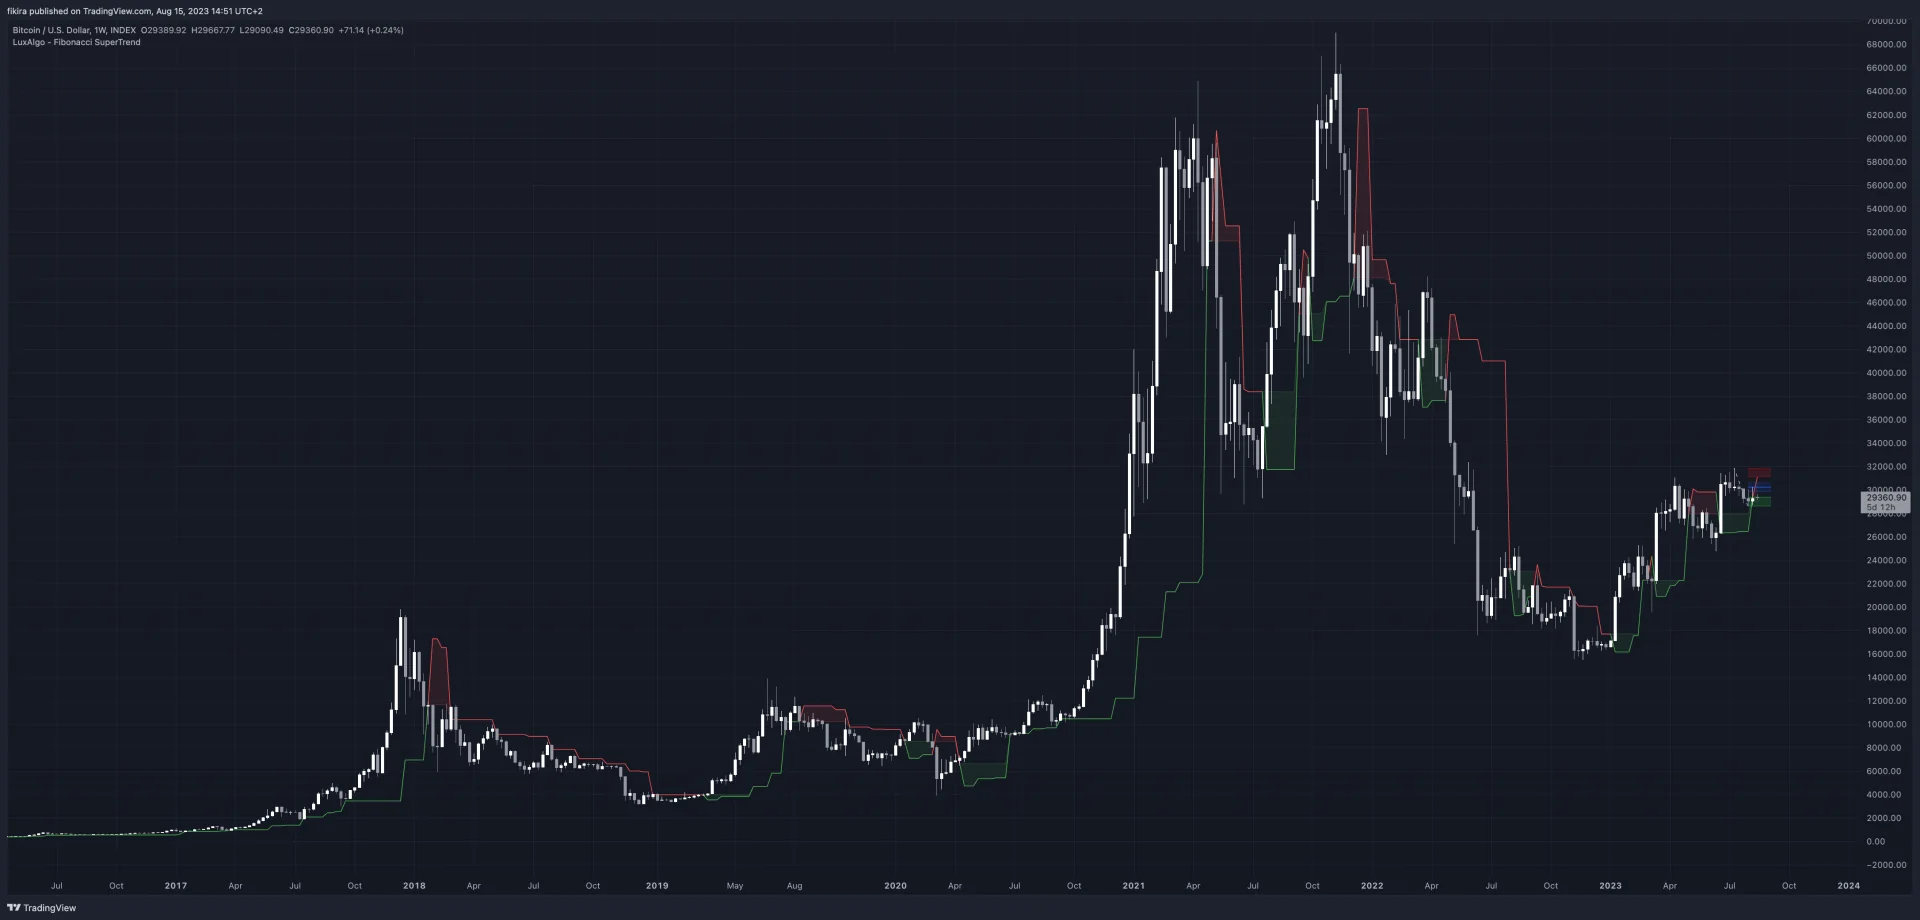
Momentum indicators answer specific questions
- RSI: a low reading describes recent weakness under its calculation. A reading below 30 is not automatically a strong buy; it can persist during a decline. Define the trend context and a separate trigger.
- MACD: the usual line is the 12-period EMA minus the 26-period EMA, with a 9-period EMA of that line as the signal line. A bullish crossover is a measurable event, not proof of a profitable entry.
- ADX: measures trend strength rather than bullish direction. A threshold such as 25 cannot, on its own, tell you to buy.
- Agreement: price, moving averages and momentum measures can repeat related information. Adding several conditions may reduce the number of signals without improving their outcomes.
Compare volume on a consistent basis
Volume can help describe participation around an advance or breakout. State the comparison—for example, completed-bar volume versus a defined prior average—instead of calling volume “strong” after observing a winning trade. An unfinished session should not be casually compared with full prior sessions.
Confirm what the feed measures. Exchange-specific volume is not consolidated activity across all venues, and tick volume is not necessarily traded share or contract volume. Rising price with rising volume can be useful context, but it does not identify buyer intentions or eliminate the possibility of a false breakout.
Choose an entry method with explicit rules
| Approach | A rule to define before testing | Main failure mode |
|---|---|---|
| Breakout | A completed close above a predefined level, with a stated execution time and any volume filter. | Price can return below the level; the next available fill can differ from the signal close. |
| Pullback | An established trend, a specified retracement area and a measurable resumption trigger. | A retracement can become a trend reversal rather than a buying opportunity. |
| Breakout retest | A prior breakout followed by a return to the former level and a defined response. | The retest may fail or may never occur, leaving no entry. |
| Moving-average condition | A crossover or price interaction using fixed lengths and completed-bar rules. | Lag and repeated whipsaws can erode results in sideways markets. |
A pullback may allow a smaller entry-to-stop distance in a particular setup, but it is not inherently lower risk than a breakout. Position size, gap exposure, market conditions and the probability of failure all matter. Do not buy merely because price touches an average or because several indicators happen to share the same color.
A practical rule might require an upward trend on a completed daily bar, then a separately defined entry on a lower timeframe. Use the latest completed higher-timeframe value available at each historical decision. The final daily close cannot be used to justify an earlier intraday trade.
Plan the stop, target and position size together
Separate a stop rule from a risk budget
A stop can be based on a price structure, a volatility measure or a fixed distance. Each is a rule to evaluate, not a universal prescription. A 2× ATR distance is an example parameter, and a wider percentage stop does not automatically make someone an appropriate “risk-taker.” Change position size when the distance changes so that the planned price risk remains explicit.
For a hypothetical entry at $64 and planned stop at $61, the price risk is $3 per share. If a $200 budget reserves $20 for estimated costs, $180 remains for price risk: $180 ÷ $3 = 60 shares. The position value is $3,840. Check available capital, trade increments and any financing terms before treating that quantity as executable.
A target at $70 offers $360 gross profit, twice the planned $180 price risk. But a gap followed by a fill at $58 would lose $360 before costs. A stop-market order prioritizes execution after triggering but not the requested price; a stop-limit order can remain unfilled. The chosen order type changes the risk, and estimated costs may be exceeded.
Reward-to-risk targets do not guarantee positive expectancy. Under an idealized +2R win and −1R loss model, break-even is one-third wins before costs. If the realized losses are larger because of gaps or the average wins are smaller because of early exits, that simple threshold no longer describes the strategy.
Let the exit rule match the strategy
A fixed target defines a planned exit price, while a time exit limits the holding period and a trailing rule changes an exit reference as the trade develops. The target may never trade, and a displayed chart level is not itself an order at a broker. Define how competing exit conditions are handled.
Large drawdowns make recovery difficult: a hypothetical fall from $100 to $5 is a 95% loss, and returning from $5 to $100 requires a 1,900% gain. This is arithmetic, not a reason to assume a stop can prevent every large loss. Portfolio concentration, leverage and correlated overnight positions also need limits.
Use trailing stops with clear timing
For a long trade, a ratcheting trailing rule raises or holds its level while the trade remains active. If you recalculate a volatility-based distance, explicitly prevent it from widening the permitted loss when volatility rises. A moving-average exit and an actual broker trailing-stop order are different mechanisms; specify which one is being tested.
There is no requirement to take a partial profit before using a trailing rule. Choose its activation and update conditions in advance. Starting it immediately, after a price move or after a partial exit produces different trade outcomes and should be compared under consistent assumptions.
Example: Fibonacci Trailing Stop
The Fibonacci Trailing Stop derives levels from swing highs and lows. Its L/R inputs define pivot lookbacks, the selected Fibonacci level determines the stop reference, and Trigger chooses whether a close or wick counts as a breach. Within an established bullish state, its trailing line rises or holds; a breach can change the indicator’s state.
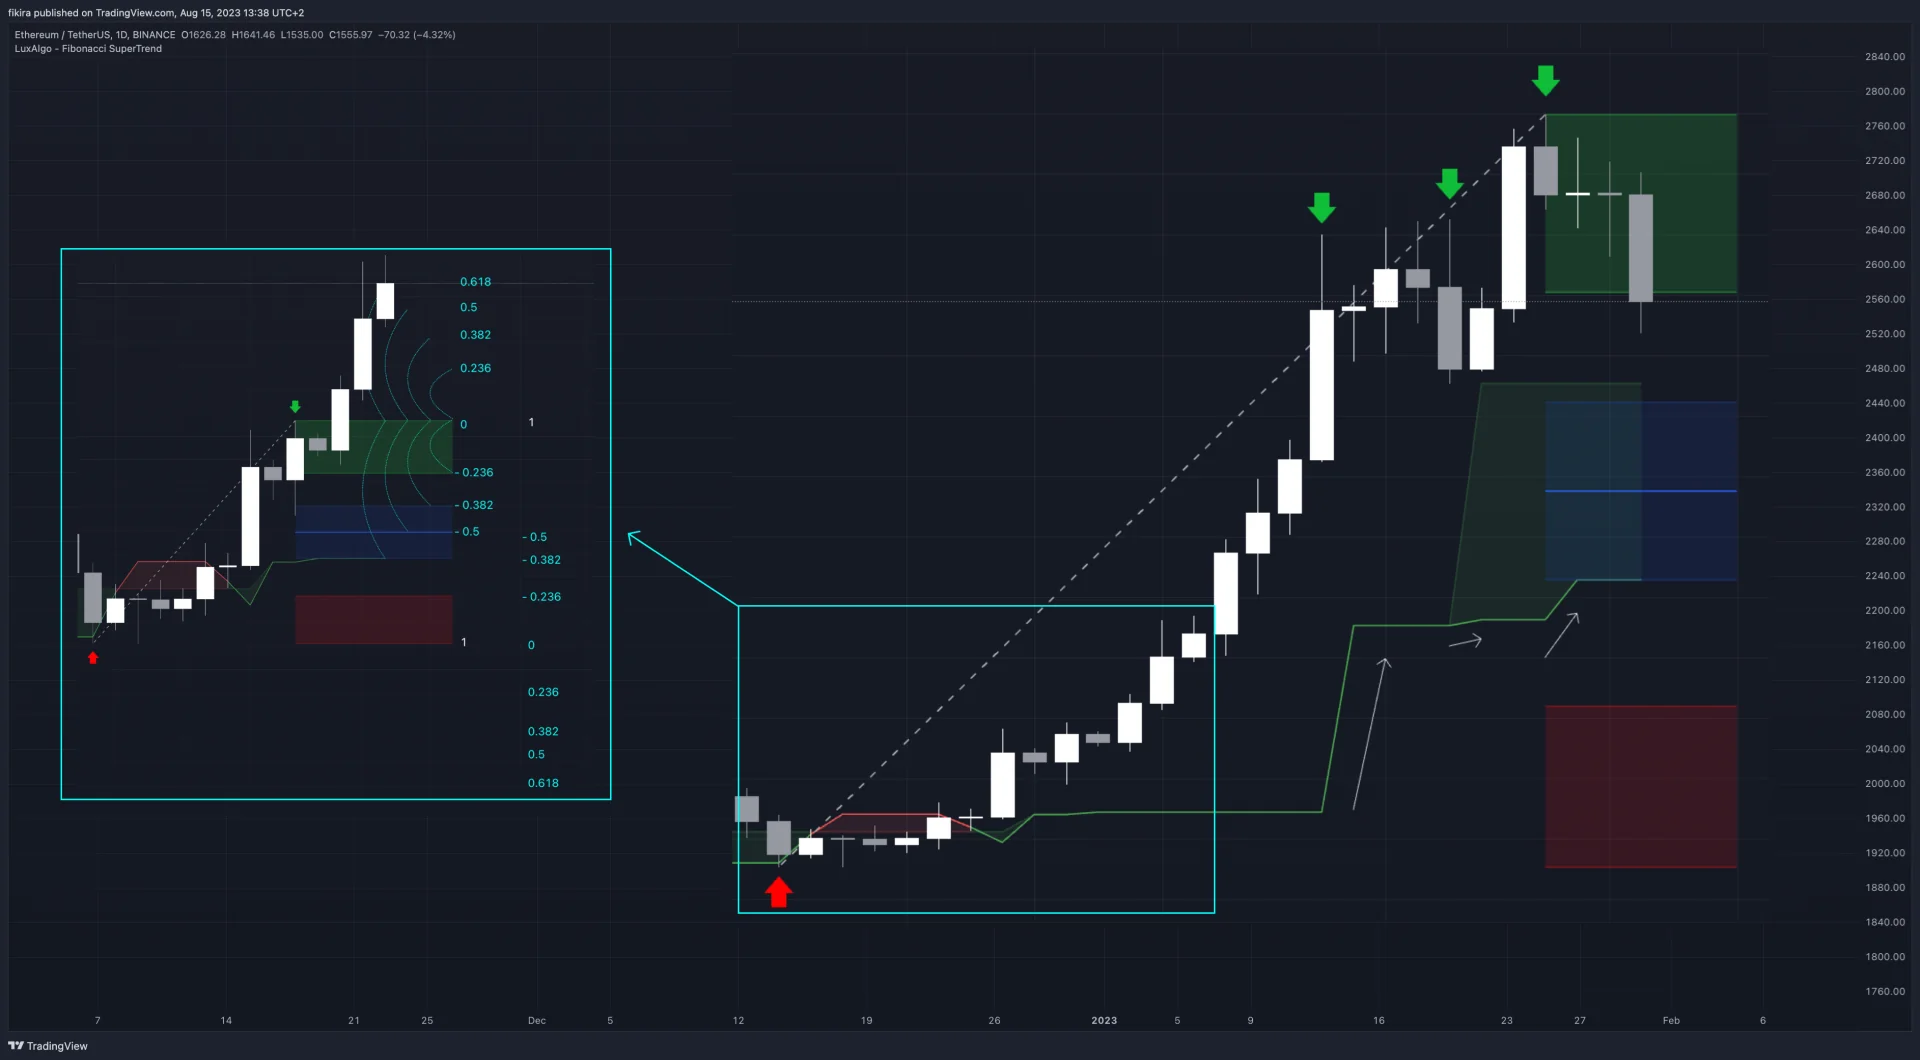
Check when pivots are confirmed before translating the display into entries or exits. The publication also describes a secondary line from smaller swings and optional historical Fibonacci shadows with a one-bar delay. These display features do not guarantee that an apparent support area will hold.
Partial exits change the payoff
Scaling out means closing part of a position and retaining the rest. In the hypothetical 60-share trade above, selling 30 shares at $67 earns $90 gross. If the remaining 30 exit at $70, they earn $180, giving $270 gross in total—1.5 times the original $180 price-risk budget, rather than the $360 earned by exiting all 60 at $70. More orders can also add costs.
A partial-exit schedule and a variable trailing take-profit setting are not interchangeable descriptions. If you use a particular platform feature, verify exactly how it sizes orders and updates levels. Avoid claiming a specific scaling behavior solely from a feature’s name.
Combine technical context with asset research
For shares, financial statements, earnings expectations, valuation and company events can help define the research universe and risks. For other markets, the relevant information differs. Fundamentals can provide context, but favorable fundamentals do not guarantee that a short-term technical entry will work.
A multi-timeframe process can organize decisions: use a higher timeframe for context, a chosen trading timeframe for the setup and a lower one only if the strategy calls for a more precise trigger. More timeframes are not automatically better. Keep the plan simple enough to reproduce and compatible with the times you can monitor it.
Record earnings dates or other relevant events before opening an overnight position. Decide whether the strategy excludes those windows, accepts the risk or adjusts exposure. Test that rule consistently rather than removing losing event trades after the fact.
Build and review a native LuxAlgo strategy
- Write the rules in plain language: market, timeframe, trend condition, setup, entry timing, position size, stop, target and any partial or trailing exit.
- Open the supported symbol and data on native LuxAlgo charts. Record the venue, session and available history.
- Ask Quant, our coding agent, to implement the stated rule set. Include the requirement to use only information available at each decision.
- Inspect the generated code, especially pivot timing, higher-timeframe values and exit updates. A visually convincing overlay does not establish a causal strategy.
- Run the strategy manually. Review the native strategy inputs and properties, including capital, order quantity and applicable commission or slippage assumptions.
- Inspect individual trades and evaluate a later period that was not used to select the rules. Compare with a suitable baseline using the same data and cost assumptions.
Do not assume a chart signal places a live broker order or that generating a Quant strategy means it has already been run.
Keep a journal of the planned rule, actual fill, exit reason and any deviation. Review losing periods as well as attractive examples. When you change a parameter after seeing results, document it as another research attempt rather than treating the revised outcome as an untouched evaluation.
Video: using moving averages
This recorded tutorial illustrates moving averages in pullback, trend and reversal contexts. Treat the examples as explanations of the tools, alongside the timing and risk checks above. They do not validate a particular long-trading strategy or replace testing on your chosen market.
Frequently asked questions
Does going long mean holding for years?
No. Long describes the direction of the position. A long trade can be intraday or held for a much longer period.
Can a long position lose more than the initial deposit?
A fully paid cash share holding can lose its entire purchase value. Margin borrowing and leveraged products have different obligations and can create losses beyond deposited funds.
Is RSI below 30 an automatic buy signal?
No. It describes weakness under the indicator’s calculation and can persist in a decline. Define the broader context and a separate entry rule.
Does a 2:1 target guarantee a profitable strategy?
No. Results depend on actual win frequency, gain and loss sizes, costs and execution. A planned target is not the same as the average realized payoff.
How do I size a long share trade?
Divide the price-risk budget by the entry-to-stop distance, then account for costs, capital constraints and trade increments. Gaps can make the actual loss larger than planned.
How should I test a trailing-stop rule with Quant?
Specify its activation, update and breach conditions. Inspect the code for delayed pivot confirmation and other timing issues, then run it manually and review trades, costs and unseen periods.
References
- FINRA — Stocks; share ownership, dividends, capital gains and price risk.
- FINRA — Brokerage Accounts; cash versus margin purchases, fees and losses beyond deposited funds.
- LuxAlgo — Fibonacci Trailing Stop; current indicator inputs and behavior.
- LuxAlgo — Native Charts; chart research workspace.
- LuxAlgo — Making Strategies and Native Strategy Settings; code review, manual runs and testing assumptions.
- Use Moving Averages Like A Pro — video; recorded moving-average examples.
The numerical trade, partial-exit and drawdown examples are hypothetical calculations. Indicator illustrations and documentation do not establish historical strategy returns or future profitability.
Read next