MACD Divergence Screening on TradingView
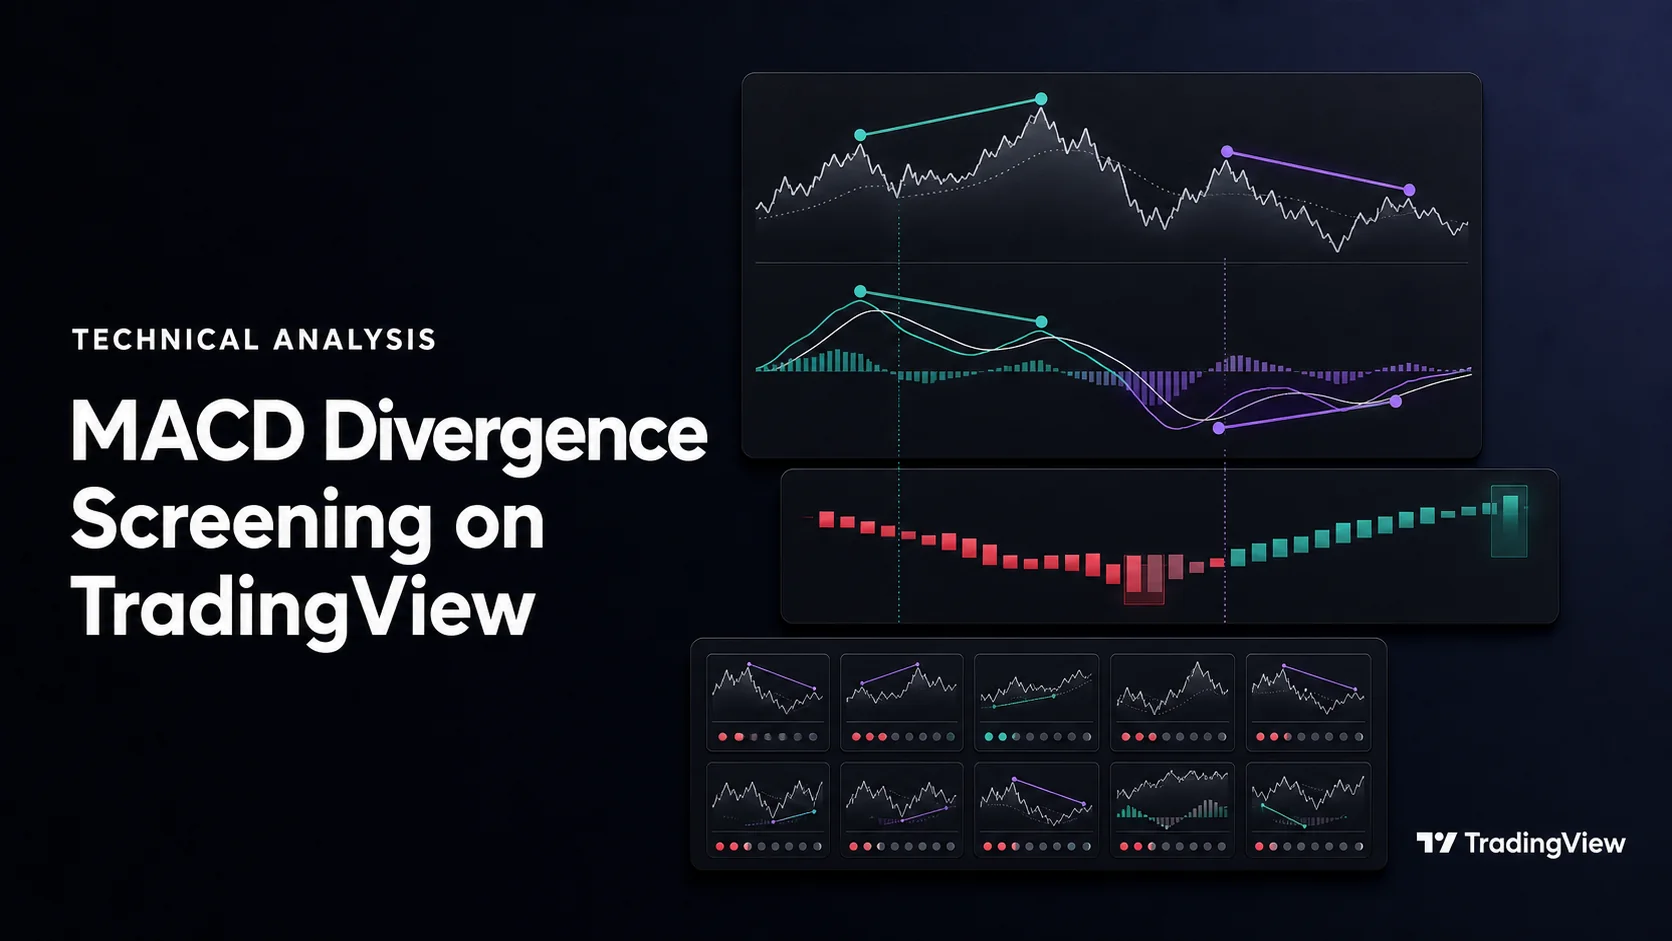
MACD divergence screening looks for disagreement between price swings and a defined MACD series. It produces candidates to review, not automatic reversal trades. A bullish divergence can persist while price keeps falling, and a bearish divergence can appear well before an uptrend ends.
Start by defining the pattern on a chart. Then use an appropriate screening tool to find the same condition across symbols. In native LuxAlgo charts, you can inspect momentum and develop explicit strategy rules with Quant, our coding agent. On TradingView, distinguish ordinary technical filters from a compatible custom Pine indicator that actually calculates divergence.
Set Up and Understand MACD
On TradingView, open Indicators, search for Moving Average Convergence Divergence, and select the built-in study. Put the oscillator below the price chart so corresponding bars line up. Open its settings to inspect lengths, source and averaging methods rather than assuming every community MACD variant uses the same formula.
| Component | Common calculation | Interpretation |
|---|---|---|
| MACD line | 12-period EMA of close minus 26-period EMA of close | Difference between faster and slower averages, expressed in price units. |
| Signal line | 9-period average of the MACD line | A smoother comparison series; verify the selected averaging method. |
| Histogram | MACD line minus signal line | Distance between the two lines, not the MACD line itself. |
| Zero line | Reference value of zero | MACD above zero means the selected fast average exceeds the slow average. |
For example, a fast average of 102 and a slow average of 100 give MACD = 2. With a signal value of 1.5, the histogram is 0.5. MACD = −2 with signal = −3 also gives a positive histogram of 1, even though MACD remains below zero. A histogram crossing zero is therefore different from MACD crossing zero.
The familiar 12, 26 and 9 inputs are starting values, not universally optimal settings. A shorter alternative such as 8, 17 and 9 responds differently and can produce more frequent changes. Longer settings smooth more but can delay a signal; neither choice guarantees fewer losing trades. Save the source, timeframe and smoothing choices with every test.
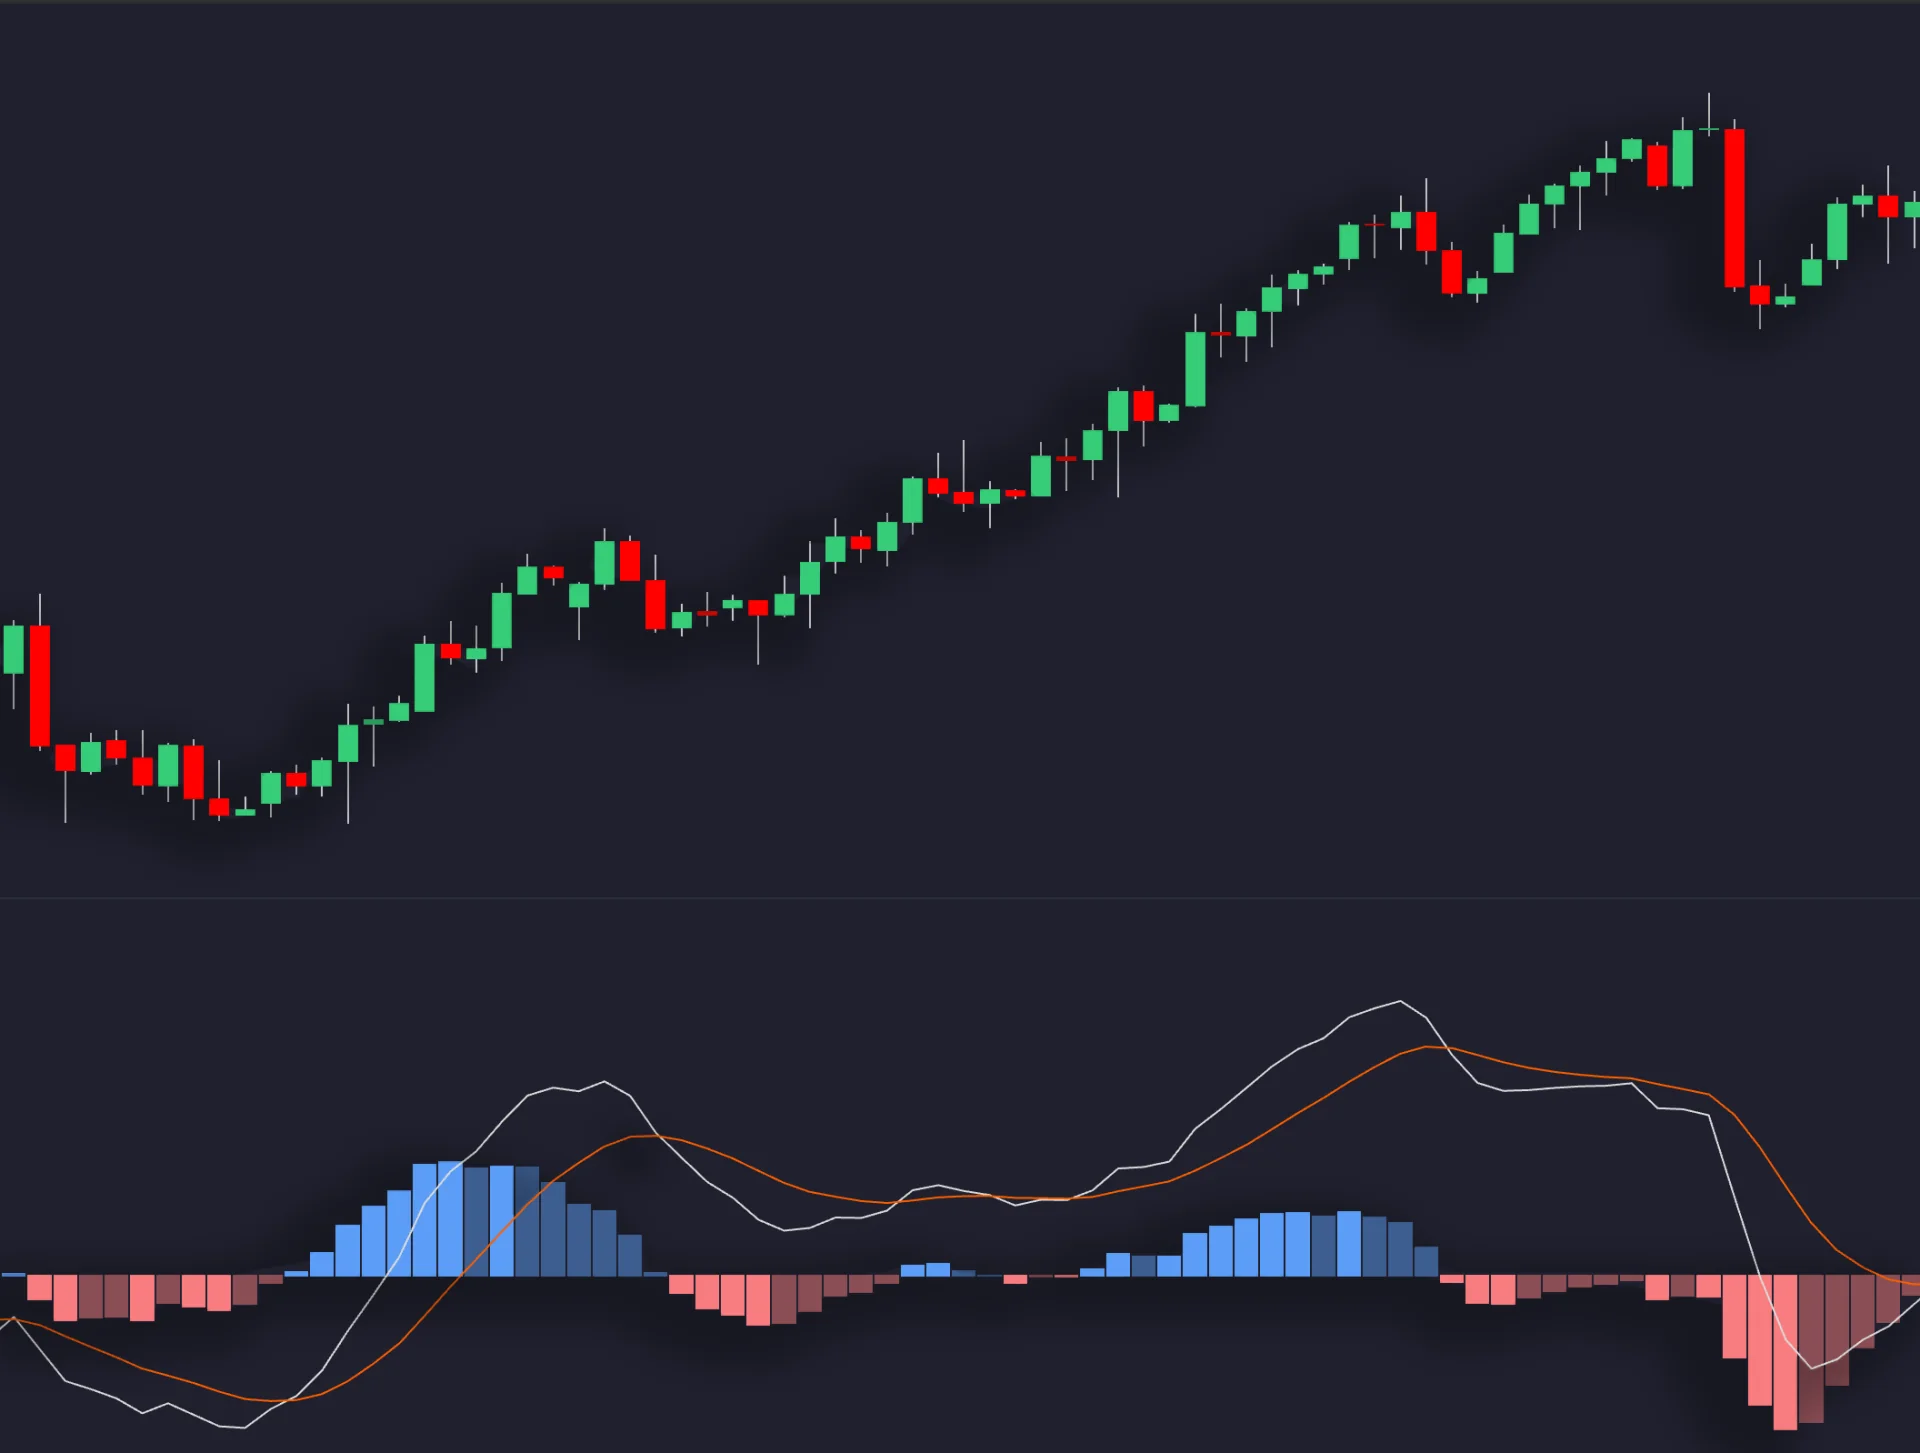
Use contrasting line colors and a readable histogram. Align the price and oscillator panels by time, and compare numerical values when the shape is ambiguous. Resizing an oscillator panel changes its visual slope without changing the underlying observations.
Define Bullish and Bearish Divergence Precisely
| Pattern | Price relationship | Oscillator relationship | What it suggests |
|---|---|---|---|
| Regular bullish | Second selected low is lower | Corresponding MACD value is higher | Downward momentum may be weakening; a recovery is not assured. |
| Regular bearish | Second selected high is higher | Corresponding MACD value is lower | Upward momentum may be weakening; price can continue higher. |
| Hidden bullish | Second selected low is higher | Corresponding oscillator value is lower | A separate continuation hypothesis, not the regular bullish pattern. |
| Hidden bearish | Second selected high is lower | Corresponding oscillator value is higher | A separate continuation hypothesis, requiring its own rules. |
Choose whether the detector compares the MACD line or histogram. Those series can disagree. Also choose how points are paired: sample MACD at confirmed price-pivot bars, or match independently detected oscillator pivots within a specified time window. These are different algorithms. Do not silently switch between them to make a chart look convincing.
Worked Paired-Pivot Examples
Under a price-pivot sampling rule, suppose two lows are 100 and 96, with MACD values −3 and −2 on those same bars. Price makes a lower low while MACD makes a higher low: regular bullish divergence. The 4% price decline and one-unit oscillator increase describe that example; they do not establish a probability of reversal.
For a bearish example, price highs of 110 and 114 paired with MACD values 3 and 2 satisfy the opposite relationship. If the histogram instead rises between those bars, it does not invalidate the stated MACD-line comparison, but it shows why the selected series must be explicit.
Define which two pivots qualify, their minimum and maximum separation, how tied prices are treated, and whether an intervening swing cancels the setup. A drawing connecting two convenient endpoints is not yet a reproducible screening rule.
Record When the Pattern Becomes Knowable
A pivot detector requiring five bars to the right cannot identify a pivot on bar 100 until bar 105 has completed. Drawing a marker back on bar 100 does not make it available there in real time. TradingView’s repainting documentation explains this distinction and how unfinished-bar values can change.
Record both the pivot timestamp and detection timestamp. If a trade also requires a later price break, record that separately. A test that buys at the earlier pivot low using information learned afterward benefits from unavailable information. Use completed values and an achievable subsequent fill for the specified rule.
Choose the Right TradingView Screening Workflow
Ordinary asset screeners can narrow a universe using available technical, liquidity and market filters. A MACD value, signal crossover or histogram condition is not automatically a comparison of two price pivots with two oscillator values. Do not assume an arbitrary divergence rule can be configured merely by adding a MACD filter.
For a custom detector, use TradingView’s Pine Screener requirements to check compatibility. The script must implement the comparison and expose a supported plot or alert condition; drawings alone do not provide a usable screening filter. Availability of a particular community or protected indicator must be checked individually.
- Select a watchlist or index as the source, then choose a compatible indicator from your favorites.
- Set the detector’s MACD inputs, pivot rule and supported timeframe. Put any required volume or trend logic into that same indicator where necessary.
- Filter its documented output, such as a bullish-candidate flag or candidate age. Do not treat an undocumented numerical plot as a signal.
- Run the scan, open matching charts and verify the two points and the time they became identifiable. Rescan after changing the source, inputs, timeframe or filters.
A flag that is true only on the detection bar and a flag that stays true for several bars produce different lists. Define expiration, whether a new opposite event clears it, and whether only completed bars count. A candidate found three bars later may no longer offer the entry originally studied.
Pine Screener uses one indicator per screen and calculates on the last 500 bars. Its supported timeframes, request calls and input types have limits; some unsupported inputs use script defaults. It does not run strategies or indicator-on-indicator setups. Verify the current requirements before transferring a chart script, and compare scan results with matching chart data. A scan is neither a historical strategy test nor an order.
Official Pine Screener Walkthrough
TradingView’s tutorial demonstrates the screening workflow. It was introduced during the earlier beta presentation, so use the current documentation above for present capabilities and limits. The video explains the tool, not a validated MACD divergence strategy.
Use Filters as Testable Choices
A daily setup and a four-hour setup are different studies. Neither is automatically suitable for every swing or day trader. If you use a higher-timeframe trend condition, specify when that bar closes and how its value becomes available on the lower-timeframe chart.
A fixed MACD difference of 0.1 has different meaning on instruments priced at 10 and 1,000 because MACD is measured in price units. A minimum 2% price move or 14-bar window is also a parameter choice, not a universal threshold. If you normalize the oscillator by price or volatility, document the formula and evaluate the new rule independently.
Volume exceeding 1.5 times a 20-bar average is an example to test, not a required level of participation. State whether the average includes the current bar and whether the feed measures traded volume or tick activity. Compare like sessions and account for instruments whose volume data is incomplete.
Requiring a 50-period EMA above a 200-period EMA changes a bullish divergence study into a more specific trend-context rule. RSI and MACD both derive from price, so agreement is not independent proof. Additional moving averages or Bollinger Bands can answer trend or volatility questions, but no supported evidence here establishes a 20% reliability improvement from combining indicators.
Research the Strategy in Native LuxAlgo Charts
Open native LuxAlgo charts and use the Indicators picker to add MACD and any necessary comparison study. Inspect values in the Data window, keep symbol and timeframe consistent, and save a template for repeated reviews. Browse the LuxAlgo Library for a calculation that fits your question rather than assuming every study implements the same divergence logic.
Ask Quant, our coding agent to express the complete strategy. For example: “Compare MACD-line values at two confirmed price lows. Require the second price low to be lower and its MACD value higher. Expose pivot delays, separation, expiration, an entry trigger, exit rule, position size and trading costs. Record detection time separately from pivot time.” Inspect the generated code and run the strategy manually.
Inspect individual trades before judging aggregate returns. A strategy written for Quant Charts does not transfer directly into the Pine Screener, and an alert is a notification, not an executed order.
Turn a Candidate into Explicit Entry, Exit and Risk Rules
A possible long-side hypothesis waits for a confirmed bullish divergence, then a completed close above a specified intervening price high. Define how long that trigger remains valid and use the next eligible execution price. Other triggers, including a MACD signal-line cross, are different strategies; they need separate evaluation.
Set an actual-price stop using a written structural or volatility rule. A stop below a selected low and one placed a multiple of ATR from entry are not interchangeable. Define the ATR length, multiplier and update timing if you use it. No universal one- or two-ATR distance is appropriate for every instrument.
For an illustrative share trade, a $100 risk budget with $10 reserved for costs leaves $90 for price risk. Entry at 102 and a planned stop at 99 imply $3 per share, giving 30 shares and $3,060 of notional exposure. An exit after a gap at 97 loses $150 before costs. Planned risk is not a guaranteed maximum loss.
Partial profit-taking at one unit of initial risk, moving a stop to entry, and trailing the remainder each change the payoff distribution. Specify quantities, timing and costs and compare the full rule with a simpler exit. A stop at the entry price can still lose money after fees or slippage. Short positions also require appropriate borrow, margin and instrument-specific risk assumptions.
| Review item | What to verify | Why it matters |
|---|---|---|
| Signal timing | Pivots, detection and trigger are separate timestamps | Prevents using future bars for an earlier trade. |
| Execution | Actual eligible fill, fees, spread and slippage | A favorable chart point may not be tradable. |
| Sample | Same universe, dates and data for every variant | Avoids selecting only charts with obvious reversals. |
| Outcomes | Trade count, average gain/loss, net return, exposure and drawdown | Win rate alone can hide poor payoff or infrequent opportunity. |
| Validation | Later observations excluded from rule selection | Checks whether a chosen parameter set survives beyond its fitting sample. |
Keep losing candidates and expired setups in the research log. Compare a base strategy with one added filter at a time and retain the record of tested variants. Screening is useful when it makes a repeatable review manageable; it does not remove the need for timing, execution and risk controls.
Frequently Asked Questions
Is a MACD crossover the same as divergence?
No. A crossover compares two series at a point in time. Divergence compares selected price swings with corresponding oscillator observations. Specify whether you use the MACD line or histogram.
Can ordinary MACD screener filters find any divergence rule?
No. A value or crossover filter does not by itself compare paired pivots. A custom detector must calculate the intended relationship and expose an output supported by the screening tool.
Why can a divergence marker appear on an earlier bar?
Some indicators identify a pivot only after later bars complete, then draw the marker at that earlier pivot. Use the detection time when evaluating signals and trades.
Are 12, 26 and 9 the best MACD settings?
They are common starting inputs, not universally best settings. Keep source, smoothing and timeframe explicit, and evaluate alternatives with costs and a later sample.
Does adding RSI or volume guarantee better accuracy?
No. Additional conditions change the strategy and may remove useful trades as well as losing ones. Measure the complete result rather than assuming a fixed improvement.
How can LuxAlgo help test divergence rules?
Use native LuxAlgo charts to inspect price and momentum. Quant, our coding agent, can help express explicit rules; inspect generated code, run the strategy manually and verify individual trades. TradingView screening is a separate workflow.
Read next