Market Seasonality: Timing Your Trades
Market seasonality is the tendency for a measured market variable to behave differently across recurring calendar periods. That might mean returns by month, volume by hour or bar ranges by weekday. It is a research starting point: a historical average does not tell you what the next period will deliver or whether a tradable strategy survives costs.
Begin on native LuxAlgo charts with a clearly defined instrument, timeframe and hypothesis. The Seasonality Widget helps explore calendar groups. To turn a hypothesis into a supported strategy, use Quant, our coding agent, inspect the generated code and run it manually. Keep exploratory charts separate from evidence that an entry-and-exit rule works.
What seasonality can—and cannot—tell you
Calendar effects can be associated with recurring business activity, trading schedules, portfolio flows or commodity production and consumption. Those are possible explanations to investigate, not proof that a pattern will persist. Changes in market structure, participants or economic conditions can weaken a relationship that looked clear in an earlier sample.
| Calendar grouping | A research question | What to verify |
|---|---|---|
| Month or multi-month window | Does a predefined holding window differ from the rest of the year? | Exact entry and exit dates, price versus total-return data, cash returns and independent yearly observations. |
| Day of the week | Does a particular weekday have different returns or ranges? | Exchange session, holidays, timezone and whether returns include the overnight interval. |
| Hour of the day | When are price changes, ranges or volume different? | Session boundaries, daylight-saving changes, bar timeframe and whether data cover the full session. |
| Day of month or year | Does a recurring calendar window merit further study? | Sparse groups, missing dates, leap years and how many alternative windows were searched. |
Familiar ideas such as “sell in May,” a January effect or a year-end rally should be treated as hypotheses with explicit definitions. A November–April rule needs an exact first entry, last exit and treatment of non-trading days. Different definitions, markets and samples can produce different results, so an unattributed percentage is not a reliable trading input.
Calendar seasonality is also different from the business cycle. Expansion, slowdown and recession do not follow a fixed six-month schedule. A defensive sector is not necessarily negatively correlated with a cyclical sector, and rotating between them can still leave substantial market exposure.
Explore calendar groups with the Seasonality Widget
The widget supports Hour, Day of Week, Day of Month, Month and Day of Year groupings. Its documented inputs include a starting date, the variable to analyze, a summary statistic and optional exclusions. Record those settings with each chart so the result can be reproduced.
- Price change: the documented calculation uses the close minus the previous close; the percentage version divides that difference by the previous close. Grouping those observations by month is not automatically the same as measuring a full month’s compounded holding return.
- Price-change sign: positive and negative changes are summarized on a normalized scale. A reading above the midpoint describes the direction of the sampled changes; it is not the win probability of your trading strategy.
- Range: high minus low measures bar range. A larger average range says nothing by itself about which direction a trade should take.
- Volume: volume and volume relative to a moving average describe recorded trading activity. They do not directly measure the depth available at your execution price.
- Summary choice: mean, median, maximum, minimum and the average of the maximum and minimum answer different questions. The midpoint of the extremes is not a substitute for the median.
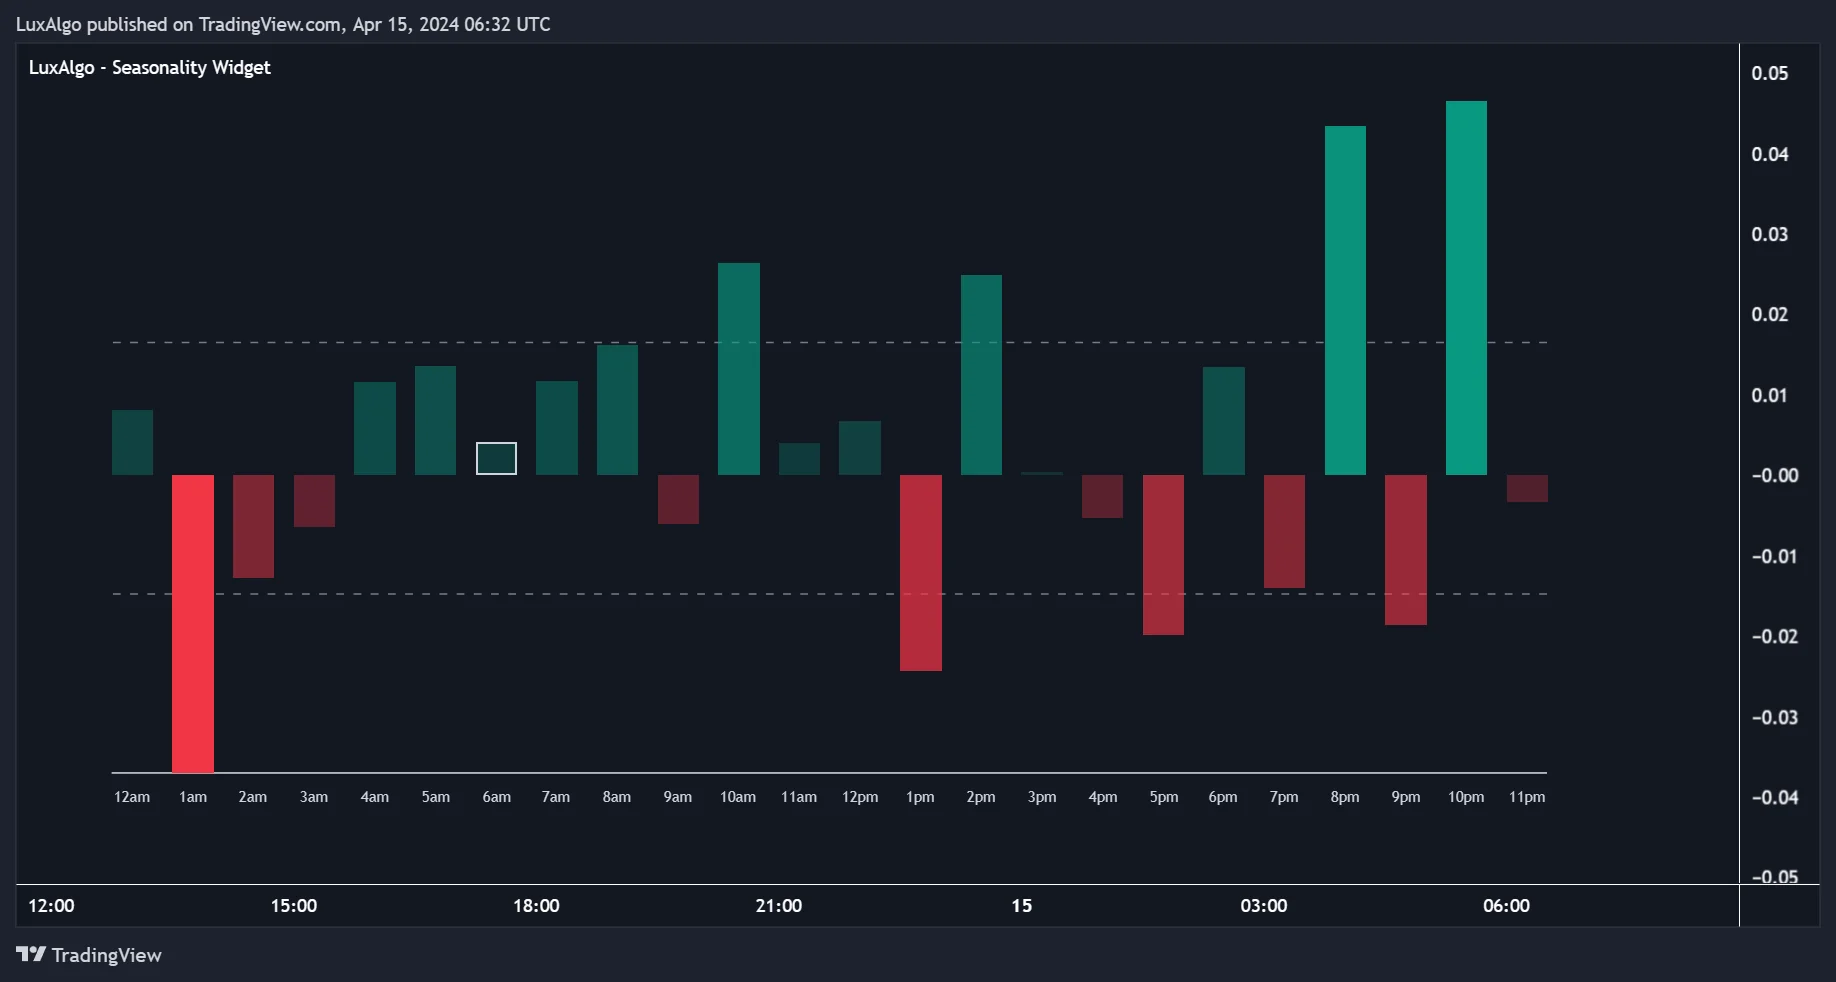
A monthly label on a histogram identifies a bucket. Before describing its bars as “monthly returns,” check what observations were put into the bucket and how they were aggregated. Averaging individual bar returns, summing them and compounding a calendar holding return are different operations.
Compare the mean with the median
The mean is sensitive to large observations; the median describes the middle of an ordered sample. For example, hypothetical returns of −2%, −1%, +1%, +2% and +20% have a mean of +4% but a median of +1%. Neither summary reveals the sequence of losses or the drawdown experienced while holding a position.
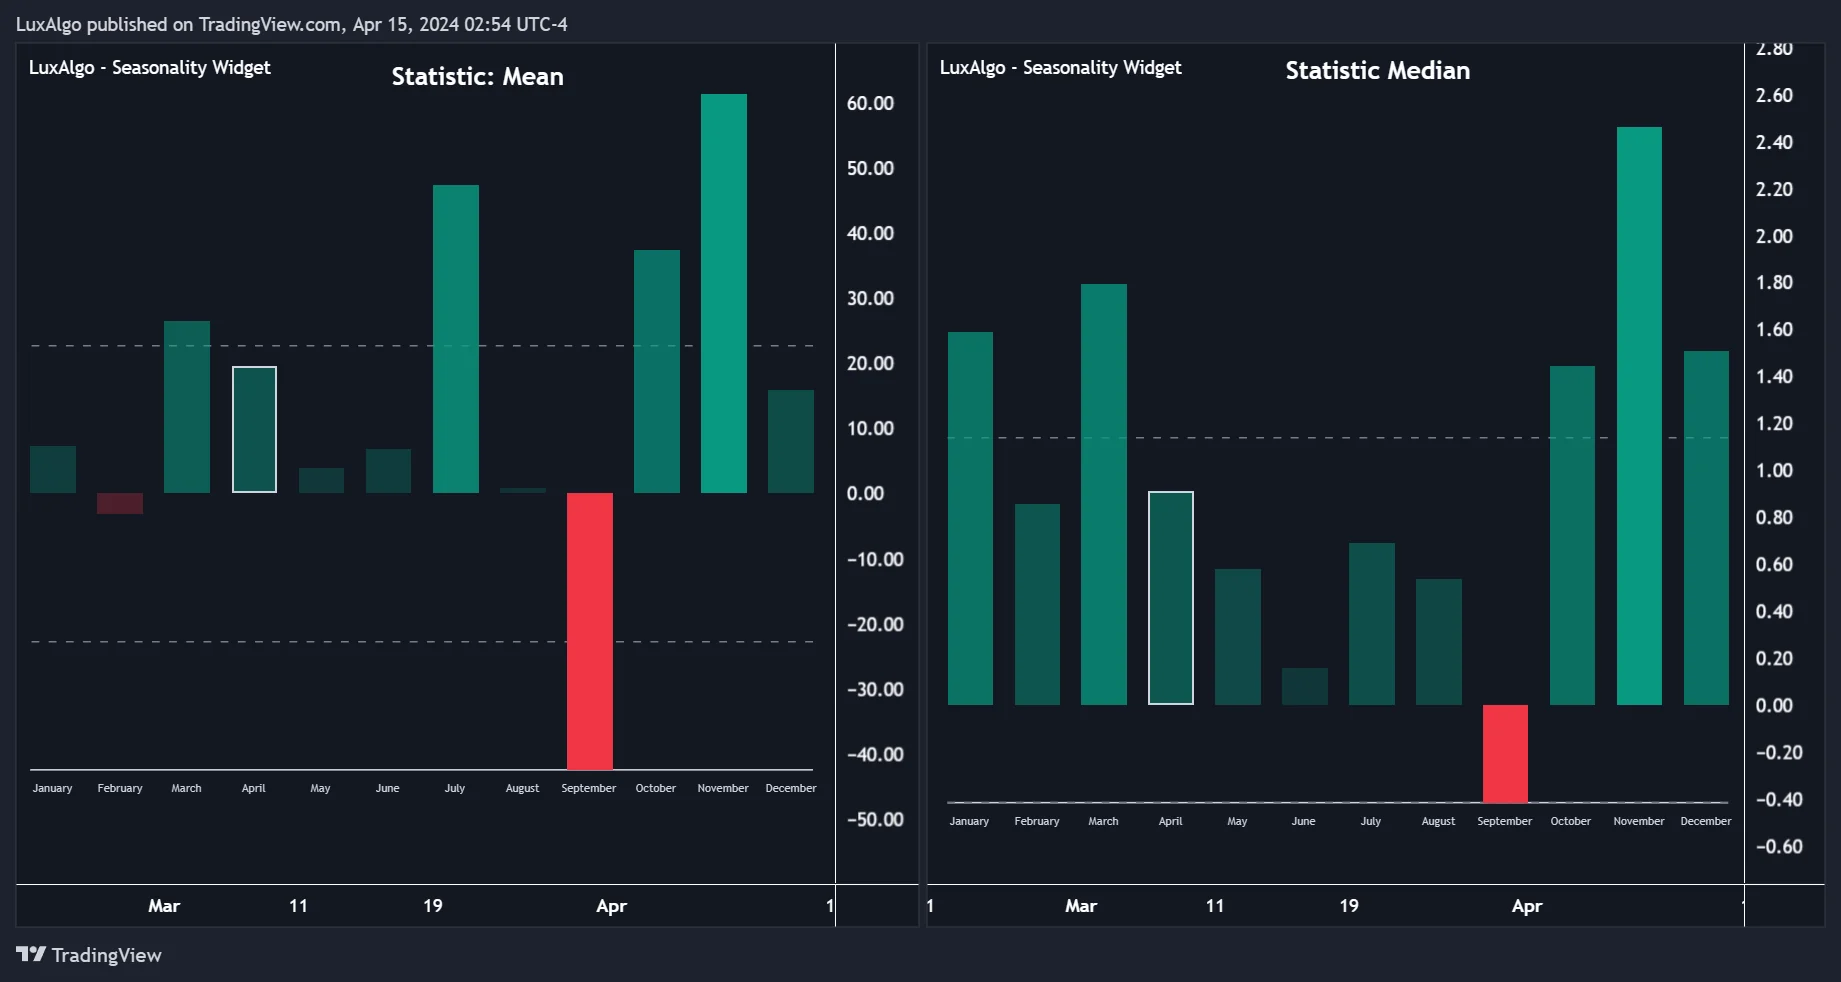
Inspect the number of observations, dispersion and worst periods alongside any average. Ten years of data contain only ten non-overlapping observations for one annual holding window, even if the chart contains thousands of daily bars. Overlapping windows and correlated markets do not provide the same independent evidence as separate observations.
Test the seasonal hypothesis before trading it
1. Define the rule and data before optimizing
Write down the market, data source, timezone, session, entry time, exit time and treatment of holidays. Choose whether the test uses price returns or returns including distributions. For futures, document contract selection and continuous-series adjustments: a rollover or adjustment can affect a measured change. Check missing bars and symbol-history changes before trusting an apparent pattern.
Specify what happens outside the seasonal window. Comparing a seasonal allocation with buy-and-hold requires consistent treatment of cash, dividends, financing and trading costs. Being invested for fewer days changes exposure; it does not automatically establish a superior return for the risk taken.
2. Separate discovery from evaluation
Use an initial period to develop the hypothesis, then evaluate the frozen rules on a later period that was not used to choose them. A chronological walk-forward process can repeat that separation, provided each decision uses only information available at the time. If you change the rule after seeing the evaluation period, that period is no longer a clean unseen test.
Searching many start dates, holding lengths, markets and filters raises the chance of finding a flattering historical result by accident. Keep a record of the alternatives tried. A simple rule that holds up across nearby settings and different periods is more informative than a single best-looking date pair, but robustness checks still cannot guarantee future performance.
3. Keep historical calculations causal
If a strategy uses a learned seasonal score, calculate each historical score only from observations that existed before the trading decision. A chart summarized over the entire available history is useful for exploration, but using that full-history average to select earlier trades would introduce future information.
Do not remove an adverse year merely because it lowers the average. An exclusion needs a defensible reason recorded before the evaluation—for example, a documented data error. If a regime filter uses economic releases, account for publication dates and revisions rather than applying today’s revised series as if it had been known in real time.
4. Measure more than the win rate
A 60% positive rate is not proof of statistical significance or profitability. Suppose six of ten hypothetical trades gain 1% each and four lose 2% each. The arithmetic average trade return is (0.6 × 1%) − (0.4 × 2%) = −0.2% before costs. A high frequency of gains can coexist with a losing strategy.
- Review average and median trade results, the size of losses, drawdown, exposure and the number of independent trades.
- Include realistic commissions, spread, slippage and financing where applicable. A calendar effect smaller than execution costs is not a usable edge.
- Compare with a relevant baseline over the same dates and assumptions. Report both favorable and unfavorable subperiods.
- Inspect the actual trade list around holidays, year boundaries and data gaps; a polished summary can hide incorrect timing.
Combine seasonality with an explicit trading setup
Seasonality can be a context filter rather than an entry signal. For example, a hypothetical rule might allow long trades only during a predefined calendar window, require price above a specified trend measure and enter after a defined breakout. Each added condition needs separate testing; stacking indicators does not automatically improve reliability.
| Component | Example specification | Main risk to check |
|---|---|---|
| Seasonal context | A calendar window fixed before the evaluation period. | Selecting dates after observing the best historical outcome. |
| Trend condition | A stated moving-average length evaluated on completed bars. | Using an unfinished bar or repeatedly tuning the length. |
| Entry | A breakout level and an explicit next-bar or close-based execution assumption. | Assuming a fill at a price that was not available after the signal. |
| Exit | A price stop, time exit and rule for conflicting conditions. | Treating a stop as a guaranteed execution price. |
| Portfolio constraint | A maximum combined exposure across related positions. | Several nominally different trades sharing the same market risk. |
Sector rotation and economic context can help form questions, but avoid assuming that defensive holdings offset every cyclical loss. Test portfolio weights, rebalancing costs and correlated drawdowns. A rotation strategy should be evaluated as a portfolio, not assembled from each sector’s individually best historical months.
Build and review a native LuxAlgo test
- Open the supported symbol and timeframe on native LuxAlgo charts. Record the session and available history before drawing conclusions.
- Use the Seasonality Widget to explore the defined variable and calendar groups. Save the settings and distinguish descriptive full-history charts from a causal trading rule.
- Ask Quant, our coding agent, to implement the exact calendar window, trend condition, entry timing, sizing and exits. State that learned historical statistics must exclude future observations.
- Inspect the generated code, especially date handling, signal timing and order assumptions. Confirm that the requested data and behavior are supported.
- Run the strategy manually. Review inputs and properties, including capital, order size and applicable costs, then inspect the trade list and performance across the planned evaluation periods.
- Record changes and results. Treat any revised rule as a new test rather than silently replacing a disappointing result.
The Quant strategy workflow and native strategy settings document this process. A widget histogram is not an executed strategy backtest.
Size positions for losses, gaps and correlated trades
A seasonal tendency does not override position risk. In a hypothetical stock trade, an entry at $103 and a stop at $100 create $3 of planned price risk per share. If a $200 budget reserves $20 for estimated costs, the remaining $180 allows 60 shares, with $6,180 of position value. Confirm that the capital and trade increments permit that size.
An exit at $109 would produce $360 of gross profit, twice the planned $180 price risk. But a gap to $97 followed by a fill there would lose $360 before costs. Stops do not cap losses at the requested level, and estimated costs can be exceeded. Review overnight events and combined portfolio exposure as well as the single trade.
Reduce or reject a trade when the required position, spread or potential gap is inconsistent with the plan. Do not increase size simply because the calendar window historically had a high positive rate. Keep a record of intended entries and exits, actual fills, deviations and the market conditions that accompanied them.
Video: charting and trading seasonality
This TradingView tutorial shows a chart-based approach to seasonality. Use it as a recorded demonstration, alongside the sample, timing and risk checks above. It demonstrates a different interface from native LuxAlgo and does not establish that an illustrated pattern will remain profitable.
Frequently asked questions
Does market seasonality predict the next trade?
No. It describes historical differences across calendar groups. A tradable rule still needs explicit entries, exits, causal testing, realistic costs and risk limits.
Is a monthly widget bar the return from holding for a month?
Not necessarily. The answer depends on the variable and aggregation. An average of individual bar changes grouped by month is different from a compounded calendar holding return.
How much history is enough for a seasonal strategy?
There is no universal minimum that validates a strategy. Count independent observations for the exact window, inspect different periods and reserve unseen data. Many daily bars can still represent only a few annual repetitions.
Does a 60% positive rate mean a profitable strategy?
No. The size of gains and losses matters. With hypothetical 1% wins and 2% losses, a 60% win rate produces an average trade return of −0.2% before costs.
Should bad years be removed from a seasonality test?
Not merely to improve the result. Exclusions need a documented, defensible reason, and the evaluation should show how sensitive the conclusion is to the sample.
How can I test seasonal rules with Quant?
Specify the calendar window, data, entry timing, sizing and exits. Inspect the generated code for future information and supported behavior, then run the strategy manually and review its trade list and costs.
References
- LuxAlgo — Seasonality Widget; available calendar groupings, analyzed variables and settings.
- LuxAlgo — Original Seasonality Widget publication; calculation definitions, filtering, summary statistics and the two historical chart illustrations.
- LuxAlgo — Native charts; native chart workspace and supported research workflow.
- LuxAlgo — Making strategies; generating, reviewing and manually running strategy code.
- LuxAlgo — Native strategy settings; inputs, properties and backtest assumptions.
- Charting and Trading Seasonality: Tutorial — video; recorded TradingView demonstration.
Numerical examples in this article are hypothetical calculations, not historical strategy results. The references document tool behavior and the supplied illustrations; they do not validate a profitable seasonal edge.
Read next