Market Structure Breakouts for Intraday Trading

A market structure breakout occurs when price moves beyond a previously identified swing level or range boundary. For intraday trading, the useful question is whether a precise entry and exit plan around that event survives costs and failed breaks. A volume spike or a move above VWAP does not guarantee continuation.
Start by defining the level, the timeframe, what counts as a break, and when the trade is invalidated. LuxAlgo’s native charts provide tools for examining structure and participation, while Quant, our coding agent, can help turn explicit rules into a strategy for review.
1. Define the Level Before the Break
A swing high, the upper edge of a range, and the previous session’s high are different reference points. Choose one definition and record it before price crosses it. If a pivot needs later bars to confirm, the level is not available until those bars have formed.
A break above a high within an uptrend can represent continuation. A break against the prevailing structure may warn of a change, but can also lead to a range or a failed break. Terms such as break of structure and change of character depend on the indicator or method’s swing definitions.
Compression can be part of a setup, but it does not require exactly 5–10 candles or symmetrical highs and lows. Specify measurable conditions if you intend to test it, rather than deciding afterward which formations were “high quality.”
2. Choose an Entry Definition
| Approach | Rule to define | Tradeoff |
|---|---|---|
| Intrabar break | An order activates when price reaches a stated level or buffer. | Earlier participation can include brief breaches; fills depend on the order and available liquidity. |
| Closing break | A completed bar closes beyond the preidentified boundary. | Waiting changes the entry price and still does not prevent a failed breakout. |
| Break and retest | Price breaks, revisits a specified area, and meets a recovery condition within a set time. | Some moves never retest; a retest can also fail. |
Do not mix an intrabar entry price with confirmation that only existed at the close. If the trigger uses a closing price, model execution at a later available price under your chosen fill assumptions.
3. Work Through a Hypothetical Plan
Suppose a predefined intraday range has a low of $49 and a high of $50. A completed five-minute bar closes at $50.10, and a next-bar market entry fills at $50.15. These values illustrate the arithmetic, not a tested opportunity.
If the plan places an initial stop at $49.75, planned price risk is $0.40 per share. A hypothetical $100 price-risk budget corresponds to 250 shares before costs, subject to capital and exposure limits. Gaps or slippage can increase the loss beyond $100.
Projecting the $1 range height above $50 gives a measured-move reference of $51. From the $50.15 fill, that is $0.85 potential reward per share against $0.40 planned risk, or about 2.13:1 before costs. The calculation does not predict that price will reach $51.
To make this a complete test, also specify:
- The exact method and period used to form the range, and when it becomes fixed.
- The entry window, maximum number of attempts, and whether additional positions are allowed.
- The order types, costs, stop/target priority, and treatment of bars that touch both.
- A time exit before the relevant session ends, with an explicit timezone and early-close handling.
- What happens when a signal occurs too late to enter and exit under those rules.
“Intraday” should be implemented as an exit policy, not inferred from a five-minute chart. A backtest can carry a position overnight unless its rules close it.
4. Interpret Volume Without Overclaiming
Higher volume indicates more recorded activity over the measurement interval. It can accompany continuation, rejection, news, or liquidation. It does not identify participants’ intentions and is not a reason to hold a position after the planned exit condition.
If you test a volume filter, specify the comparison window and whether the current bar is excluded from the average. A 1.5× threshold is a test parameter, not a universal validity requirement. Intraday comparisons should account for the session’s activity pattern; an opening bar and a midday bar have different context.
Know the data source. Exchange volume, venue-specific crypto volume, and tick counts are different measures. Multiple timeframes can help describe context, but no three-chart combination automatically validates a trade. Use only completed higher-timeframe values available at the decision time.
5. Use Native Volume Profiles and VWAP
On the LuxAlgo platform, add the relevant studies from the native chart’s Orderflow indicators. Use them to define and examine a hypothesis rather than treating their labels as execution instructions.
Volume Profile Context
A volume profile shows recorded volume by price over a chosen window. LuxAlgo’s Session and Rolling profiles use footprint data on supported symbols. Visible Range uses candle volume, and its up/down colors describe bar direction rather than the buy/sell aggressor split.

Record the window and row settings. A visible-range profile changes when you pan or zoom, so it is not a stable historical test input unless the window is fixed. A completed session’s final levels must not be used earlier in that session as though they were already known.
VWAP Context
LuxAlgo’s native VWAP Bands uses candle price and volume, with a Day, Week, or Month anchor in UTC periods. Check the source price and reset boundary. A UTC daily reset is not automatically the cash-market opening time in your local timezone.
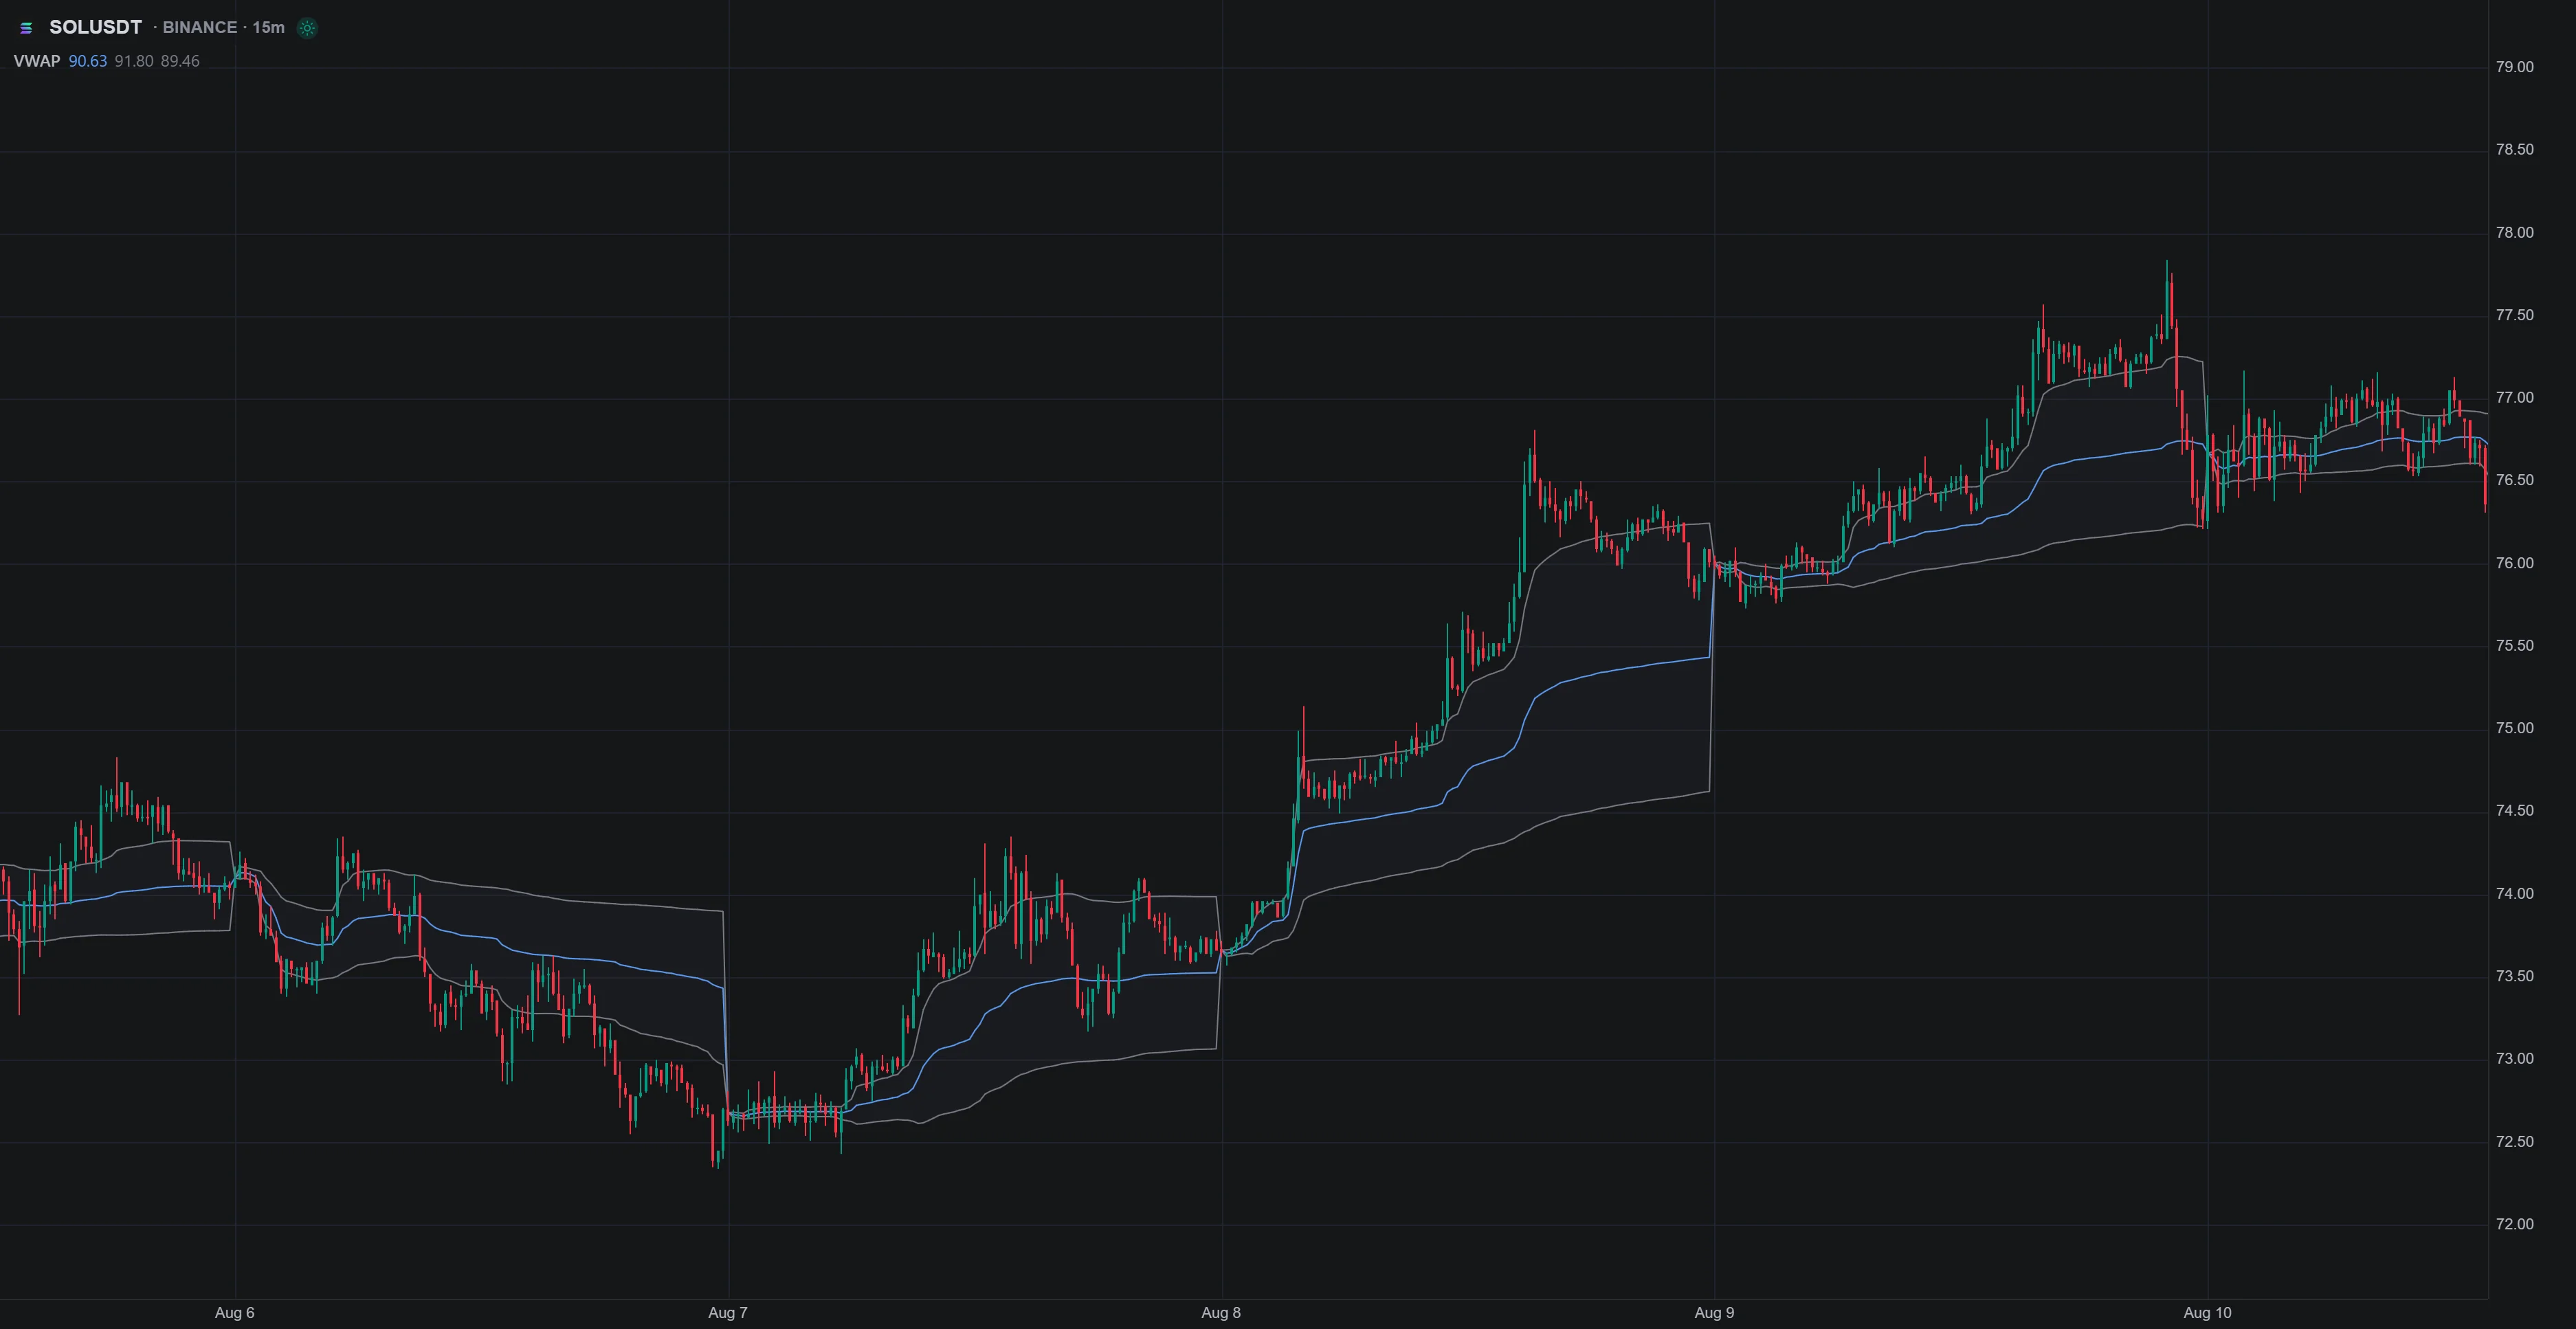
VWAP is a volume-weighted reference, not an intrinsic-value estimate or a record of every participant’s position. If it is a filter in your strategy, write the condition precisely and test its incremental effect.
6. Plan for Failed Breakouts
Define failure before entry: for example, a closing return into the range, a protective price stop, or a time limit without follow-through. Each definition produces different behavior. A brief return inside a level is not universally an immediate exit unless your rules make it one.
Do not widen a stop simply to give a failed setup another chance. Reversing direction is a separate strategy with a new entry, size, and invalidation; a volume spike alone does not justify doubling the decision risk.
Track repeated attempts and related positions. Several breakout trades can share the same market exposure, and rapid re-entry can accumulate costs. Active sessions may offer more activity, but they can also bring fast price changes, wider spreads, and worse fills.
7. Test the Rules with Quant
Ask Quant to implement the exact level definition, entry timing, costs, position limits, and session exit. Open Code to review the implementation, then Run the strategy. The strategy creation guide explains this workflow.
Use the strategy viewer to inspect trades, net profit, trade count, win rate, drawdown, and profit factor. Inputs exposes script parameters; Properties includes capital, order size, pyramiding, commission, slippage, and margin. Save the baseline and meaningful variations.
Review individual failures and end-of-session exits. OHLC bars do not reveal every tick’s sequence or reproduce all liquidity conditions. A fixed slippage setting is an approximation, and generating code does not establish that a strategy is valid.
Choose settings on development data, then evaluate a frozen version on a later unused period. Include unsuccessful variants and test plausible adverse costs. Do not assume the standard Quant workflow automatically performs stress simulations, walk-forward selection, or parameter optimization.
FAQs
What is a breakout of market structure?
It is a move beyond a previously identified swing level or range boundary on a specified timeframe. The trader must define whether a touch, closing break, or retest qualifies. Volume and other indicators can provide context, but no single confirmation guarantees continuation.
Read next