Most Reliable Trading Patterns for New Traders
Head and shoulders, double tops and bottoms, and flags and pennants are useful starting patterns because their structure and completion levels can be described clearly. There is no universal “most reliable” winner across markets, timeframes and trading rules. A recognizable shape is only the beginning of a strategy.
For a new trader, reliability should mean a setup you can identify consistently, test without hindsight and trade with defined invalidation and realistic costs. This guide explains the core patterns, useful confirmation questions, target calculations and a practical learning process using LuxAlgo’s charting and AI platform.
Inspect the formations on Quant Charts and use Quant, our coding agent, to help turn your definitions into code. Start with one pattern and one timeframe; add complexity only when you can measure what it changes.
Quick Comparison of Key Patterns
| Pattern | Traditional role | Completion to define | Common beginner mistake |
|---|---|---|---|
| Head and shoulders / inverse | Trend reversal | Close through the neckline after the structure forms | Trading a shoulder label before a neckline break |
| Double top / bottom | Trend reversal | Break of the intervening trough / peak | Calling two similar extremes a completed reversal |
| Flags / pennants | Trend continuation | Break from the pause in the pole’s direction | Ignoring the prior impulse or a failed setup |
These are learning candidates, not guaranteed recommendations to buy or sell. The same pattern name can describe several implementations, so always record the exact swing, tolerance and breakout rules.
Trading Pattern Fundamentals
Continuation and Reversal Describe Context
A continuation setup is a pause within an established directional move. Flags and pennants require a distinct preceding impulse. A reversal setup attempts to identify a change from the preceding trend; without a trend to reverse, the interpretation is incomplete.
Wedges can appear in continuation or reversal contexts, so do not classify every wedge as a continuation pattern. A rising or falling boundary is geometry, not a promise of the next move.
Separate three stages in your notes: a possible outline, a completed signal under your rules, and the subsequent trade outcome. A good-looking formation may never trigger, and a correctly identified trigger may still lose.
Use Volume as Evidence, Not a Confidence Ladder
Volume describes activity alongside price. An expansion on a break can support a specified filter, but high volume can accompany buying, selling, news reactions or a failed breakout. It is not automatically bullish.
A volume reading of 1.5, 2 or 3 times an average does not map universally to moderate, strong or very strong confidence. Define the comparison window, session and data source. A three-times-volume candle is not, by itself, a reason to increase position size.
For intraday analysis, compare like periods when appropriate: the opening minutes often have different activity from midday. Distinguish exchange-specific volume from consolidated volume, and identify when forex data represent tick activity. Missing volume should remain missing rather than being treated as confirmation.
Lower activity during a flag or a second test can be informative, but it does not certify the pattern. Compare an unfiltered setup with the volume-filtered version on the same data, including failed breaks and missed trades.
Choose a Timeframe You Can Follow
Daily or weekly charts can make historical practice easier to review because decisions arrive less frequently. They also involve wider price swings, overnight gaps and potentially long waiting periods. A higher timeframe does not guarantee a cleaner or more profitable signal.
Choose the interval based on the intended holding period, monitoring time, instrument liquidity and execution costs. A 15-bar consolidation on a five-minute chart is different from 15 daily bars. Require completed higher-timeframe candles if your rule uses their closing information.
There is no universal 500,000-shares-per-day threshold that makes chart patterns reliable. Share count alone ignores price, spread, depth and trade size. Evaluate dollar turnover, bid–ask spread and likely execution for the actual position.
Three Pattern Families to Learn
1. Head and Shoulders
A head-and-shoulders top follows an uptrend and contains three peaks: a left shoulder, a higher head and a lower right shoulder. The neckline connects the two intervening reaction lows. An inverse pattern follows a decline and uses three troughs with a deeper head; its neckline connects the intervening reaction highs.
The shoulders need not be perfectly identical, and the neckline can slope. Define the tolerance and anchor rule before evaluating examples. The StockCharts head-and-shoulders guide distinguishes formation from the neckline break that completes the top.
For a bearish model, a completed close below the neckline can be the trigger. A stop above the right shoulder tests one invalidation premise; a stop above a later retest high tests a narrower one. Waiting for a retest may improve some entries but can also miss a move or encounter a reclaimed neckline.
A basic objective subtracts the head-to-neckline height from the chosen breakout reference. For example, a $120 head and horizontal $110 neckline give a $10 height and a $100 objective. A short fill at $109 with a $115 stop has $6 planned risk and $9 potential reward, or 1.5R before costs. The shape alone does not supply a favorable ratio.
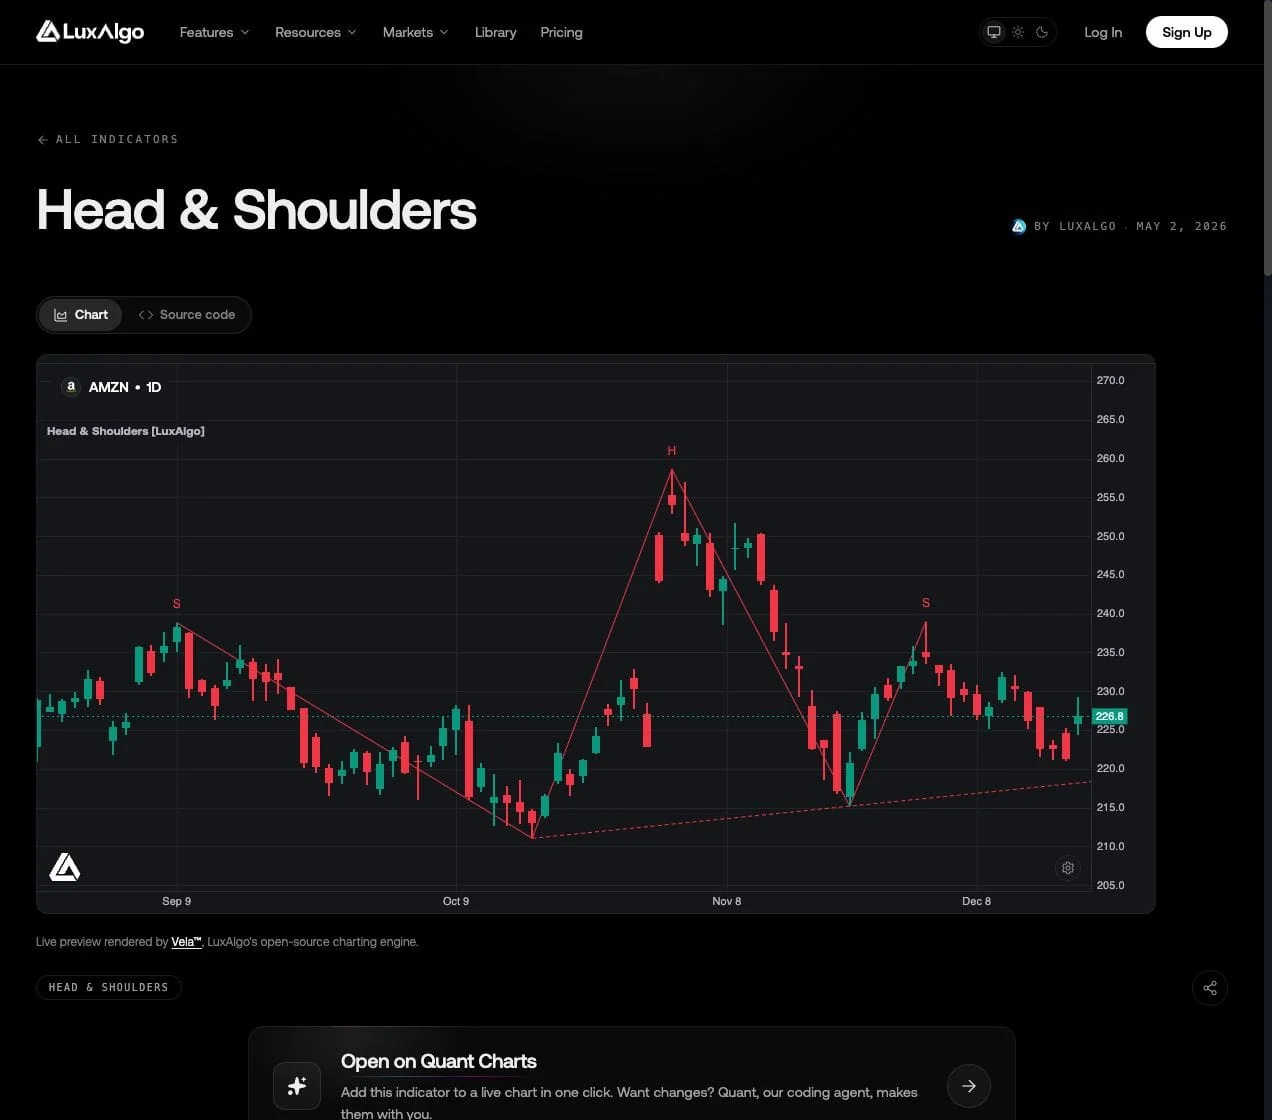
The native LuxAlgo Head & Shoulders indicator distinguishes forming, neckline break, retest and failure events. Its current default swing length requires 10 bars on each side of a pivot. That confirmation delay matters: a backtest cannot act at a pivot before the required later bars exist.
2. Double Tops and Bottoms
A double top has two roughly similar peaks after an advance, separated by a reaction low. The reversal remains incomplete until the intervening support breaks. A double bottom has two roughly similar lows after a decline and completes when price breaks the intervening reaction high.
The double-top and double-bottom guides from StockCharts explain why repeated extremes alone are insufficient. They discuss classical daily-chart conventions; a shorter-term algorithm needs its own explicit parameters.
| Formation | Trigger to define | Possible invalidation reference | Basic objective |
|---|---|---|---|
| Double top | Break below the trough between peaks | Above the second peak or a defined retest high | Subtract peak-to-trough height from the break |
| Double bottom | Break above the peak between troughs | Below the second trough or a defined retest low | Add trough-to-peak height to the break |
For an AMZN-style hypothetical example using unadjusted-looking levels, peaks near $2,050 and intervening support at $1,880 imply a $170 height and a $1,710 basic objective. That is about 9.04% below $1,880, not a 31% measured move. These values illustrate arithmetic; they do not verify a late-2018 Amazon trade or the return captured by a strategy.
When researching an actual historical stock chart, keep split-adjusted and unadjusted prices consistent and record dates, entry, stop and exit. Linking to a company’s shopping or corporate homepage is not evidence for a trading outcome.
Volume analysis also needs direction-specific interpretation. Expansion on the advance from a second bottom or on the resistance break can support a bullish model. Do not require high volume at the second low as a universal rule, or assume rising OBV automatically confirms a bearish head-and-shoulders break.
3. Flags and Pennants
A flag follows a sharp move and consolidates inside an approximately parallel channel, often against the impulse. A pennant follows a sharp move and coils between converging boundaries. The preceding flagpole is essential to the continuation interpretation.
Traditional daily-chart examples often discuss one-to-four-week pauses, but time alone does not define a valid formation. The StockCharts flag-and-pennant guide explains the impulse, consolidation and breakout sequence.
A bullish model requires a qualifying break through the upper boundary; a bearish model requires the corresponding lower break. Define the close or buffer rule, then project the pole height from the chosen breakout reference. A boundary crossing does not guarantee the measured target.
For a hypothetical TSLA-shaped advance from $200 to $240, the pole is $40. A break referenced at $240 projects $280. A $276 objective would instead require a $236 breakout reference. State the actual boundary at the signal bar rather than claiming both targets follow automatically from the same values.
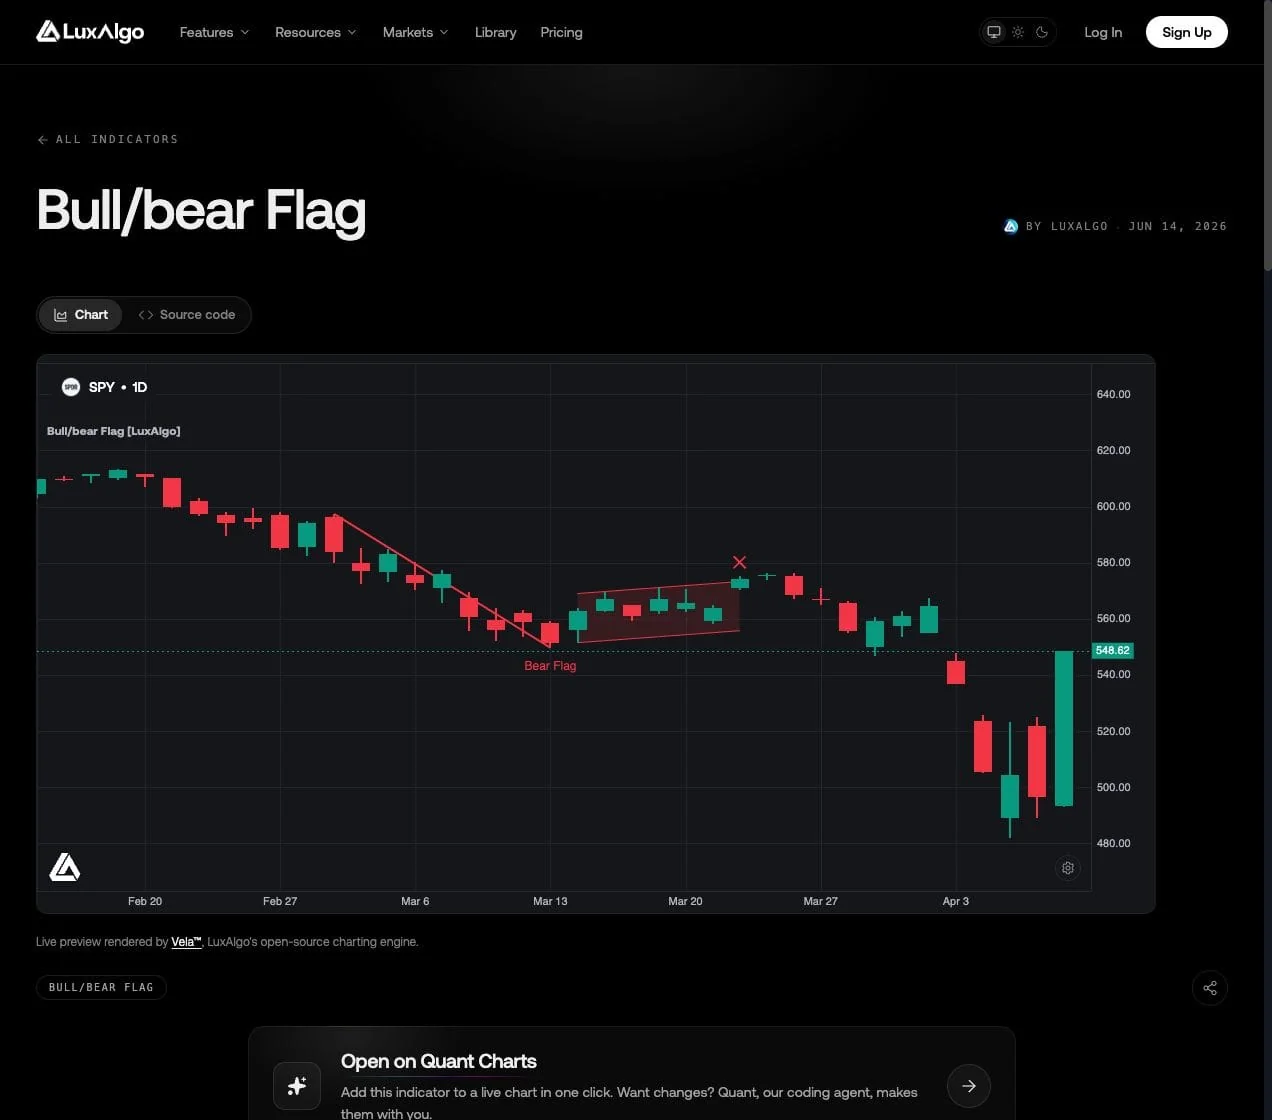
The native Bull/bear Flag indicator separates a qualified pause, a breakout triangle, a measured-target event and an invalidation cross. Documented defaults include a three-ATR minimum pole and a 4–15-bar pause. Its optional volume filter is off by default and bypassed without volume data, so a label is not automatically volume-confirmed.
Pattern Trading in Practice
Give Each Added Indicator a Job
A moving average can provide trend context, RSI or MACD can describe momentum, and ADX can describe measured trend strength. ADX does not provide direction. Stochastic or RSI extremes can persist during a strong move, so they should not be treated as guaranteed reversal signals.
Start with the pattern alone, then test one additional condition at a time. Specify whether an oscillator crossover, divergence, threshold or trend alignment is required. Several price-derived indicators may repeat similar information rather than provide independent confirmation.
For example, compare a double-bottom breakout model with and without an EMA filter while keeping entries, exits and costs otherwise identical. Count the trades that the filter excludes, including winners. More confirmation can also mean later entries and lower available reward.
Inspect Patterns on Quant Charts
Quant Charts brings price, drawings and native Library indicators into the same charting workflow. Open a relevant indicator from its Library page, inspect the actual settings and compare its labeled events with your manual definition.
Separate Cash Risk from Position Size
A cash-risk budget is the planned loss to a specified stop. Position size is the number of shares, units or contracts held; notional exposure is their market value. Saying “position size is 1–2%” mixes these concepts unless the percentage is explicitly defined.
Suppose a $20,000 account uses an illustrative 0.5% planned risk budget, or $100. A long entry at $50 with a $48 stop allows 50 shares before costs. The position represents $2,500 of exposure, or 12.5% of account equity, even though planned price risk is 0.5%.
A $54 target provides $4 per share of potential reward against $2 of risk, or 2R. If the actual entry slips to $51, the unchanged stop and target leave $3 risk and $3 potential reward: 1R. A fill at $47 after a gap loses $150 on the original 50-share position, exceeding the planned $100.
Choose the invalidation level before calculating size. A blanket stop at 1.5 times a single candle’s high-to-low range is not suitable for every pattern. ATR is a different measure, and a longer moving average does not prevent stop execution during volatility. Apply liquidity and exposure caps as well as a cash-risk budget.
Test Reliability as a Complete Strategy
Pattern-completion rate, target-hit rate and profitable-trade rate are different measurements. None can be inferred from the pattern name alone. Published percentages require a dataset, event definition, entry and exit model, costs and evaluation period before they can be compared.
Claims such as 65–75% for double tops and bottoms, 75% for bullish flags, 76.3% for cup-and-handle patterns or 69% for diamond tops should not be treated as current probabilities for your trades without that evidence. Adding an RSI condition likewise does not establish a universal 76% success rate.
Expectancy matters alongside win rate. As a simple hypothetical calculation, winning 70% of trades at an average 0.5R while losing 30% at 2R yields 0.70 × 0.5R − 0.30 × 2R = −0.25R per trade before costs. A high win rate can coexist with a losing strategy.
Use Quant, our coding agent, to help implement the pattern rules, confirmation delay, entry timing, stop, target and failure conditions. Follow Making Strategies with Quant: inspect Code and click Run yourself. The native backtest guide explains how to review the trade list, inputs, costs and summary.
Keep a separate evaluation period, test nearby settings and retain every eligible failure. Check whether the strategy acts only when the pattern was actually knowable.
A Step-by-Step Learning Plan
| Stage | Practical task | Evidence to keep |
|---|---|---|
| Foundation | Learn one pattern and mark possible setups before viewing outcomes | Anchors, trigger rule and invalidation level |
| Replay and testing | Apply the same rule to successes and failures | Signal time, entry, stop, exit and costs |
| Demo practice | Follow the intended schedule and order process | Missed entries, execution differences and rule breaches |
| Review | Compare results with untouched data and nearby parameters | Drawdown, expectancy, sample size and limitations |
Moving from demo to live trading is not simply increasing position size after a few winners. Simulated fills may omit slippage or liquidity constraints, and real exposure changes decision pressure. Use a scale compatible with the account and instrument and evaluate actual execution against the tested assumptions.
Check the Rules for Your Account
Do not treat $25,000 as a universal minimum for all day trading. FINRA’s intraday margin guidance describes changes effective June 4, 2026, with a permitted brokerage transition through October 20, 2027. Firms may still operate under the earlier pattern-day-trading requirements during that transition.
The new framework removes the fixed $25,000 day-trading requirement and uses intraday margin based on positions, but brokers can impose higher house requirements. Confirm which framework your broker applies. FINRA’s frequent-trading guidance also distinguishes cash accounts, settled-funds constraints and margin trading. Rules depend on jurisdiction, instrument and account type.
Neither an account minimum nor a suggested $100,000 starting balance proves that full-time trading is viable. Separate trading capital from living expenses and judge the strategy by evidence, costs and tolerable drawdown rather than an arbitrary balance target.
Chart Pattern Reliability Video
Start with a Definition You Can Repeat
Choose one pattern, identify its completion level and define failure before viewing the outcome. Inspect forming and failed examples on Quant Charts, then use Quant to help test the full strategy. Clear rules, realistic execution and complete records are more useful to a new trader than an unsupported reliability ranking.
FAQs
Which trading pattern is most reliable for beginners?
There is no universal winner. Head and shoulders, double tops and bottoms, and flags and pennants are useful learning candidates because their structure can be defined. Reliability depends on the complete strategy, market, timeframe and costs.
Does high volume guarantee a valid breakout?
No. High volume can accompany continuation, reversal or failure. Define the comparison period and analyze volume alongside price; do not increase risk solely because a candle has unusually high activity.
When is a double bottom complete?
Under the classical reversal definition, it completes when price breaks the intervening reaction high. Two similar lows alone describe a possible setup, not a confirmed trend change.
How should beginners combine patterns with indicators?
Give each indicator a specific purpose, such as an EMA trend filter or a defined momentum condition. Compare the pattern alone against the filtered version with identical exits and costs.
Is risk per trade the same as position size?
No. Cash risk is the planned loss to a specified stop, while position size is the quantity held. Calculate quantity from actual stop distance and apply exposure, liquidity and cost limits separately.
How can LuxAlgo help test pattern reliability?
Inspect native Library examples on Quant Charts. Ask Quant to help implement explicit pattern and execution rules, review the code, click Run and evaluate trade-level outcomes, costs and drawdown.
References
LuxAlgo Resources
- Quant Charts
- Head & Shoulders Indicator
- Bull/bear Flag Indicator
- LuxAlgo Quant
- Making Strategies with Quant
- Native Backtest Guide
External Resources
Read next