Movement Index: Metrics to Identify Surge Potential
The “Movement Index” discussed here is Wilder’s Directional Movement system, commonly called DMI. It combines +DI and −DI for directional context with the Average Directional Index (ADX) for trend strength. It does not calculate the probability or size of a future price surge.
This guide explains the calculations, crossover signals, ADX thresholds and ways to test trend-following and breakout rules. LuxAlgo’s charting and AI platform brings that work together: inspect the indicator on Quant Charts, then use Quant, our coding agent, to help implement a precisely defined strategy.
- Direction: +DI above −DI indicates greater smoothed upward directional movement; the reverse indicates greater downward movement.
- Strength: ADX can rise during either an advance or a decline. A reading above 25 is a conventional trend filter, not a guaranteed entry.
- Timing: Crossovers and threshold changes lag price and can whipsaw. Compare them with price structure and an explicit execution rule.
- Risk: A favorable indicator reading does not determine position size, stop execution or the available reward.
Movement Index: DMI and ADX Components
Separate Direction from Strength
The positive directional indicator, +DI, is based on upward movement between consecutive highs. The negative directional indicator, −DI, is based on downward movement between consecutive lows. Both are smoothed and scaled by true range. They are not simply the percentage of candles closing higher or lower.
ADX smooths the relative separation between those two indicators. A high ADX can accompany a persistent selloff just as easily as a sustained rally. A falling ADX means the measured directional dominance is weakening; price need not reverse or even stop moving in its existing direction.
The StockCharts ADX guide documents Wilder’s calculation and the distinction between direction and strength. “Movement Index” should not be confused with a separate indicator such as Mass Index, which uses a different calculation.
Calculate Directional Movement and True Range
For each bar, compare the change in highs with the change in lows. Use the larger positive directional move; an inside bar or an equal positive tie contributes zero to both directional movement series under the standard rule.
UpMove = current high − previous high
DownMove = previous low − current low
+DM = UpMove if UpMove > DownMove and UpMove > 0; otherwise 0
−DM = DownMove if DownMove > UpMove and DownMove > 0; otherwise 0
TR = max(current high − current low,
         abs(current high − previous close),
         abs(current low − previous close))
The absolute values matter: a gap below the previous close still contributes positively to true range. Suppose the previous high, low and close are $100, $95 and $98, while the current high and low are $103 and $96. UpMove is $3, DownMove is −$1, so +DM is $3 and −DM is zero. True range is max(7, 5, 2), or $7.
For a gap-down example with a previous close of $100 and a current high and low of $96 and $93, true range is max(3, 4, 7), or $7. Using the signed differences would incorrectly reduce the result to $3.
Use Consistent Wilder Smoothing
A common setup uses a 14-period directional length and a separate 14-period ADX smoothing length. With RMA denoting Wilder’s running average, whose smoothing factor is 1/n, the calculation can be written as:
+DI = 100 × RMA(+DM, 14) / RMA(TR, 14)
−DI = 100 × RMA(−DM, 14) / RMA(TR, 14)
DX = 100 × abs(+DI − −DI) / (+DI + −DI)
ADX = RMA(DX, 14)
Do not divide a smoothed sum of directional movement by an averaged true range: both numerator and denominator must use the same convention. Handle zero denominators explicitly and compare initialization with the implementation you use. The first ADX is commonly seeded with an average of the initial DX values; subsequent values follow Wilder’s recursive smoothing rather than a fresh simple moving average.
For a numerical illustration, smoothed +DM of 0.60, −DM of 0.20 and true range of 2.00 give +DI = 30 and −DI = 10. DX is 50. If the previous 14-period ADX was 20, the next value is (13 × 20 + 50) / 14, approximately 22.14. A large current DX therefore need not immediately push ADX above 25.
Warm-up history affects the result. The roughly 150 periods discussed in Wilder-based calculation examples concern convergence of the smoothing, not a mandatory 150-bar holding period or proof that DMI only works on long-term charts. Record both the warm-up and the timeframe.
Reading Movement Index Signals
Treat ADX Levels as Conventions
| ADX reading | Conventional interpretation | What it does not establish |
|---|---|---|
| Below 20 | Weak or inconsistent directional trend | That a breakout cannot begin |
| 20–25 | Transition zone; definitions vary | An automatic buy or sell |
| 25–50 | Stronger measured trend | The direction or profitability of a trade |
| 50–75 | Very strong recent directional dominance | A larger remaining price target |
| 75–100 | Exceptionally high directional dominance | A scheduled reversal or a reliable surge forecast |
These labels describe the indicator, not fixed market laws. A higher threshold filters out more setups and often delays entry. A lower threshold reacts earlier but also admits more uncertain conditions. The relevant question is how the chosen rule behaves on the specific market and interval after costs.
Interpret +DI and −DI Crossovers
A completed-bar cross of +DI above −DI can be a bullish candidate; a cross of −DI above +DI can be a bearish candidate. Requiring ADX above 25 adds a strength condition. It does not prove that momentum is accelerating at the entry or that the next candle will continue.
Distinguish “crosses above today” from “remains above.” A strategy that enters on every bar with +DI above −DI differs from one that enters only on the first crossover. Define whether a position may already be open and whether repeat entries are allowed.
Read the Change in ADX Alongside Price
Rising ADX with −DI dominant can support a bearish trend interpretation. Falling ADX above 25 can accompany a slowing but continuing trend. A move from below 20 to above 25 is a change in the filter state; price must independently break the chosen level before it becomes a breakout setup.
A strong trend can switch direction while ADX stays elevated. Conversely, a new move may begin while ADX remains low because the smoothing has not caught up. Avoid adding to a position solely because ADX rises; any scale-in rule needs its own risk limit and test.
Trading Strategy Implementation
Define a Trend-Following Candidate
One testable long model requires a completed +DI crossover, ADX above 25 and a close above a chosen trend average. Specify the fill convention, such as the next bar’s open, and an exit rule before reviewing performance. A bearish model needs its own short-sale or instrument-specific execution assumptions.
For an illustrative rule, use DI length 14, ADX smoothing 14 and a 50-period EMA. Enter only after the crossover bar closes, allow one position at a time, and exit on a defined opposite signal or protective stop. These are research parameters, not a proven combination.
A Microsoft study for February 2023 through February 2024 would need the exact start and end dates, price adjustments, source data, strategy code and transaction assumptions to be reproducible. A net-profit percentage, win rate, profit factor and drawdown without that record cannot establish an MI strategy’s performance. Rebuild the test and retain its trade list before citing an outcome.
Combine Measures That Answer Different Questions
| Measure | Question it can help answer | Rule to define and test |
|---|---|---|
| 50- and 200-period EMAs | Where is price relative to a smoothed trend? | Price above an EMA, or an explicit EMA alignment condition |
| RSI | How does recent upward movement compare with downward movement? | A specific threshold or crossover; do not assume the whole 30–70 zone confirms a trade |
| Volume | Has activity expanded relative to a comparison window? | For example, completed volume above the previous 20-bar average on a consistent feed |
| Support and resistance | Has price actually left the selected range? | A close beyond a level fixed before the signal |
Several price-derived filters can repeat similar information. RSI below 70 does not guarantee room for a rally, and RSI above 70 can persist during a strong uptrend. Compare the base DMI rule against each added condition using the same dates, costs and exit logic.
Keep daily and intraday settings distinct: a 50-period EMA on a five-minute chart is not a 50-day EMA. For higher-timeframe filters, use only information available at the decision time and specify whether the higher-timeframe candle must be complete.
Require a Separate Price Break
- Mark resistance for a long setup or support for a bearish setup before the signal.
- Define the break, such as a completed close beyond that level, and whether a retest is required.
- Check that +DI/−DI direction agrees with the setup and apply the chosen ADX rule.
- If using volume, define the feed and comparison period; unavailable volume is not confirmation.
- Set the invalidation level, actual-entry risk and exit rule before placing an order.
A breakout can fail despite all these conditions. Waiting for ADX or a retest can reduce some premature entries while missing other moves or worsening the eventual entry price. Test those tradeoffs instead of labeling every combined signal “confirmed.”
Work Through Entry Risk and Slippage
Consider a hypothetical stock setup that triggers above $100, fills at $101 and uses a structurally chosen $97 stop with a $109 target. Planned risk is $4 per share and potential reward is $8, or 2R before costs.
A $20,000 account with an illustrative 0.5% cash-risk budget allocates $100 of planned risk. That allows 25 shares, representing $2,525 of exposure. A stop fill at $97 loses $100 before costs; a gap that results in a $95 exit loses $150. The budget is an arithmetic example, not a universal allocation recommendation.
If entry slips to $103 while the stop and target stay fixed, risk becomes $6 and potential reward becomes $6: only 1R. Reducing size to 16 shares keeps planned price risk at $96. The ADX reading does not compensate for that changed trade geometry.
Analyze DMI with LuxAlgo
Open the Actual ADX System on Quant Charts
The current Average Directional Index Library indicator implements the full standard Wilder system. It plots +DI, −DI and ADX with separate DI Length and ADX Smoothing inputs, both defaulting to 14, plus a Key Level defaulting to 25.
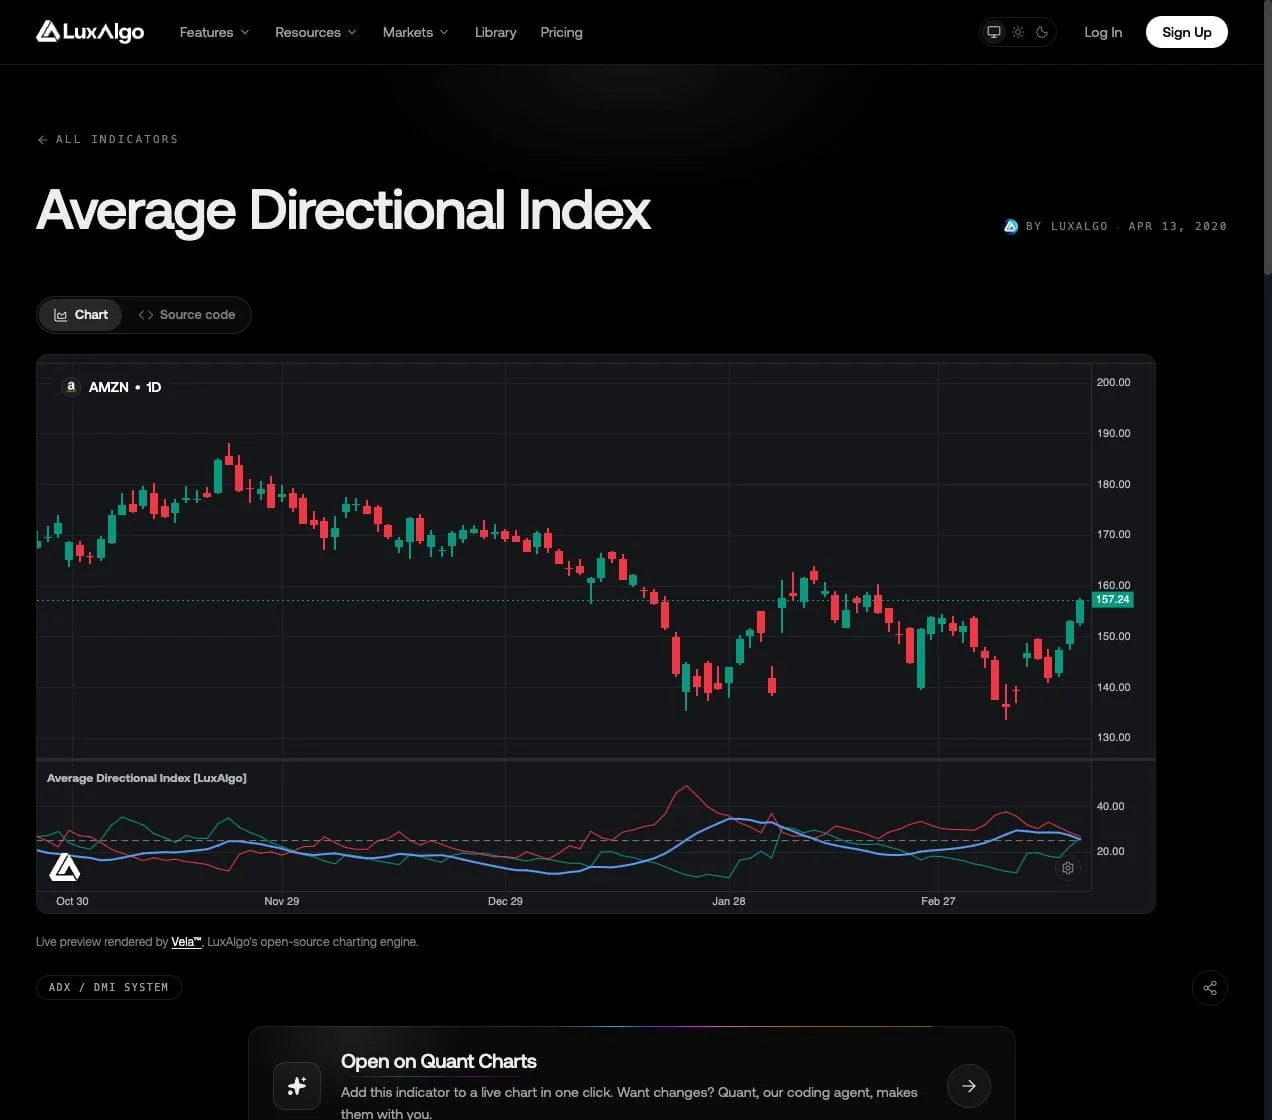
The Library page provides an Open on Quant Charts action. Review the plotted values, settings and source alongside the candles on Quant Charts. The documented indicator includes bullish DI cross, bearish DI cross and ADX-above-key-level alert conditions; an alert condition is not a filled trade or a profitable strategy.
Keep the symbol, timeframe and settings fixed when comparing an indicator chart with a backtest. Changing the data feed or smoothing length can move crossover bars and change the trade list.
Build an Explicit Test with Quant
Use Quant, our coding agent, to help turn the DMI conditions into strategy code. Specify the DI and ADX lengths, crossover event, strength threshold, EMA filter, completed-bar requirement, fill timing, stop, target and repeat-entry policy.
Follow Making Strategies with Quant: open Code to inspect the generated script, then click Run yourself. Configure costs, order size and other simulation properties, and use the native backtest guide to review the trade list and summary.
Compare a base DMI model with versions that add ADX, EMA or volume filters. Keep an untouched evaluation period, inspect losing trades and test nearby parameter values. Report trade count, net profit, average trade, drawdown and profit factor together; a higher win rate alone can hide worse overall results.
DMI Video Guide
A Practical Starting Process
Start with the standard DMI calculation, distinguish direction from strength, and choose one clearly defined entry and exit model. Inspect both successful and failed signals on Quant Charts. Use Quant to help implement the test, then review the code, fills and costs yourself before drawing conclusions about surge potential.
FAQs
Is the Movement Index the same as DMI?
This article uses Movement Index to refer to Wilder’s Directional Movement system: +DI, −DI and ADX. Use the standard DMI or ADX name when searching for an implementation, and check its calculation.
Does ADX above 25 predict a price surge?
No. It is a conventional filter for stronger measured directional movement. ADX does not supply price direction, a surge probability or a target, and its smoothing introduces lag.
Does falling ADX mean the trend has reversed?
No. It indicates weakening measured directional dominance. Price can continue in the same direction, consolidate or reverse; use the DI lines and price structure to distinguish those outcomes.
How can DMI be combined with RSI and EMAs?
Give each filter an explicit purpose and rule. For example, compare a DMI crossover model with an EMA trend filter and then an RSI condition. Test the incremental effect instead of assuming more indicators improve accuracy.
When are DMI crossovers most difficult to use?
Frequent reversals and range-bound conditions can produce repeated crossovers. ADX filtering can reduce some signals but may also delay or exclude useful ones. Evaluate the tradeoff on the intended market and timeframe.
How can LuxAlgo help test a DMI strategy?
Open the native Average Directional Index Library indicator on Quant Charts. Ask Quant to help code explicit entries, exits and risk rules, inspect the code, click Run and evaluate the resulting trades and costs.
References
LuxAlgo Resources
- Quant Charts
- Average Directional Index Indicator
- LuxAlgo Quant
- Making Strategies with Quant
- Native Backtest Guide
- LuxAlgo Pricing
External Resources
Read next