Mutual Funds Demystified: Build a Diversified Portfolio

A mutual fund is an SEC-registered open-end investment company that pools money from many investors and invests it in a portfolio of stocks, bonds, money-market instruments or other assets, run by an SEC-registered investment adviser. That is the US Securities and Exchange Commission's own definition, and it contains the three things a new investor most needs to know: the fund is regulated and must disclose, the portfolio is professionally managed, and each share is a proportional slice of the whole, so one purchase buys the diversification the fund holds. This guide walks through how a mutual fund works and how it is priced, the fund types the SEC describes, the fee table every prospectus must carry and what those fees cost over time, how a mutual fund differs from an ETF, and how to build and maintain a diversified mix of funds. It also covers where Quant Charts, LuxAlgo's charting and AI platform, fits: it does not chart mutual funds, which are not exchange-traded, but it charts the index ETFs that stand in for a fund's benchmark or asset class, its Library explains the risk measures a fund's fact sheet quotes, and Quant, the coding agent, can backtest a rule on the benchmark so the comparison is a test rather than a hope.
Key points:
- One price a day. Mutual fund shares are bought from and redeemed to the fund at the next net asset value, so you never know the exact price when you place the order.
- The fee table is the contract. Management, 12b-1 and other expenses come out of fund assets; sales loads and account fees are charged to you directly, and the prospectus must list them all.
- Small fees compound. The SEC's illustration shows a $100,000 investment ending roughly $29,000 lower over twenty years at a 1.00 percent fee than at 0.25 percent.
- Diversification is a portfolio property. It comes from combining funds whose returns do not move together, which is a correlation question you can actually measure.
How a Mutual Fund Works
The SEC's mutual funds page on Investor.gov describes the mechanics. Investors buy shares from the fund itself, or through a broker or adviser, rather than from other investors on an exchange, and the purchase price is the next calculated net asset value, the fund's assets minus liabilities divided by shares outstanding, plus any purchase fees. Shares are redeemable: you can sell them back to the fund on any business day at the next NAV, minus any redemption fees. NAV is typically calculated once a day after the major US exchanges close, which is why a mutual fund order placed at ten in the morning executes at a price you learn that evening. You earn money three ways: dividend payments passed through from the portfolio's income, capital gains distributions when the fund sells holdings at a profit, and an increase in NAV as the portfolio's value rises; funds usually let you take distributions in cash or reinvest them in more shares.
The page is equally direct about what a fund is not. Mutual funds are not guaranteed or insured by the FDIC or any government agency, you can lose some or all of your money, and past performance does not predict future returns, though it does show how volatile a fund has been. The SEC lists why investors choose funds anyway: professional management, diversification across companies and industries so that one failure hurts less, low minimum investments for initial and subsequent purchases, and liquidity at the next NAV. Each of those benefits has a cost attached, and the rest of this guide is mostly about reading that cost.
Types of Mutual Funds
The SEC groups funds by what they hold and how they are run. Stock funds invest primarily in equities and can rise and fall quickly and dramatically over the short term; bond or income funds hold debt securities that vary in risk, duration and volatility; target date funds hold a mix of other funds and shift toward bonds as the target date nears, with the warning that a fund of funds may charge a double layer of fees; money market funds hold liquid short-term debt and cash equivalents and are often used as a cash substitute. Cutting across those categories is the passive-versus-active distinction. An index fund tries to match a particular index before fees, which usually means less trading, lower realised capital gains and lower fees; an actively managed fund pursues a stated objective through the manager's choices and may outperform, but the SEC notes its performance depends heavily on the manager's skill. The index funds page adds the risks specific to passive funds: lack of flexibility to react to declines in index constituents, tracking error when the fund holds only a sample of the index, and underperformance of the index itself because of fees, trading costs and tracking error.
| Fund type | What it holds | What the SEC flags |
|---|---|---|
| Stock fund | Equities chosen by the fund's objectives, policies and strategies | Value can rise and fall quickly and dramatically in the short term |
| Bond or income fund | Bonds and other debt, concentrated or mixed by type | Holdings vary in risk, return, duration and volatility |
| Target date fund | A mix of stock, bond and other funds that grows more conservative toward the date | A fund of funds may carry a double layer of fees |
| Money market fund | Liquid short-term debt, cash and equivalents | Often used to store cash; still not FDIC insured |
| Index fund (any of the above) | The securities of a chosen index, or a sample of them | Tracking error, lack of flexibility, trails the index after fees |
Reading the Fee Table
The SEC's fees and expenses bulletin, updated in July 2025, explains that every mutual fund prospectus must carry a standardised fee table in two parts. Annual fund operating expenses are paid out of fund assets, so you never see a bill: management fees to the adviser, distribution and service fees authorised by SEC rule 12b-1 that pay for marketing and for the brokers who sell the shares, and other expenses such as legal, accounting, custody and transfer-agent costs. Their total, expressed as a percentage of average net assets, is the expense ratio. Shareholder fees are charged to you directly and are uncommon for ETFs but common for mutual funds: a sales load that compensates the selling broker, charged up front or deferred until you redeem, a redemption fee, an exchange fee for moving between funds in the same family, and account fees, sometimes only on small balances. The bulletin's example is worth keeping in mind: write a $10,000 cheque for a fund with a 5 percent front-end load and $500 goes to the broker, leaving $9,500 to buy shares. Larger purchases often qualify for reduced loads at thresholds called breakpoints, and the SEC's characteristics bulletin notes that many funds offer several share classes of the same portfolio with different fee structures.
Two further points from the bulletin protect you from the marketing. A fund that calls itself no-expense or zero-expense may still cost you money through commissions to the broker who sells it, an adviser's wrap fee, or costs outside the expense ratio such as securities lending and the transaction costs the fund pays when it trades. And the fee table does not show what you pay intermediaries. The SEC points to FINRA's Fund Analyzer for comparing total costs across funds, and its fees page supplies the arithmetic that makes the comparison matter.
| Annual fee | Value of $100,000 after 20 years at 4% growth | Cost versus the 0.25% fund |
|---|---|---|
| 0.25% | About $208,000 | Baseline |
| 0.50% | About $198,000 | About $10,000 |
| 1.00% | About $179,000 | About $29,000 |
Mutual Fund or ETF
The characteristics bulletin is the SEC's side-by-side, and its verdict is that the two are more alike than different: both are registered funds with prospectuses, both are usually professionally managed, both can be broad or narrow, both can be passive or active, and both charge fees regardless of performance. The differences are mechanical. A mutual fund is bought from and redeemed to the fund at the end-of-day NAV, while an ETF trades between investors on an exchange at a market price that can sit above or below NAV. A mutual fund may charge shareholder fees and 12b-1 fees, while an ETF generally charges neither but may cost brokerage commissions. And in a taxable account many ETFs distribute fewer capital gains because they create and redeem shares in kind; inside a 401(k) or IRA the bulletin says there is no tax difference at all. For an investor making regular contributions in fixed dollar amounts, a mutual fund's fractional shares and no-commission purchases from the fund are often the practical advantage; for someone who wants to trade intraday or hold in a taxable account, the ETF structure usually is.
Building a Diversified Mix
Diversification is the reason most people buy funds, and it is worth being precise about where it comes from. A single broad stock fund diversifies away the risk of one company failing, which is the benefit the SEC names. It does not diversify away the risk of the stock market falling, because every holding is exposed to it. Reducing that requires combining funds whose returns do not move together, typically stocks with bonds and, for some investors, cash equivalents and international holdings, and then keeping the mix at its intended weights. The practical steps follow from the SEC material: decide what each fund is for, growth, income or stability, before choosing it; prefer the lowest total cost that delivers the exposure you want, using the fee table and the Fund Analyzer; read the prospectus and the most recent shareholder report, which the SEC says are available free from the fund and on its own website; and rebalance on a schedule or when weights drift, directing new contributions to whatever is underweight so that rebalancing does not itself trigger sales, taxes and, for loaded funds, new charges.
Two measurement habits keep the word "diversified" honest. Check the correlation of the funds' returns to each other, not just their names: two funds with different labels can hold overlapping portfolios, and the Library's correlation entry explains why the calculation belongs on returns over a rolling window rather than on prices, which trend together and exaggerate the relationship. And read the fund's risk figures as a set. Fact sheets quote standard deviation, beta and alpha against a benchmark and a Sharpe ratio; the Library's standard deviation, beta, alpha and Sharpe ratio entries define each, and the Sortino ratio entry explains why a fund whose volatility is mostly upside is better judged on downside deviation alone.
Where Quant Charts Fits
Quant Charts does not chart mutual funds. Its data covers exchange-traded US equities, including ETFs, from an exchange venue, and crypto, with forex, commodities and CME futures on paid plans; a mutual fund has no exchange ticker and no intraday price, so it is not on the platform, and nothing here suggests otherwise. What Quant Charts offers a fund investor is the benchmark. Almost every mutual fund tracks or is measured against an index that has a liquid ETF proxy, and that proxy is where the fund's asset class can be studied, compared and tested. Put the proxies for each fund in your mix on a Watchlist and the Advanced view's Allocation panel draws a donut by asset class with a sector-exposure view for equities, a quick check that a portfolio described as balanced actually holds more than one kind of risk.

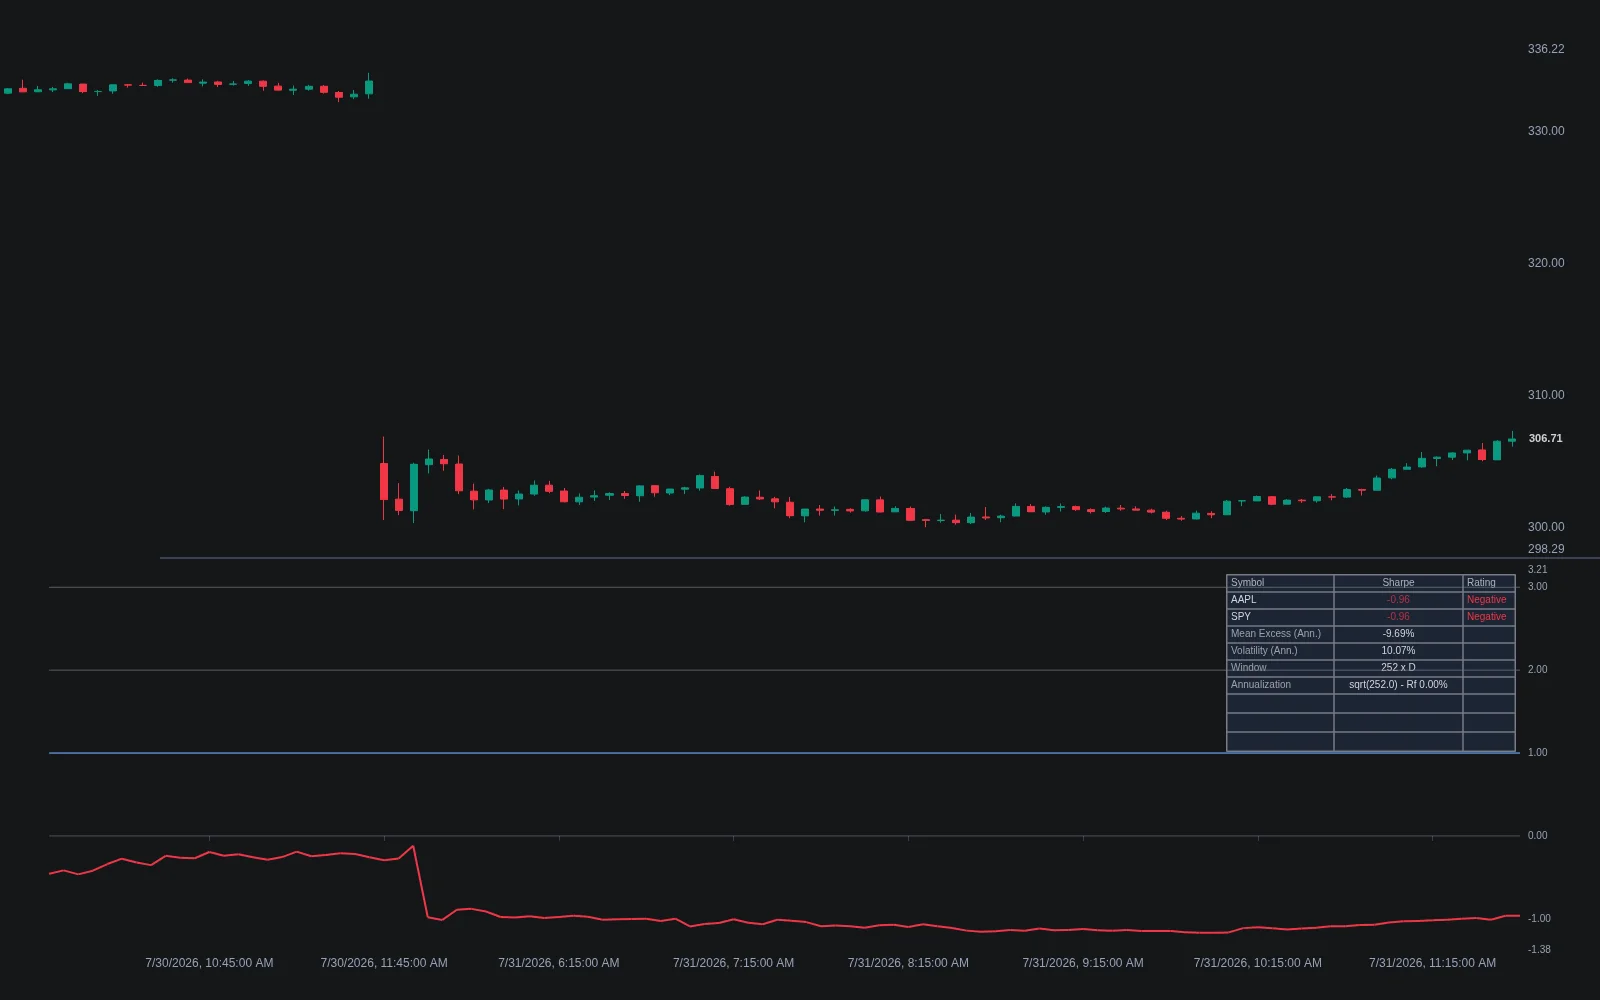
The Library's Sharpe Ratio indicator makes the fact-sheet number live. It plots a rolling annualised Sharpe ratio from the last 252 daily returns on the chart symbol and ranks it in a dashboard against up to three comparison symbols computed the same way, with a broad stock index ETF, a Nasdaq-100 ETF and a long-Treasury ETF as the defaults. Loaded on the proxy for your stock fund, with the proxy for your bond fund as a comparison, it shows in one pane whether the two asset classes have been earning their volatility over the same window, and its documentation is candid that short windows are noisy and a skewed return stream can flatter the number until a tail event arrives. The drawdown statistics entry supplies the other half of the picture, the depth and duration of declines, which is what a fund's standard deviation hides and what most investors actually experience.
The test is the part a fact sheet cannot give you. Suppose you are weighing a plain index fund against a fund whose pitch is that it steps out of the market in downturns. Describe that rule to Quant in plain language on the benchmark ETF's daily chart, for example hold while the close is above its 200-day average and sit in cash otherwise. Quant writes the Pine Script as a strategy, you inspect it under Code and click Run, and the Backtest Summary reports net profit, trade count, win rate, maximum drawdown and profit factor across the chart's history, with commission and slippage set in the strategy Properties. Compare that with simply holding the proxy and you have a costed answer to whether the tactical fund's idea has been worth its higher fee on this market, before you pay the fee. Two cautions from the docs apply: run the test on the exact symbol and timeframe you mean to rely on, because results from another market do not transfer, and use a standard chart type, since Heikin Ashi candles do not produce realistic backtests.
Where Each Tool Stops
The fund's prospectus, shareholder report and fee table, together with the SEC's investor pages and FINRA's Fund Analyzer, tell you what a mutual fund holds, costs and has returned; the fund company or your broker executes purchases and redemptions at NAV. Quant Charts charts exchange-traded proxies, not mutual funds, and offers the Watchlist's allocation view, Library concepts and indicators for correlation and risk-adjusted return, and Quant's strategies with the Backtest Summary for testing a rule on a benchmark; it holds no fund NAVs, expense ratios or holdings and places no orders. The LuxAlgo platform does not place orders for you; it is a charting platform.
Conclusion
A mutual fund is a regulated, professionally managed pool priced once a day at net asset value, and the SEC's own pages give you everything needed to judge one: the types and their risks, the fee table's two halves, the arithmetic of what a fee costs over twenty years, and the mechanical differences from an ETF. Diversification comes from combining funds whose returns do not move together and keeping the weights honest, which is a correlation question rather than a labelling one. Quant Charts cannot chart the fund itself, but on the benchmark ETFs that stand in for each fund's asset class it can show allocation, rolling risk-adjusted return and drawdown, and through Quant's Backtest Summary it can test whether a fund's active idea has earned its fee before you commit to paying it.
Key Takeaways
- Mutual fund shares are bought from and redeemed to the fund at the next daily NAV; the fund is SEC-registered but not insured, and past performance shows volatility, not future returns.
- The prospectus fee table separates operating expenses taken from fund assets from shareholder fees such as loads charged to you; a 5% front-end load on $10,000 leaves $9,500 invested.
- The SEC's illustration shows a 1.00% annual fee costing about $29,000 more than 0.25% on $100,000 over 20 years at 4% growth.
- Mutual funds and ETFs differ in pricing, shareholder fees and taxable-account tax treatment; inside a 401(k) or IRA there is no tax difference.
- Quant Charts does not chart mutual funds but charts their benchmark ETFs: use the Watchlist allocation view, Library correlation and Sharpe tools, and Quant's Backtest Summary to test a fund's idea.
FAQs
What is a mutual fund?
The SEC defines a mutual fund as an SEC-registered open-end investment company that pools money from many investors and invests it in stocks, bonds, money-market instruments or other assets, managed by an SEC-registered investment adviser. Each share represents part ownership of the portfolio, and shares are bought from and redeemed to the fund at the next calculated net asset value.
How is a mutual fund priced?
At net asset value, the fund's assets minus liabilities divided by shares outstanding, which is typically calculated once each business day after the major US exchanges close. Purchases are filled at the next NAV plus any purchase fees and redemptions at the next NAV minus any redemption fees, so you do not know the exact price when you place the order.
What fees does a mutual fund charge?
The prospectus fee table lists annual operating expenses paid from fund assets, management fees, 12b-1 distribution and service fees and other expenses, whose total is the expense ratio, and shareholder fees charged directly to you, such as front-end or back-end sales loads, redemption, exchange and account fees. Brokerage commissions and adviser fees are paid on top and are not in the table.
How does a mutual fund differ from an ETF?
A mutual fund is bought from and redeemed to the fund at end-of-day NAV and may charge shareholder and 12b-1 fees; an ETF trades on an exchange at a market price that can differ from NAV, generally has no shareholder fees but may incur commissions, and often distributes fewer capital gains in taxable accounts. The SEC notes there is no tax difference inside a 401(k) or IRA.
How do I build a diversified fund portfolio?
Combine funds whose returns do not move together, typically broad stock and bond funds and possibly cash and international exposure, decide each fund's role before choosing it, prefer the lowest total cost for the exposure, read the prospectus and shareholder report, and rebalance on a schedule or when weights drift, using new contributions where possible. Check correlation of returns, not just fund names.
Can I use Quant Charts with mutual funds?
Not directly: Quant Charts charts exchange-traded US equities including ETFs, and crypto, not mutual funds. Use the ETF that tracks a fund's benchmark as a proxy. The Watchlist shows allocation by asset class, the Library's Sharpe Ratio indicator compares rolling risk-adjusted returns across proxies, and Quant can backtest a rule on the benchmark with the Backtest Summary reporting net profit, trade count, win rate, max drawdown and profit factor.
References
LuxAlgo Resources
- Quant Charts
- Quant Charts data coverage
- Watchlist Advanced view and Allocation
- Quant: making strategies and the Backtest Summary
- Library concept: correlation
- Library concept: standard deviation
- Library concept: beta
- Library concept: alpha
- Library concept: Sharpe ratio
- Library concept: Sortino ratio
- Library concept: drawdown statistics
- Library: Sharpe Ratio indicator
External Resources
Read next