Net Volume: Calculating Net Buying vs Selling Volume
Net volume measures the difference between two directionally classified volume totals over a chosen period. In an uptick/downtick calculation, subtract downtick volume from uptick volume. A positive result means more volume fell into the uptick category; it does not identify the traders or guarantee that price will rise.
Start with a clearly defined calculation on LuxAlgo’s native charts, then use Quant to help build and test a strategy around it. Keep tick-based net volume, candle-direction estimates, and aggressor-based volume delta distinct: similarly named tools can use different data.
How to Calculate Net Volume
Define the Direction Rule First
For the tick-direction method discussed here, compare each execution price with the previous execution price. A higher price is an uptick and a lower price is a downtick. Unchanged-price trades need an explicit convention; an implementation may carry forward the previous direction or keep a neutral category.
Net volume = uptick volume − downtick volume.
Every trade has a buyer and seller. An uptick is not direct proof that the buyer initiated the trade against the offer, and a downtick does not identify the seller’s motive. Bid/ask or aggressor classification is a separate method requiring appropriate execution data. A candle-based approximation is another distinct calculation.
TradingView’s Net Volume overview discusses the directional-volume concept. Check the selected indicator’s implementation and sign convention rather than assuming that its name establishes trade-by-trade data access.
A Worked Five-Trade Example
The following is a hypothetical sequence, not a reported Apple trading episode. Assume the preceding execution was at $150.20 and all five trades belong to the same observation period.
| Trade | Price | Shares | Direction versus previous trade | Signed contribution |
|---|---|---|---|---|
| 1 | $150.25 | 500 | Up | +500 |
| 2 | $150.15 | 1,200 | Down | −1,200 |
| 3 | $150.30 | 800 | Up | +800 |
| 4 | $150.25 | 300 | Down | −300 |
| 5 | $150.35 | 1,500 | Up | +1,500 |
Uptick volume is 500 + 800 + 1,500 = 2,800 shares. Downtick volume is 1,200 + 300 = 1,500 shares. Net volume is therefore +1,300 shares, while total volume is 4,300 shares.
If you normalize by total volume, 1,300 ÷ 4,300 is approximately 30.2%. This describes the signed difference relative to the total in this example; it does not mean that only 30.2% of the shares had buyers. All shares traded had both counterparties.
Calculate each period consistently. If unchanged trades are excluded from the signed categories but included in total volume, document that choice. Missing observations and a zero denominator also require explicit handling.
Interpret the Sign, Size, and Context Separately
Positive net volume indicates an excess of uptick-classified volume under this method. Negative net volume indicates the opposite. A value near zero can arise from substantial but balanced activity; it does not necessarily mean low total volume or an inactive market.
The absolute reading needs a baseline. +50,000 shares in one instrument is not automatically more informative than +500 in another. Compare the same symbol, data source, session, interval, and calculation. Consider both total activity and the signed difference before assigning importance to a change.
Even within one instrument, a shift from +5,000 to −20,000 is an observation, not a promise of a larger price reversal than a shift to −2,000. Price response and available liquidity still matter.
Data Quality and Trading Hours
- Execution sequence: a tick-direction calculation depends on correctly ordered trade prices and consistent handling of corrections.
- Coverage: confirm which venues and sessions the feed includes. Missing trades cannot be reconstructed from the indicator label.
- Units: shares, contracts, crypto quantities, and tick counts are not interchangeable.
- Session comparison: regular and extended sessions can have different activity patterns. Use equivalent periods when comparing readings.
- Filtering: removing small trades changes the population being measured; it does not automatically isolate institutional or more meaningful activity.
High-frequency and algorithmic trades are part of reported activity, not inherently erroneous data. Distinguish data errors from a deliberate analytical filter. A model that removes trades cannot be assumed to make net volume more accurate without a defined benchmark.
Use Net Volume to Evaluate a Price Setup
Trend and Breakout Conditions
Define the price setup first—for example, a completed close above resistance marked before the breakout. Then choose a net-volume condition over the same decision interval, such as a positive value or a specified comparison with preceding periods.
A breakout with positive net volume does not prove institutional support. A breakout with negative net volume does not establish that it will reverse within one to three sessions. Late-arriving volume also cannot identify retail traders chasing a move.
Be careful with averages of signed values: positive and negative periods can cancel, leaving a near-zero average. A ratio to that average may be unstable or undefined. Decide whether the test uses the sign, an absolute threshold, a historical distribution, or a normalization by total volume.
Hold those choices fixed when comparing outcomes. Relative Volume at Time offers a useful explanation of time-matched activity comparisons, but ordinary RVOL is not automatically a net-volume ratio.
Regular and Hidden Divergence
For swing-based divergence, compare corresponding price and indicator swings using the same definition throughout:
| Candidate pattern | Price swings | Indicator swings | Interpretation to test |
|---|---|---|---|
| Regular bullish | Lower low | Higher low | Possible reversal context |
| Regular bearish | Higher high | Lower high | Possible reversal context |
| Hidden bullish | Higher low | Lower low | Possible continuation context |
| Hidden bearish | Lower high | Higher high | Possible continuation context |
These are hypotheses, not reliable forecasts by definition. A three-to-five-period divergence has no universal advantage. If swing confirmation requires later bars, the signal becomes available after those bars, not at the earlier pivot. Overlapping five-minute and fifteen-minute charts are also related views of the same activity.
Watch for Changing Participation Without Inventing Motives
Suppose a hypothetical stock keeps rising while net-volume readings fall from +30,000 to +15,000, +8,000, and +3,000 shares. The signed excess is declining, but remains positive. This may be a useful condition to investigate; it does not prove that institutions are reducing positions or that a pullback must follow.
Specify the price trigger and invalidation needed to act. An indicator observation and a complete trading rule are different things.
Examine Related Data on LuxAlgo’s Native Charts
LuxAlgo’s native Volume Delta and CVD use footprint buy/sell volume. They provide a related directional-volume view, but should not be labeled an identical implementation of the tick-rule example above.
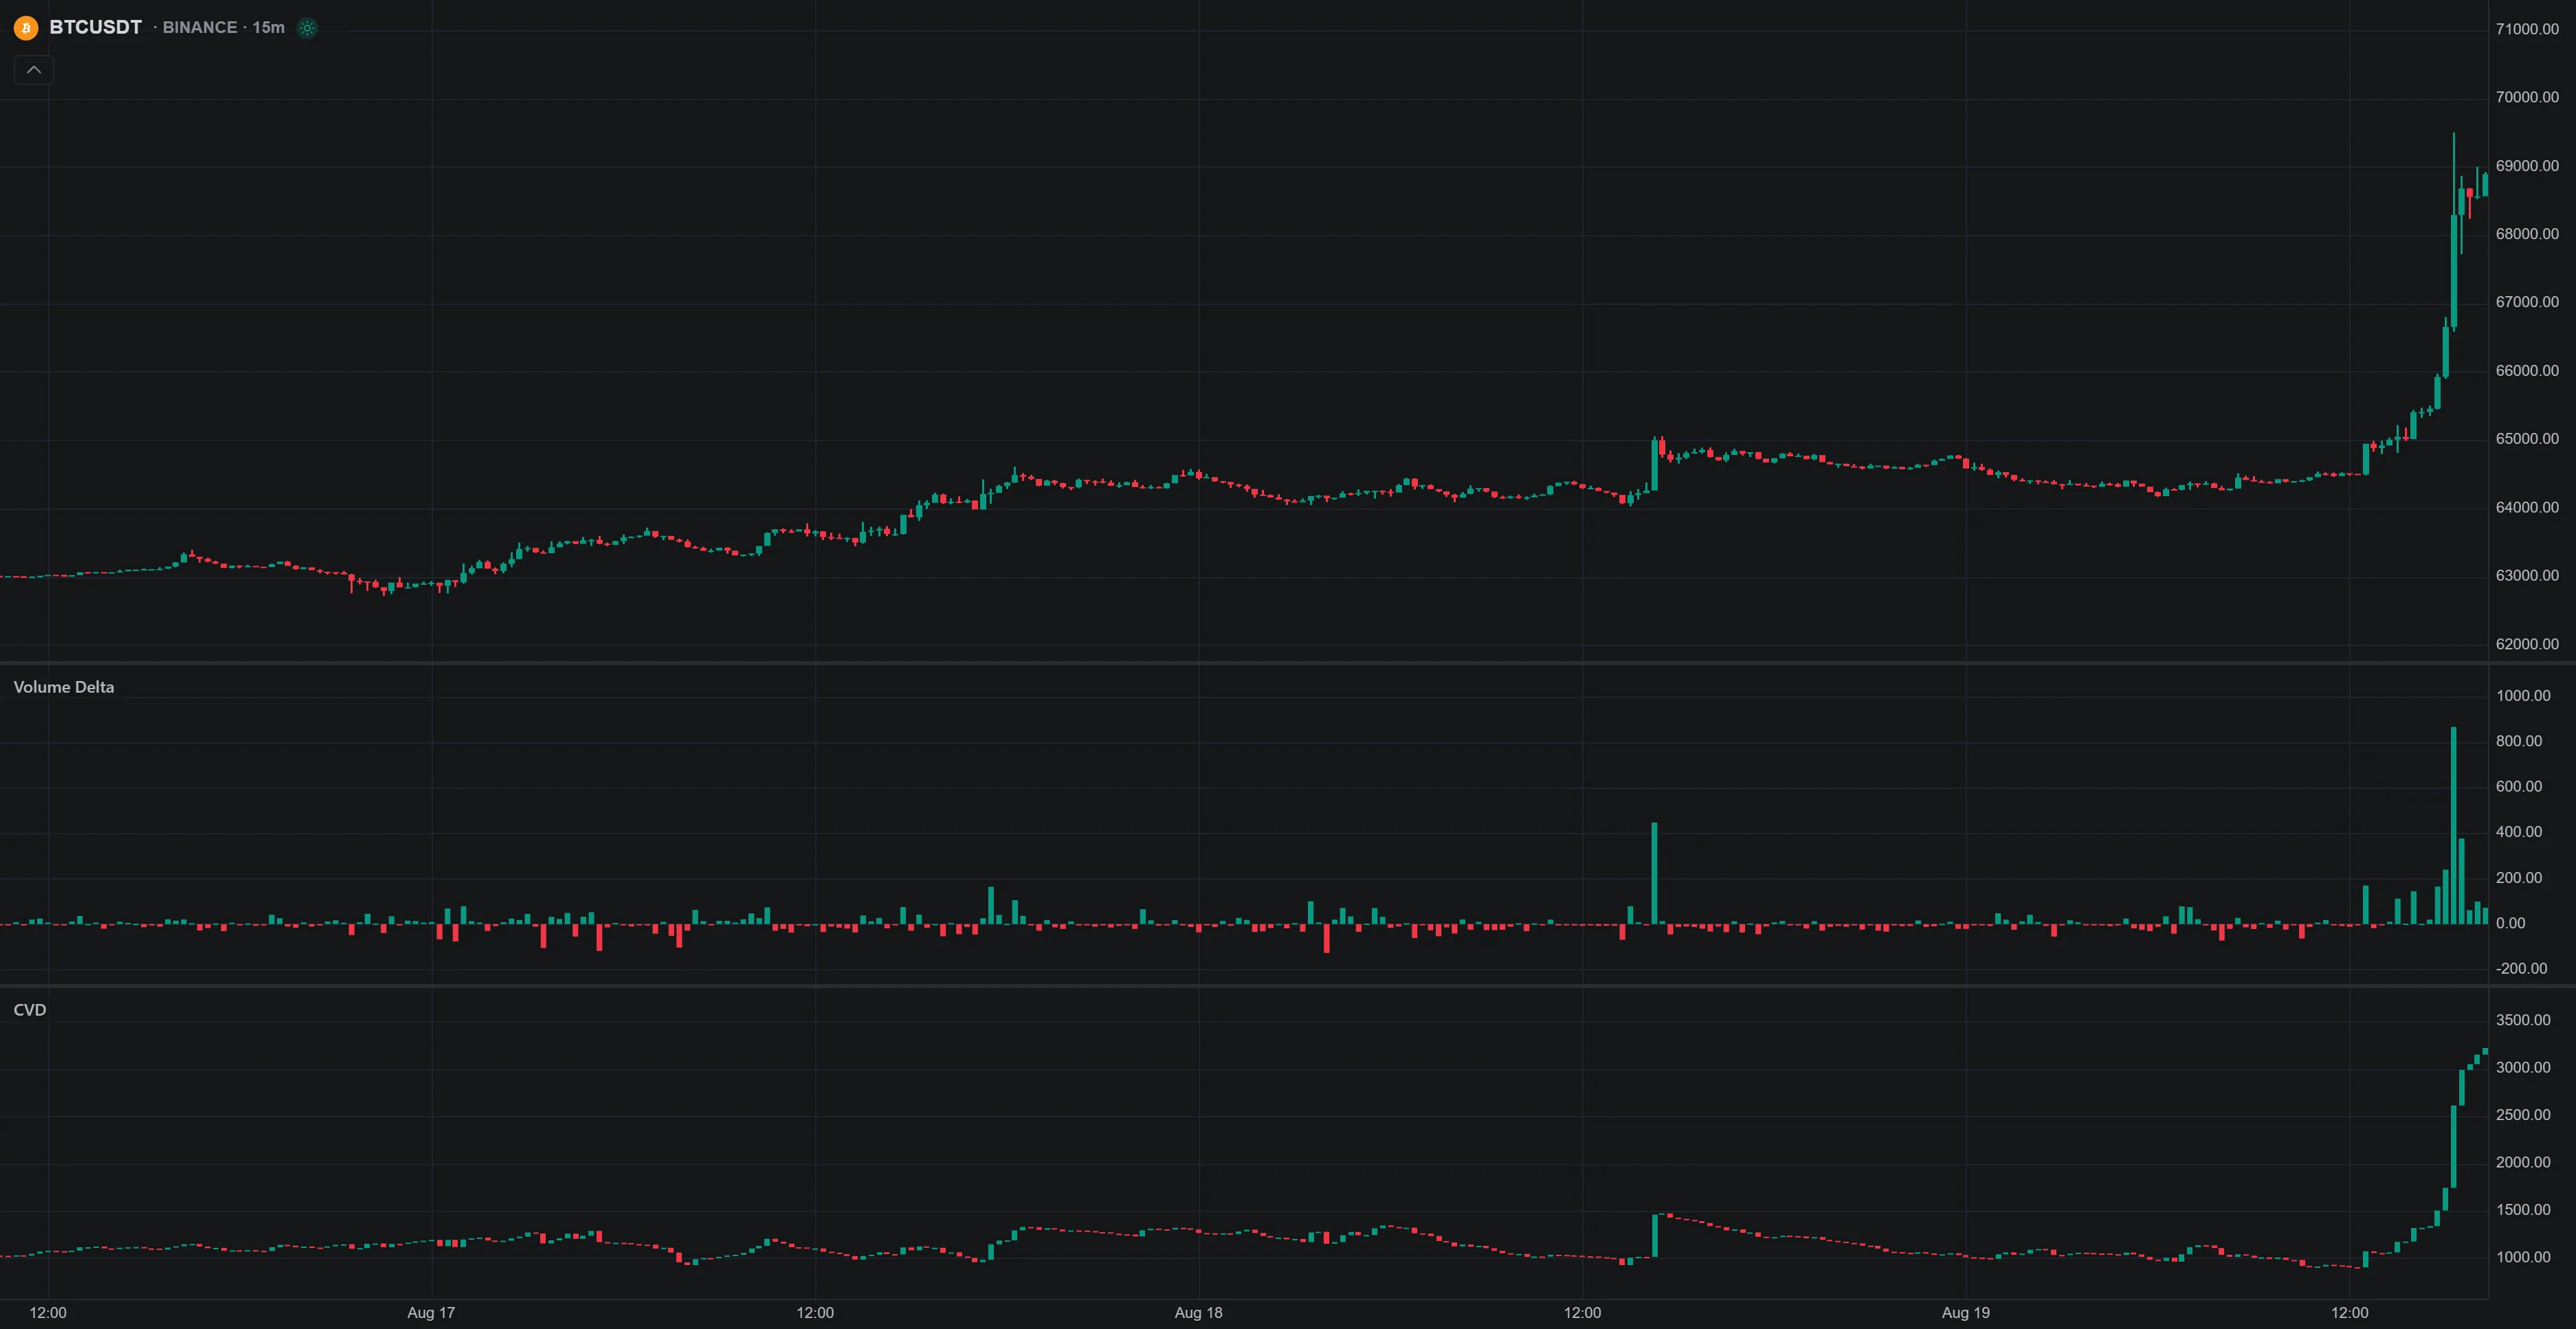
Add these tools from Indicators → Orderflow on a footprint-capable symbol with a fixed-duration chart interval; monthly chart timeframes are unsupported. Total mode compares total buy and sell volume, while Average mode compares average trade size per side and requires trade counts. Check data availability and the selected mode.
CVD accumulates deltas from an anchor, whereas a per-period net-volume series starts a fresh calculation for each period. Keep the accumulation and reset rules explicit.
Build and Test Net-Volume Rules with Quant
- Specify the data. Name the symbol, venue, interval, session, and required classification method.
- Specify the calculation. Include unchanged-price treatment, filters, normalization, and any accumulation.
- Define the trade. Provide the price trigger, entry timing, stop, exit rule, and position sizing.
- Review the implementation. Ask Quant to build the strategy, then inspect the code and sample trades. If execution data is unavailable, identify any candle-based approximation before accepting it.
- Validate the filter. Compare the same price strategy with and without net volume, include costs, and reserve later data for evaluation.
Use native strategy properties and results to account for commission and slippage and inspect net performance, drawdown, and individual trades. A successful code run does not establish a profitable strategy or automatic adaptation to changing markets.
For a hypothetical share trade at $51 with a $49 stop, a $200 risk budget, and $0.10 per-share cost allowance, size is floor($200 ÷ $2.10) = 95 shares, with $199.50 of planned risk. Actual losses can exceed that estimate. Apply the correct point value for other instruments and consider existing exposure, following position-sizing principles.
Combine Tools for a Specific Reason
A moving average can define trend context; RSI can describe momentum; VWAP or a profile can locate a price reference. RSI below 30 is not automatically a buy, and touching a Bollinger Band is not automatically an entry. Bollinger’s own rules explain why band tags need context.
Video: Directional Volume and CVD
This official TradingView tutorial introduces its Volume Delta and CVD tools. It illustrates a related candle-based estimation method, not the trade-by-trade tick calculation used in the worked example.
FAQs
What makes the Net Volume Indicator different from traditional volume analysis when assessing market sentiment?
Total volume describes how much traded. A net-volume calculation subtracts one directional category from another over the selected period. Its meaning depends on the classification method; it does not identify traders, motives, or a guaranteed price direction.
How can I effectively combine the Net Volume Indicator with other tools to enhance my trading strategy?
Assign each tool a defined purpose, such as a price-trend filter or a premarked support level. Compare the same strategy with and without the net-volume condition, including costs and later validation data. Related indicators do not provide independent confirmation simply because they agree.
How can traders ensure accurate Net Volume calculations despite high-frequency and algorithmic trading activity?
Check feed coverage, execution ordering, corrections, volume units, and the direction rule. Algorithmic trades are not inherently data errors. Filtering small or rapid trades changes the measure and must be documented and validated; it cannot be assumed to isolate institutions or improve accuracy.
Read next