Neutral Trading: Profit in Sideways Markets
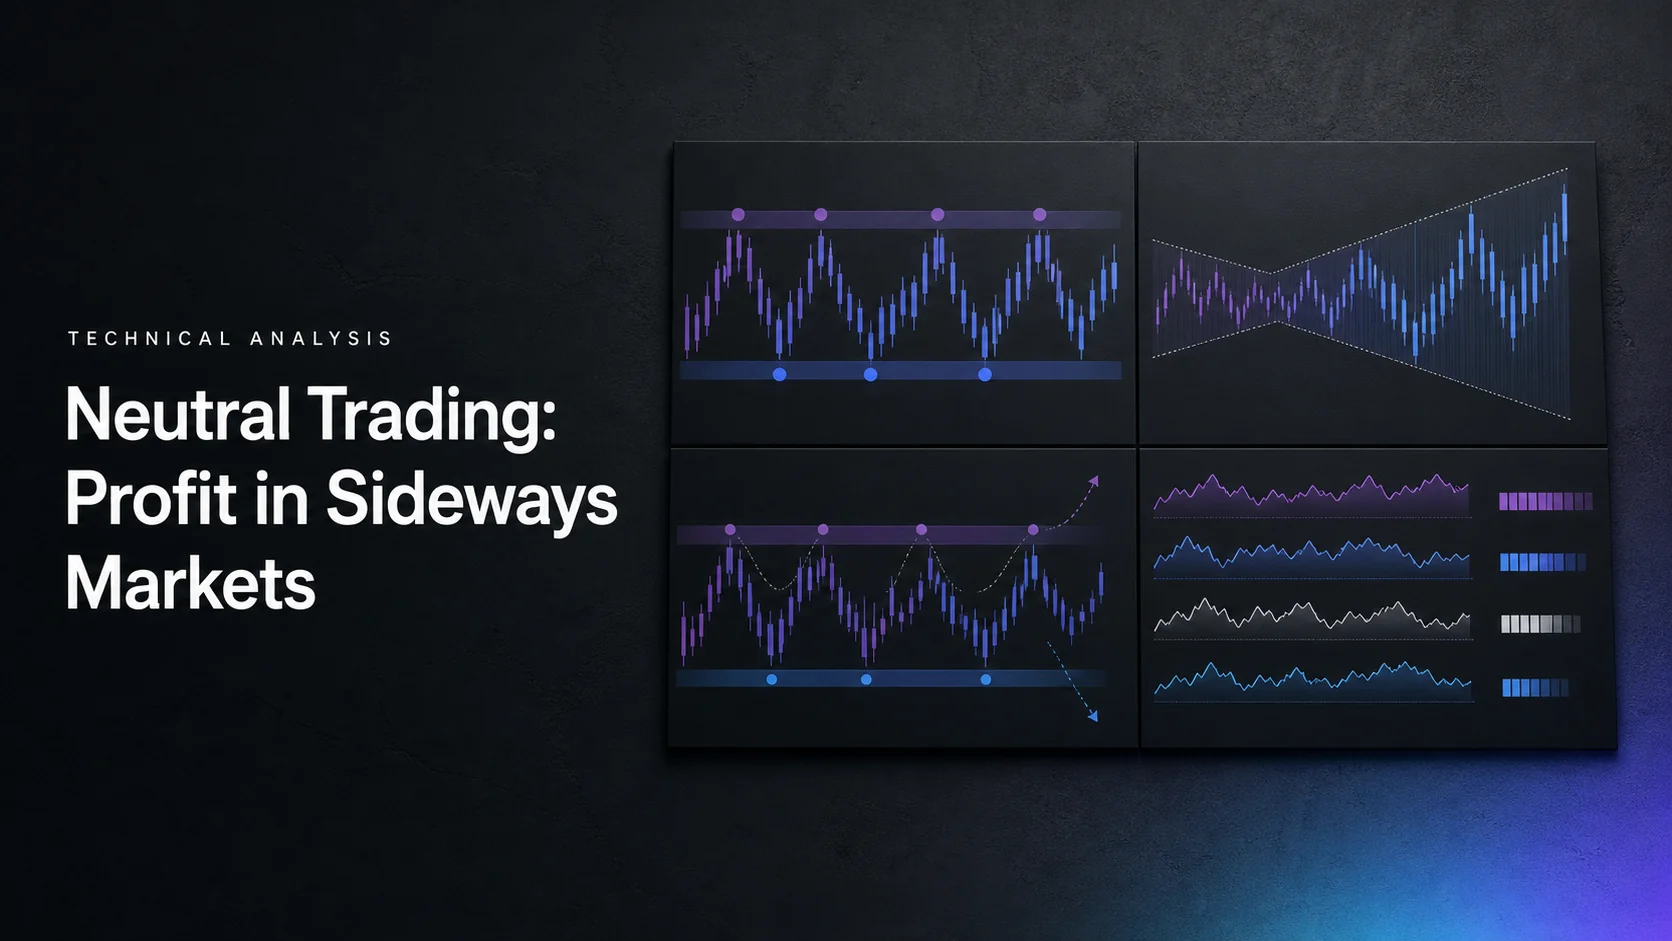
A sideways-market strategy starts with the expectation that price will remain within a defined area for a specified period. That expectation can support range-trading research or certain options structures, but neither approach guarantees profit. A range can break, and an options position can lose value even while the underlying price appears quiet.
Use native LuxAlgo charts to define the range and record the evidence available at each decision. For supported strategy research, ask Quant, our coding agent, to implement explicit rules, inspect the generated code and run it manually. An underlying-price backtest is not automatically an options-spread backtest.
Separate a neutral outlook from a neutral position
Buying near support is still a directional long trade while it is open. Selling short near resistance creates directional short exposure. Alternating between those trades does not make the portfolio market-neutral. Likewise, an options position with approximately zero delta at one moment can develop directional exposure as price, time and implied volatility change.
| Approach | What it attempts to capture | Main exposure |
|---|---|---|
| Range trading | A move from a predefined boundary toward the interior or opposite boundary. | Directional price risk and the possibility that the range fails. |
| Short iron condor | A limited expiration payoff when price remains near the middle strikes. | Price moves, volatility changes, execution and assignment risks. |
| Long calendar spread | Different values and decay rates across option expirations. | Price, volatility term structure, remaining time and changing exposure after the short leg expires. |
Choose the approach before choosing the indicators. A view that an asset will remain between two prices next week does not specify which option premiums are attractive, how a trade should be sized or what happens after a breakout.
Define the range before trading its boundaries
Mark reasonably comparable highs and lows within a stated lookback, then define the upper and lower zones you intend to use. Decide how many observations are required and whether wicks, closes or another rule establish the boundaries. A visually convenient range drawn after several successful bounces can introduce hindsight.
A sideways market does not require constant volume or low volatility. Price can swing widely inside a range, and news can abruptly change its behavior. The StockCharts rectangle guide also notes that a range does not determine its eventual breakout direction.
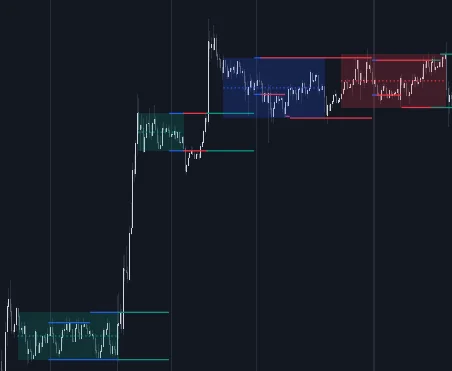
- Time horizon: state whether the setup is intraday, multi-day or longer. A higher-timeframe trend can contain a lower-timeframe range.
- Boundary timing: use only highs and lows already available at the decision. Pivot labels that require later bars cannot be acted on at their earlier plotted location.
- Range width: compare the available movement with spread, fees and the planned stop distance. A narrow-looking chart can offer too little room after costs.
- Expiration of the idea: define when the range is no longer valid, even if no trade has been entered. Do not keep shifting its boundaries merely to preserve a losing thesis.
Repeated touches describe prior reactions, not a promise of future support. A brief wick beyond a zone may fit one strategy’s tolerance and invalidate another’s. State that tolerance in advance so every failed trade is not excused as a “false breakout.”
Use Bollinger Bands and oscillators carefully
Bollinger Bands are relative-price tools
Traditional Bollinger Bands use a moving average and a standard-deviation calculation; 20 periods and two standard deviations are common defaults. The bands describe relative high and low prices under those settings. They are not a 95% forecast interval for the next price, and a normal-return assumption does not turn them into one.
John Bollinger’s rules explicitly warn against statistical assumptions based solely on the standard-deviation calculation. They also distinguish band touches from trade signals: price can keep moving along a band during a trend. Narrow bands identify compression, not certainty that a quiet range will persist.
RSI does not assign the market regime for you
RSI summarizes recent gains and losses under its calculation. Always buying around 40 and selling around 60 is a parameter choice to test, not a reliable definition of a sideways market. Similarly, 30 and 70 do not distinguish every trending market from every range.
Require a separate price condition if the strategy calls for one—for example, a completed return inside a predefined lower zone. Specify exactly when the indicator and price condition are evaluated. Adding MACD or another momentum measure may repeat similar information rather than provide independent confirmation.
Volume can describe participation, but verify what the feed measures. Exchange-specific transactions, consolidated stock volume and tick activity are different inputs. Compare like sessions and completed observations rather than using a partial day against full historical days.
Build a range-trading rule with a failure condition
A simple research template can separate context, trigger and exit. It might identify a range from prior bars, wait for price to approach the lower boundary, require a completed-bar response and exit at a stated target or failure level. Each component should be fixed before evaluating the outcome.
| Decision | Example to specify | What to avoid |
|---|---|---|
| Context | A fixed lookback and measurable upper/lower zones. | Using future highs or lows to improve the range after the fact. |
| Entry | A defined response near a boundary and stated execution timing. | Treating every band or support touch as an automatic fill. |
| Target | The range midpoint or another predefined price. | Assuming price must cross the entire range. |
| Failure | A price or time condition that ends the trade thesis. | Repeatedly widening the range to keep a losing position open. |
| Review | All qualifying trades, costs and unsuccessful signals. | Showing only attractive historical bounces. |
Selling an existing long position near resistance and opening a new short position are different actions. Shorting introduces borrowing and other product-specific risks. If a backtest permits both directions, verify that its sizing, stops and execution assumptions are correct for each.
Position value is different from planned risk
In a hypothetical share trade, suppose entry is $51, the planned stop is $49.50 and the target is $54. A $170 budget reserving $20 for estimated costs leaves $150 of price risk. Dividing $150 by $1.50 gives 100 shares, with $5,100 of position value. Reaching $54 would earn $300 gross; a gap and fill at $48 would lose $300 before costs.
A stop at 1.5 times the entire range and a stop just outside the boundary are not equivalent rules. Choose a defensible failure level first, then size the position for its distance. A tighter stop is not automatic protection against false breakouts; it can increase the frequency of small exits.
The SEC stop-order bulletin explains that a stop-market trigger does not guarantee the execution price, while a stop-limit order can remain unfilled. Include gaps, spreads, event exposure and related positions in the risk plan. An account-risk percentage is a budget choice, not a universal safe setting.
Iron condors: understand the expiration payoff
A conventional short iron condor combines a short put spread with a short call spread on the same underlying and expiration. The farther-out long options bound the idealized spread payoff. Before costs, the maximum gain is the net credit; with equal wing widths, the maximum expiration loss is one wing’s width minus that credit, multiplied by the contract multiplier.
The Options Industry Council guide describes the structure and its risks. Changes in implied volatility and price affect the position before expiration. American-style short options can be assigned early, and expiration uncertainty can leave stock exposure. The intact expiration diagram does not capture every consequence of closing legs separately or mishandling assignment.
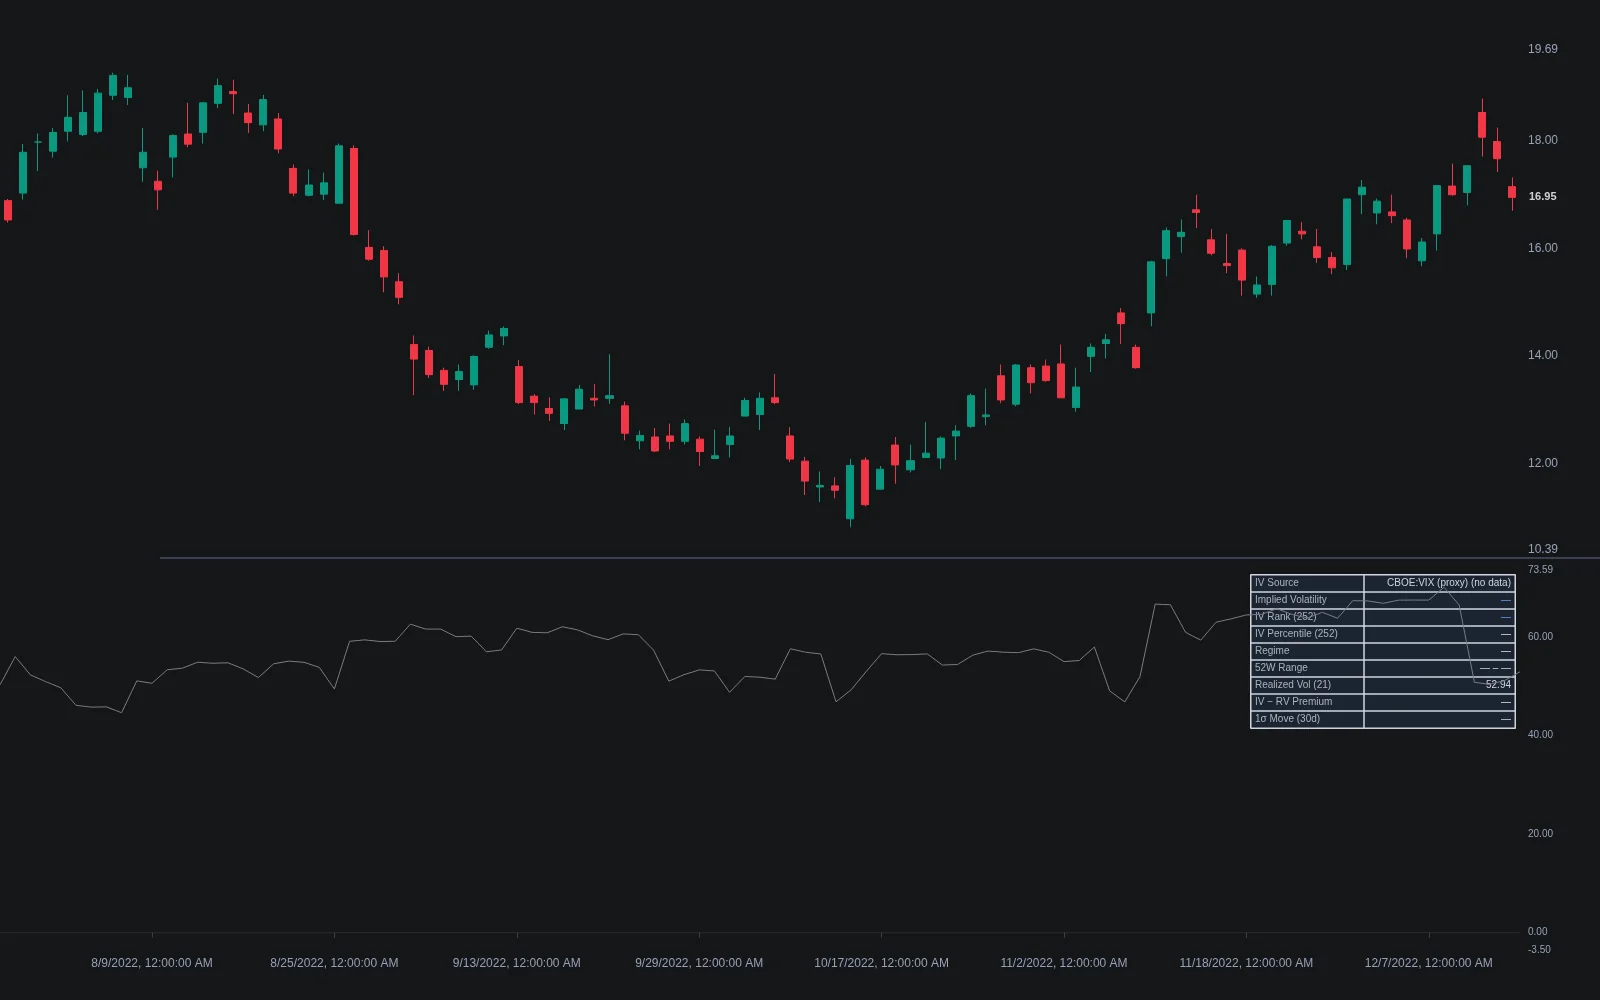
Hypothetical credit and risk calculation
Assume an underlying near $100 and one standard 100-share-multiplier contract per leg, all with the same expiration: buy the $90 put, sell the $95 put, sell the $105 call and buy the $110 call. Suppose the combined net credit is $1.20 per share. These are hypothetical inputs, not current quotes or a recommendation.
- Maximum gross gain: $1.20 × 100 = $120, when the options expire with the underlying between the short strikes under the payoff assumptions.
- Maximum expiration loss: ($5 − $1.20) × 100 = $380 before costs, with both protective wings intact.
- Expiration breakevens: $95 − $1.20 = $93.80 and $105 + $1.20 = $106.20.
- Example at $108: the short call spread is worth $3 per share at expiration, producing ($1.20 − $3) × 100 = −$180 before costs.
A range on the underlying chart does not ensure that a particular credit is available or worthwhile. There is no universal required credit as a percentage of wing width. Evaluate the quoted prices, bid/ask spreads, contract specifications, commissions and management plan. The numerical maximum assumes the complete structure is maintained and settled as modeled.
Calendar spreads: time decay is only part of the story
A long call calendar generally buys a farther-dated call and sells a nearer-dated call at the same strike for a net debit. Its value near the first expiration depends on the underlying price and the remaining option’s time value and implied volatility. It cannot be summarized by the same fixed expiration trapezoid as an iron condor.
The OIC long call calendar guide explains the changing exposure: if the near-term short call expires worthless, the remaining long call is a directional position whose value can erode with time. Different expirations can have different implied volatilities. Early assignment and exercise decisions also matter.
Do not assume an at-the-money strike always offers the best trade or that the short leg must be rolled exactly two weeks before expiration. Define whether to close the whole position, roll a leg or retain the longer option, including the cost and exposure of that decision. A roll closes one contract and opens another; it does not erase an existing loss.
Keep underlying tests separate from options tests
Native LuxAlgo charts can support research into the underlying range and supported indicators. That does not establish access to a historical options chain, multi-leg execution, volatility surfaces or exercise modeling. An underlying price staying inside a zone is not proof that an iron condor or calendar would have been profitable.
- For an underlying strategy, specify range construction, trigger, stop, target, size and decision timing.
- Ask Quant, our coding agent, to implement the supported rule set. Inspect the generated code for future information and unintended boundary updates.
- Run the strategy manually. Review inputs and properties, including capital, quantity and applicable costs.
- For an options strategy, use an environment with the required historical option prices and contract mechanics. Verify fills, multi-leg costs, settlement and assignment assumptions.
- Evaluate later periods that were not used to choose the parameters. Include breakouts, volatile ranges and failed signals, not only calm periods.
Review and refine without fitting every outcome
Keep a record of the range visible at entry, the chosen settings, actual fills and the reason for exit. For options, also record each leg, expiration, credit or debit and the intended management decision. A screenshot alone omits much of the information needed to reproduce the trade.
Track the number of alternative lookbacks and thresholds tried. Repeatedly selecting the best historical combination can fit noise. Judge a proposed change against a consistent baseline and unseen observations, and record unsuccessful attempts rather than silently replacing them.
A useful no-trade rule can exclude conditions the process cannot handle—for example, inadequate liquidity or missing data. Define the rule before evaluating results. Quiet recent prices do not remove the need to plan for a sudden regime change.
Video: Bollinger Bands and RSI examples
This recorded tutorial illustrates a Bollinger Bands and RSI approach. Its test-count and performance statements are the creator’s claims, not independently validated results for your market. Use it to examine the proposed rules, then apply the data, timing and cost checks above.
Frequently asked questions
Is range trading market-neutral?
Not necessarily. A long or short trade inside a range remains directional while open. Market-neutral or delta-neutral describes exposure, not simply a sideways price forecast.
Do Bollinger Bands contain the next price with 95% probability?
No. Their standard-deviation calculation does not establish a forecast probability. Band touches are also not standalone buy or sell signals.
Is RSI near 40 always a buy and near 60 always a sell?
No. Those are thresholds to test within an explicit strategy. RSI alone does not establish that a market is range-bound or that a reversal will occur.
What is the maximum loss on an equal-width iron condor?
For the intact same-expiration structure, the idealized expiration loss is one wing’s width minus the net credit, multiplied by the contract multiplier, before costs. Assignment, separate leg management and residual positions require additional attention.
Does a calendar spread profit automatically from time decay?
No. Its result depends on price, different expirations’ implied volatilities, remaining time and management. After a short call expires, the remaining long call has different directional and decay exposure.
Can an underlying-price backtest validate an options spread?
No. An options test needs the relevant historical option prices, contract specifications, costs and execution or assignment assumptions. A chart-based range test answers a different question.
References
- John Bollinger — Bollinger Band Rules; parameter defaults, band touches and statistical interpretation.
- StockCharts ChartSchool — Rectangle; range boundaries and breakout uncertainty.
- Options Industry Council — Short Condor (Iron Condor); option legs, expiration payoff and assignment risks.
- Options Industry Council — Long Call Calendar Spread; differing expirations, volatility and changing position exposure.
- SEC — Stop, Stop-Limit, and Trailing Stop Orders; execution-price and non-fill risks.
- LuxAlgo — Native Charts, Making Strategies and Strategy Settings; supported research, code inspection and manual testing.
- Bollinger Bands and RSI tutorial — video; recorded educational example.
All numerical trade and options examples are hypothetical. The references explain concepts and mechanics; they do not establish a profitable strategy or current executable prices.
Read next