OTC Stocks Explained: Risks and Rewards of Over-the-Counter Trading
Over-the-counter, or OTC, trading is any trade in a security that happens off a stock exchange. The Financial Industry Regulatory Authority, FINRA, which oversees US broker-dealers and runs the facilities that record these trades, draws a distinction that most articles blur: exchange-listed stocks can and do trade OTC every day through alternative trading systems and wholesalers, while unlisted equities, the ones people usually mean by "OTC stocks", trade only OTC because they do not or cannot meet an exchange's listing standards. This guide explains that structure using FINRA and the US Securities and Exchange Commission as sources, why a company is unlisted, where the trade data and the company data actually live, the risks the SEC spells out for microcap stocks and the red flags it lists for fraud, how a pump-and-dump is built, and what a disciplined trader does about limit orders, position size and volume. It also covers where Quant Charts, LuxAlgo's charting and AI platform, fits: its US equity data comes from an exchange venue, so the tools apply to exchange-listed stocks, including the low-priced listed names FINRA says fraudsters increasingly target, where relative volume, order types and Quant's Backtest Summary can test what chasing a spike actually does.
Key points:
- OTC is a venue, not a category. Listed stocks trade OTC for anonymity or price; unlisted equities trade OTC because they have no exchange listing, and the two carry very different disclosure.
- Information is the real risk. The SEC says the biggest difference between a microcap and other stocks is how little reliable public information exists, and Rule 15c2-11 limits quotes for companies without current financials.
- Volume is the mechanism. In thin stocks any size trade can move the price, which is what makes both liquidity risk and manipulation possible.
- The checklist is public. The SEC's red flags, from trading suspensions to reverse splits and unsolicited tips, are the due diligence, not an afterthought to it.
What OTC Trading Is
FINRA's overview of over-the-counter equities trading starts from the definition: OTC trading generally refers to any trading that takes place off an exchange, across stocks, bonds, currencies and derivatives, and it is a very large part of the market. For equities there are two cases. Exchange-listed stocks may trade on the exchange or OTC; institutions making large trades often prefer an OTC venue for pre-trade anonymity and price stability, since a block placed on an exchange can move the market against them, and even small retail orders in listed stocks frequently execute through alternative trading systems, single-dealer platforms or wholesalers when the firm believes it can get a better price there. Unlisted equities, by contrast, trade only OTC. The SEC's market participants page defines the plumbing: broker-dealers, which may trade against their own inventory or match customers, and alternative trading systems, which meet the legal definition of an exchange but operate under an exemption that requires them to register as broker-dealers and comply with Regulation ATS.
Why a Stock Is Unlisted
A company must meet an exchange's requirements for its stock to trade there, and FINRA gives the common reasons a stock does not. Some companies cannot meet thresholds such as the number of publicly traded shares or the minimum price per share. Others were listed and then delisted for failing to keep meeting the standards, a group that often includes companies seeking bankruptcy protection. And American Depositary Receipts, certificates representing shares in a foreign company, may trade as OTC equities rather than on an exchange, including ADRs of large global companies that have chosen not to list in the US. That last point is why "OTC" is not a synonym for "tiny": the unlisted market holds shells with no operations and multinationals that simply never sought a US listing, and nothing about the venue tells you which one you are looking at.
The SEC's Microcap Stock Basics bulletins add the size vocabulary. Microcap, sometimes called penny stock, applies to companies with market capitalisations below roughly $250 million to $300 million, and many are far smaller; below $50 million the term is nanocap. Many microcaps trade OTC, with quotes available from broker-dealers or on systems such as Global OTC ATS and OTC Link ATS, the latter run by OTC Markets Group, whose site names its quotation tiers OTCQX, OTCQB, OTCID and Pink Limited. The SEC notes that companies quoted OTC may have to meet the minimum criteria a trading system imposes for a tier, and that Rule 15c2-11 restricts broker-dealers and market makers from publishing quotations for OTC stocks whose issuers have not made current financial information publicly available. The tier a stock sits in is therefore a disclosure signal worth reading, but it is the system's classification, not an exchange listing.
Where the Data Lives
Two different kinds of information matter, and they live in different places. Trade data is well covered. FINRA explains that OTC trades in exchange-listed stocks must be reported to a FINRA Trade Reporting Facility and appear on the consolidated tape alongside exchange trades, while transactions in OTC equities must be reported to the FINRA OTC Reporting Facility for real-time public dissemination; FINRA also publishes aggregate OTC volume and notices of corporate actions, halts and other events. Company data is where the gap opens. A US-listed company must file regular reports and financial statements with the SEC, available free on the EDGAR database. An OTC equity issuer may or may not be required to file; some do, some publish financials through other channels, and some publish nothing, which FINRA says can leave information about earnings, debt and operating expenses limited or incomplete. The SEC's research bulletin gives the fallback sources: ask the company whether it is SEC-registered and files reports, check EDGAR, contact your state securities regulator, consult banking regulators for bank issuers, check the state of incorporation for good standing, and review the OTC Markets site, while never using unsolicited emails, message boards or press releases as the sole basis for a decision.
| Question | Exchange-listed stock | Unlisted OTC equity |
|---|---|---|
| Where can it trade? | On the exchange or OTC through ATSs, wholesalers and dealers | Only OTC |
| Listing standards | Must meet and keep meeting exchange requirements such as share count and minimum price | None from an exchange; a quotation system may set tier criteria, and Rule 15c2-11 limits quotes without current financials |
| Trade reporting | Exchange trades plus OTC trades reported to a FINRA TRF, on the consolidated tape | Reported to the FINRA OTC Reporting Facility in real time |
| Company disclosure | Regular SEC reports and financial statements on EDGAR | May or may not file with the SEC; information can be limited or incomplete |
| Typical liquidity | Generally deeper | Often thin; FINRA warns you may not find a buyer when you want to sell |
The Risks the SEC Names
The third microcap bulletin lists five risks, and each follows from the structure above. Lack of public information makes a stock more vulnerable to fraud and makes it less likely that quoted prices rest on full and accurate information. No minimum listing standards means companies may have no assets, operations or revenues. Lack of liquidity means you may be unable to sell when you want, or that your sale will move the price noticeably. High volatility means large price changes in short periods, which is dangerous in combination with the liquidity problem. And fraud is easier precisely because information is scarce and volume is thin, so both price and volume can be manipulated. The first bulletin puts the mechanics in one sentence: because many microcap stocks trade in low volumes, any size trade can have a large percentage impact on the price. That single fact is the reason limit orders, small position sizes and volume analysis are not optional in this market.
The same bulletin's red flags are specific enough to use as a checklist. An SEC trading suspension, which the Commission can impose for up to ten days when it believes current and accurate information about a company is lacking, is a matter of public record. Heavy stock promotion by email, text or social media, especially when the stock is promoted more than the product, is a warning. So are unexplained increases or decreases in price or volume, projections of large future revenue from a company with no operational history, officers and promoters owning most of the stock or controlling it through convertible instruments, frequent changes of company name or business line, dormant shell companies that keep trading, companies that went public through a reverse merger, recent reverse stock splits, particularly alongside a reverse merger, unsolicited recommendations, and brokers who will not provide written information about what they are selling. The bulletin's closing advice is to check the background of anyone recommending the stock, check whether the offering is registered with the SEC or your state, and pay particular attention to financial statements that are not audited.
How a Pump-and-Dump Works
FINRA's article on pump-and-dump scams, updated in September 2026, describes three stages. In the setup, fraudsters choose a target, historically a low-priced microcap on the OTC market with little public information, though FINRA reports increasingly seeing low-priced stocks listed on national exchanges targeted as well, and quietly accumulate a large share of the public float through public and private offerings so that the price is easier to move. In the pump, they promote the stock, claiming imminent bullish news or citing hot-topic initiatives, and where the pitch used to arrive by cold call it now often arrives as an unsolicited text or a social-media advertisement for an "investment club" that leads to an encrypted group chat; a slower, forum-driven version is called a ramp-and-dump. Rising prices draw in other buyers, including momentum traders reacting only to the advance. In the dump, the fraudsters sell, and the crash can happen in seconds, too fast for other holders to get out. The lesson for a chart reader is that a price rising on promoted volume looks, on the chart, exactly like a breakout until it does not, and the difference is in the information around it, not in the candles.
Trading It, If You Trade It
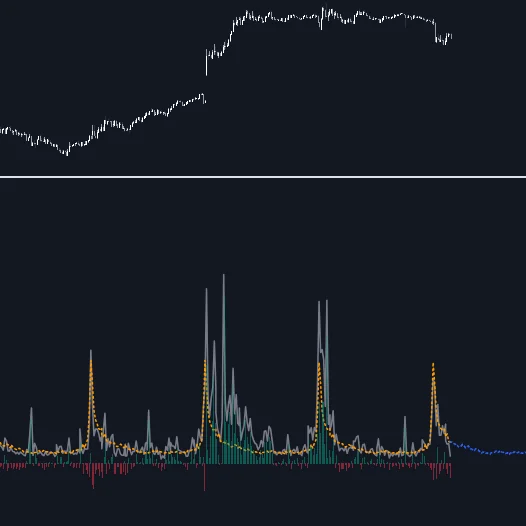
Nothing here is advice to trade unlisted stocks; the SEC calls microcaps among the most risky investments and FINRA's summary is that "know before you invest" is hard to live up to for non-reporting companies. If you do, the discipline follows from the mechanics. Use limit orders: the Library's order types entry explains that a market order buys fill certainty by giving up price certainty, which in a wide-spread, thin stock means paying whatever the other side asks, while a limit order protects the price at the risk of not filling, the acceptable failure for an entry. Size by risk, not by conviction: the sizing bases entry describes fixing the dollar loss at the stop before the position is chosen, and notes that a small position with a wide stop can risk more than a large one with a tight stop, which matters when the stop itself may be gapped through. Cap the sequence, not just the trade: loss-control rules such as a daily loss limit or a consecutive-loss breaker bound the damage of a run of bad promoted names. And read volume as a multiple of normal: the relative volume entry expresses today's volume as a multiple of the symbol's own norm, so a stock trading at ten times its usual participation with no filing to explain it is displaying the SEC's "unexplained increase in trading volume" red flag in numerical form.
Where Quant Charts Fits
Quant Charts is a charting and analysis platform, not a source of company filings or OTC quotation data, and its coverage needs stating plainly. The data documentation lists Cboe EDGX, an exchange venue, as the source for US equities, alongside crypto venues, with forex, commodities and CME futures on paid plans. That means the platform's US stock data is exchange data; whether a particular low-priced or thinly traded ticker is available is a Symbol Search question, and unlisted OTC equities should not be assumed to be covered. What that leaves is still the part of this market where most retail money is at risk. FINRA's warning that pump-and-dumps increasingly target low-priced exchange-listed stocks describes names Quant Charts does chart, with candles, volume and, for US equities, pre-aggregated footprints of real trades.
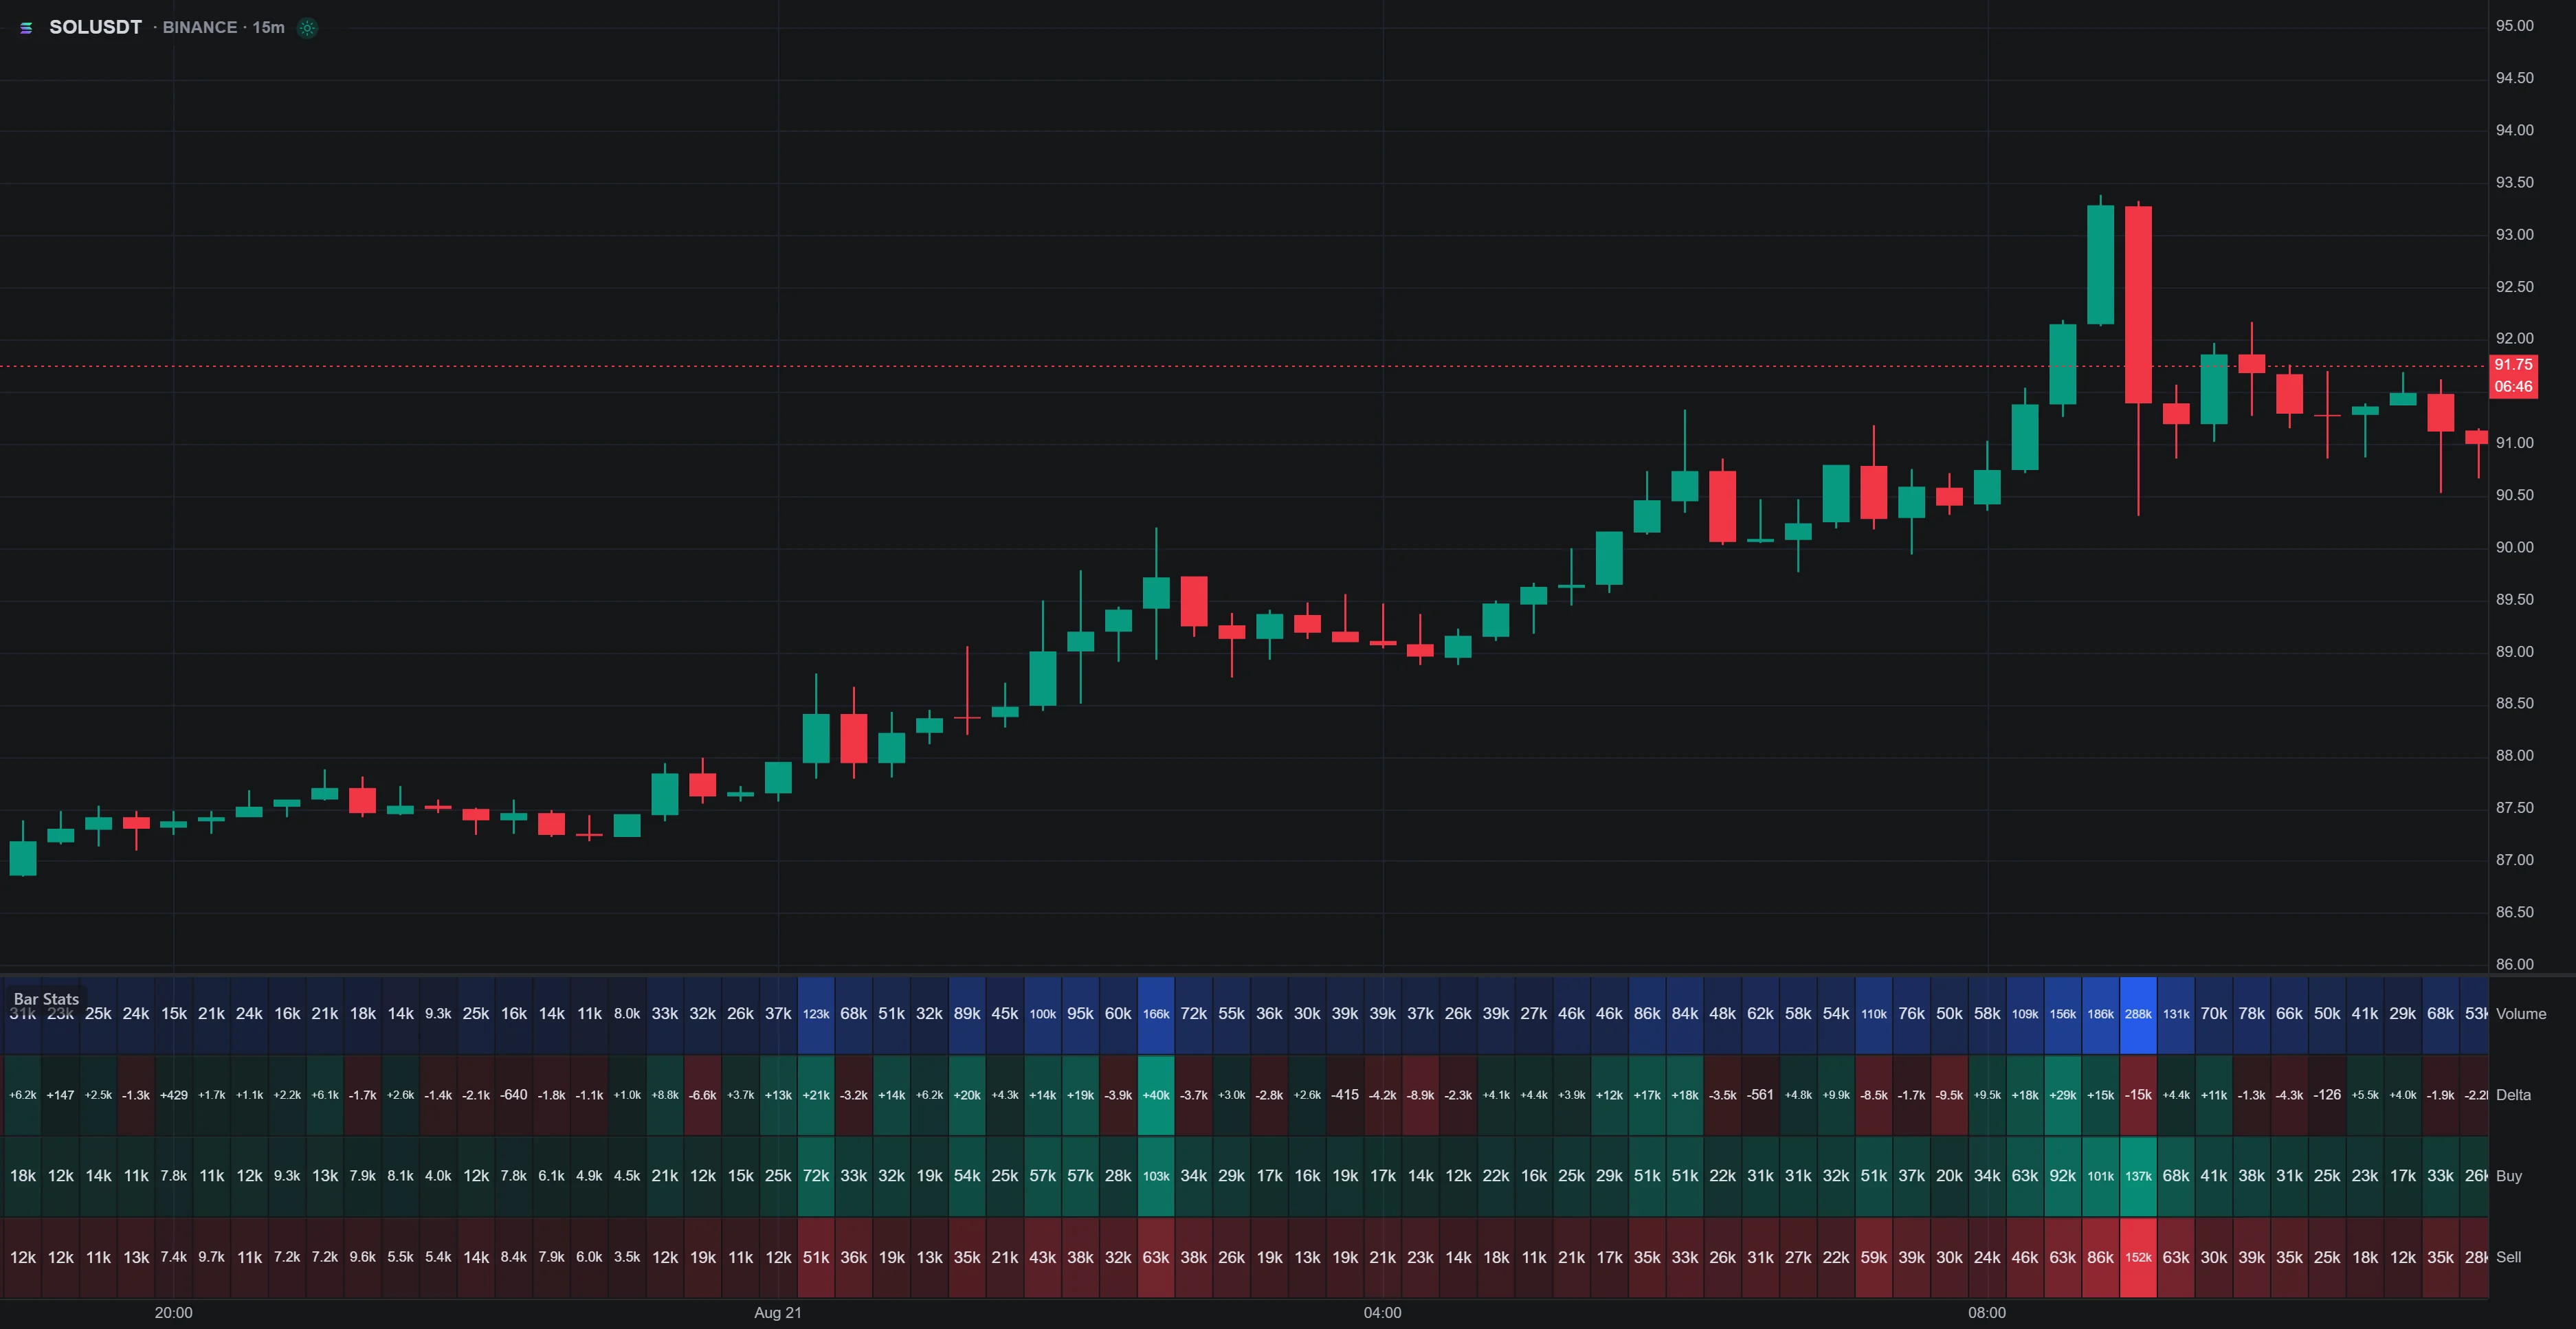
On those names the tools do the reading the SEC asks for. Bar Stats lists volume, delta and trade counts for each candle under the chart, so a spike's composition is visible: a surge in volume with few trades and one-sided delta reads differently from broad participation. Volume Surprise and the Library's volume spike entry put the unexplained-volume flag on the chart as a number rather than an impression. The Watchlist keeps the names you are watching beside the chart with price, change, volume, market cap and 52-week range, which is the quickest way to see that a stock up several hundred percent from its low is a stock other people have been promoted into.
The most useful thing Quant Charts can do for a would-be penny-stock trader is run the test most never run. Describe the rule you are tempted by to Quant in plain language, for example buy a stock the day after it closes up more than 50 percent on volume above five times its 20-day average, hold five days, stop 20 percent below entry. Quant writes the Pine Script as a strategy, you inspect it under Code and click Run on a low-priced listed stock's daily chart, and the Backtest Summary reports net profit, trade count, win rate, maximum drawdown and profit factor across the chart's history, with commission and slippage set in the strategy Properties; set the slippage generously, because a wide spread is a cost the backtest will otherwise ignore. Run it on several such names, not one, and read the drawdown line as closely as the profit line. Then, if you trade live, tag those trades in the Journal and let Breakdown compare their P&L with the rest of your book. Chasing spikes is a rule like any other, and it can be measured before it is paid for.
Where Each Tool Stops
FINRA and the SEC are the sources for how OTC trading works, what a company must disclose and what the red flags are; EDGAR, state regulators and the quotation system's own tier flags are where the company facts live. Your broker sets what you can trade and how orders route. Quant Charts charts exchange-sourced US equities and crypto with volume and order-flow tools, keeps a Watchlist and Journal, and lets Quant write and backtest a rule with the Backtest Summary; it does not carry OTC quotation tiers, filings or promotion flags, coverage of thinly traded tickers is a Symbol Search question, and it places no orders. The LuxAlgo platform does not place orders for you; it is a charting platform.
Conclusion
OTC is where trades go when they do not go to an exchange, and for unlisted equities it is the only place they can go. Everything that follows, the thin liquidity, the volatility, the manipulation, traces back to two facts the regulators state directly: the company may not have to tell you anything, and any size trade can move the price. Read the SEC's red flags as a checklist, treat promotion as a warning rather than a tip, and if you trade at all use limit orders, size by the loss at the stop and cap your losing streaks. For the listed low-priced names that now draw the same schemes, Quant Charts shows the volume that gives the game away and, through Quant's Backtest Summary, shows what chasing it has cost before you pay for the lesson yourself.
Key Takeaways
- OTC trading is off-exchange trading; listed stocks trade OTC for anonymity or price, while unlisted equities trade only OTC and may have no SEC reporting obligation.
- The SEC defines microcaps as companies below roughly $250 million to $300 million in market value and ranks them among the riskiest investments for lack of information, liquidity and listing standards.
- Red flags include SEC trading suspensions, heavy promotion, unexplained price or volume moves, insider control, reverse mergers, reverse splits and unsolicited tips.
- Pump-and-dumps run setup, pump and dump, increasingly through encrypted group chats and increasingly on low-priced exchange-listed stocks.
- Quant Charts covers exchange-sourced US equities: use relative volume, Bar Stats, limit-order and sizing concepts, and Quant's Backtest Summary to test a spike-chasing rule before trading it.
FAQs
What is an OTC stock?
Over-the-counter trading is trading that happens off an exchange. Exchange-listed stocks also trade OTC through alternative trading systems and wholesalers, but an "OTC stock" usually means an unlisted equity that trades only OTC because the company does not meet, or has lost, an exchange listing. Its quotes appear on systems such as OTC Link ATS, run by OTC Markets Group, and Global OTC ATS.
What is a microcap or penny stock?
The SEC applies "microcap stock", sometimes called a penny stock, to companies with market capitalisations below roughly $250 million to $300 million, and "nanocap" to those below $50 million. Many trade OTC, often with little reliable public information and low volume, which the SEC says makes them among the most risky investments and easier to manipulate.
What are the main risks of OTC stocks?
The SEC lists lack of public information, no minimum listing standards, lack of liquidity, high volatility and fraud. FINRA adds that OTC issuers may or may not file reports with the SEC, so information can be limited or incomplete, and that you may not find a buyer when you want to sell. Because volume is thin, any size trade can have a large impact on the price.
How do I spot a pump-and-dump?
FINRA describes a setup in which fraudsters accumulate a low-priced stock's float, a pump using promotion by social media, texts and encrypted "investment club" chats, and a dump that can crash the price in seconds. The SEC's red flags include trading suspensions, heavy promotion, unexplained price or volume changes, insider control, reverse mergers, reverse splits and unsolicited recommendations.
Does Quant Charts cover OTC stocks?
Quant Charts sources its US equity data from Cboe EDGX, an exchange venue, alongside crypto venues, so its stock coverage is exchange data; availability of any thinly traded ticker is a Symbol Search question and unlisted OTC equities should not be assumed to be covered. It carries no OTC quotation tiers, filings or promotion flags and does not place orders.
How can I test a penny-stock trading idea?
Describe the rule to Quant on Quant Charts, for example buying the day after a large gain on volume far above average with a fixed stop; it writes a Pine Script strategy, and after you inspect the code and click Run the Backtest Summary reports net profit, trade count, win rate, max drawdown and profit factor with commission and slippage set in Properties. Run it across several low-priced listed names and read the drawdown as closely as the profit.
References
LuxAlgo Resources
- Quant Charts
- Quant Charts data and venues
- Bar Stats
- Watchlist
- Quant: making strategies and the Backtest Summary
- Journal Breakdown
- Library concept: relative volume
- Library concept: volume spike
- Library concept: order types
- Library concept: sizing bases
- Library concept: loss-control rules
- Library: Volume Surprise
External Resources
- FINRA: A Look at Over-the-Counter Equities Trading
- FINRA: Pump-and-Dump Scams
- SEC Investor Bulletin: Microcap Stock Basics, Part 1: General Information
- SEC Investor Bulletin: Microcap Stock Basics, Part 2: Research
- SEC Investor Bulletin: Microcap Stock Basics, Part 3: Risk
- SEC Investor.gov: Market Participants
- OTC Markets Group
Read next