Paul Tudor Jones — Macro Playbook for Traders

Paul Tudor Jones II founded the Tudor Group in 1980, and the firm describes its flagship strategy as discretionary and quantitative global macro. Jones is the best-known living practitioner of a style that reads official economic data, central bank decisions and the relationships between asset classes, then expresses a view in whichever market offers the best payoff for the risk. This guide is a playbook for that style rather than a biography. It sets out what a macro trader reads and when it is published, why a long moving average is used as a defensive rule, how the arithmetic of asymmetric payoffs lets a trader be wrong more often than right, how positions are sized so that being wrong is survivable, and how to run the routine in Quant Charts. Jones's own principles are paraphrased from the public record; nothing here is a quotation, and nothing is investment advice.
What a Macro Trader Reads
Macro trading begins with a calendar. The data that moves rates, currencies and equity indices is published by government agencies on fixed schedules, and the releases are the events around which positions are built or cut.
- Inflation. The Bureau of Labor Statistics describes the Consumer Price Index as a measure of the average change over time in prices paid by urban consumers for a market basket of goods and services, and the Producer Price Index as the average change in selling prices received by domestic producers for their output. Both are monthly, with the next release date posted on each program's page.
- Employment. The BLS Current Employment Statistics program produces monthly estimates of nonfarm employment, hours and earnings from a survey of roughly 119,000 businesses and government agencies. The headline payroll change and average hourly earnings are the figures markets react to.
- Growth. The Bureau of Economic Analysis publishes gross domestic product quarterly, in an advance estimate followed by revisions, and its release page states the annualized real growth rate and its contributors.
- Policy. The Federal Open Market Committee holds eight regularly scheduled meetings a year, at which it reviews conditions and sets the stance of monetary policy; the Federal Reserve publishes the calendar in advance. Its H.15 release reports selected interest rates daily, including Treasury constant-maturity yields.
- Positioning. The Commodity Futures Trading Commission's Commitments of Traders report shows open positions by category of trader in futures markets. The CFTC's history of the report notes it has been weekly since 2000 and is released on the third business day after its as-of date.
The point of the calendar is not to forecast each print. It is to know when the market's assumptions will be tested, so that risk is sized for the test.
| Release | Source | Frequency | What it moves first |
|---|---|---|---|
| Consumer Price Index | Bureau of Labor Statistics | Monthly | Short-term rates, the dollar, rate-sensitive equities |
| Producer Price Index | Bureau of Labor Statistics | Monthly | Inflation expectations, margins |
| Employment Situation | Bureau of Labor Statistics | Monthly | Rates, dollar, equity indices |
| Gross Domestic Product | Bureau of Economic Analysis | Quarterly, with revisions | Growth expectations, cyclical sectors |
| FOMC statement and projections | Federal Reserve | Eight scheduled meetings a year | The whole curve, then everything priced off it |
| Commitments of Traders | CFTC | Weekly | Positioning context for futures markets |
Reading Markets Together
The second habit is reading asset classes as one system. The Library's intermarket analysis entry describes the framework John Murphy codified: bonds tend to turn before stocks and stocks before commodities, the dollar tends to move inversely to commodities, and ratios such as copper against gold serve as growth proxies. The entry is equally clear about the caveat. The stock-bond correlation was positive through the inflationary decades, negative through the disinflationary 2000s and 2010s, and shifted again when inflation returned, so the textbook relationships are hypotheses to verify in current data, not laws.
Two rate series anchor the picture. The yield curve entry explains the 2s10s and 3m10y spreads and why inversion is regime information rather than an entry signal. The real yields entry explains inflation-adjusted Treasury yields as the opportunity cost of every other asset, which is why gold and long-duration equities are watched against them. Sentiment adds a third layer: the put/call ratio entry describes the contrarian read of options volume, with extremes defined relative to the series' own history rather than fixed thresholds.
The intermarket entry's procedure is the practical version of this: chart the market you trade beside its natural counterparts, express relationships as ratios, measure rolling correlations of returns over a window matched to your horizon, and look for divergence at the turns, when the anchor market makes a new high while its confirming markets stall.
The Defensive Rule: A Long Moving Average
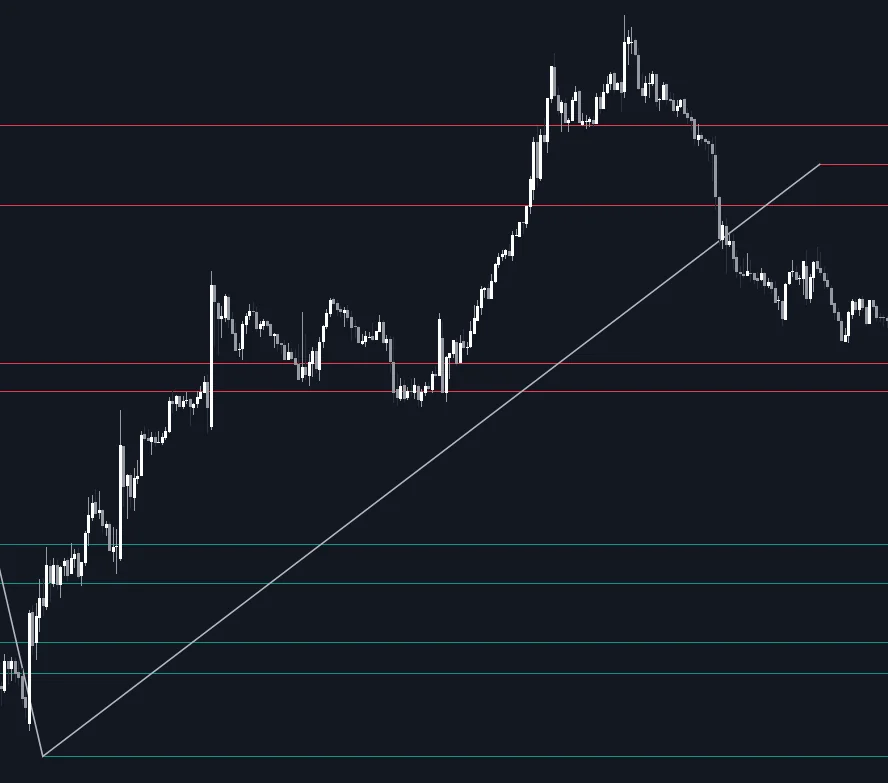
Jones is widely associated with using the 200-day moving average of closing prices as a defensive filter: below it, he has said in interviews, he plays defense and gets out. The rule's logic is in the Library's SMA entry. A simple moving average is the mean of the last N closes, and the 200-day version condenses roughly ten months of sessions into one line of long-term trend context. Decades of use have made it an institutional convention, so reactions near it can be partly self-fulfilling, and the entry notes its standard role as a trend filter that gates which direction a system is allowed to trade.
The entry is also frank about the cost. A moving average lags by roughly half its window on a steady trend, and price crosses the 200-day routinely in choppy markets, so a filter built on it will produce false exits. The golden cross entry makes the same point about the 50-day crossing the 200-day: it confirms that a trend has turned only after a substantial move has already happened. A defensive rule accepts that lag in exchange for never holding a full position through the largest declines, which is a trade-off to test rather than assume.
The Arithmetic of Being Wrong Often
The principle most often attributed to Jones is that a trade should offer several dollars of potential gain for each dollar risked, so that a low hit rate is still profitable. The Library's win rate entry gives the formula: the breakeven win rate equals one divided by one plus the reward-to-risk ratio, before costs. At 1:1 that is 50 percent; at 2:1 about 33 percent; at 3:1, 25 percent. Extending the formula, a 5:1 payoff breaks even at a win rate of one in six, about 16.7 percent, so a trader who is right one time in five is ahead before costs. That is the arithmetic behind the idea that a macro trader can be wrong most of the time.
Two Library entries keep the arithmetic honest. The expectancy entry defines the number that matters as win rate times average win minus loss rate times average loss, and warns that a high win rate can still lose money when the occasional loss is large. The R-multiple framework expresses each outcome as a multiple of the risk taken at entry, so a 5:1 target is a +5R trade and a stopped trade is -1R, and a journal of R-multiples shows whether the targets are actually being reached. A 5:1 payoff that is rarely captured, because price reverses at +2R, has a very different expectancy from one that is.
Sizing So That Being Wrong Is Survivable
The other half of the risk discipline associated with Jones is a small, fixed fraction of capital at risk per trade. The Library's fixed fractional entry describes the method: risk the same fraction of current equity on every trade and back-solve size from the stop distance, so that dollar risk shrinks through a losing streak. Because a low hit rate means long losing streaks are normal, the entry's arithmetic matters: ten consecutive 1 percent losses leave about 90.4 percent of the account, which is recoverable, while the same streak at 5 percent per trade is not.
Investor.gov's definition of a stop order is the execution side of the rule. A stop becomes a market order once the stop price trades, and the fill can differ from the stop price in a fast market. Macro positions held through a data release or a central bank decision face exactly that risk, so the sizing has to assume a worse fill than the stop. The drawdown statistics entry supplies the test of whether the whole system works: maximum drawdown, its duration and the recovery factor, which together describe the experience the trader has to be able to sit through.
Where Quant Charts Fits
The intermarket circuit in one layout. Quant Charts' multi-chart layout puts the anchor market beside its counterparts. Every plan includes US equities and ETFs from Cboe EDGX, which covers index, Treasury, gold and commodity ETFs, plus crypto spot and perpetuals; Premium, Ultimate and Ultra add forex, commodities and CME futures as candles. A layout with an equity index ETF, a long-Treasury ETF, a gold ETF and the dollar index is the intermarket check the Library describes, and the Intermarket Swing Projection indicator redraws a second market's swing structure on the active chart so the two can be compared on one axis.
The 200-day rule as a backtest. Describe the rule to Quant, our coding agent, in plain language, for example holding an index ETF only while it closes above its 200-day simple moving average and standing aside below it. Quant writes the Pine Script; open Code to inspect it, then click Run. The Backtest Summary reports net profit, trade count, win rate, max drawdown and profit factor, and the comparison that matters is max drawdown against buying and holding the same ETF over the same period. Commission and slippage belong in the strategy's Properties.
The video below shows how indicators are added to a chart in Quant Charts.
The payoff arithmetic as a backtest. A second strategy can test the asymmetric-payoff idea directly: enter on a defined signal with a stop at one ATR and a target at five, and let the Backtest Summary report the win rate the rule actually achieved against the 16.7 percent breakeven. The docs are explicit that a metric with few trades behind it is noise, which is the usual finding with wide targets, and that is itself useful information.
The Journal keeps the R-multiples. Every plan includes the Journal, which turns broker fills or imported trades into round trips and breaks results down by symbol, side, hold time and time of day. Recording each trade's risk at entry lets the realized R-multiple distribution be compared with the planned 5:1, which is the only way to know whether the asymmetry exists outside the plan. No LuxAlgo tool places orders; the Journal records trades made elsewhere.
FAQs
Who is Paul Tudor Jones?
Paul Tudor Jones II founded the Tudor Group in 1980. The firm describes itself as a global investment adviser whose flagship strategy employs discretionary and quantitative global macro and equity strategies. He is widely regarded as one of the best-known discretionary macro traders.
Why do macro traders watch the 200-day moving average?
The Library's SMA entry describes the 200-day average as the most watched long-term trend benchmark and an institutional convention, used as a filter that gates which direction a system may trade. It lags by design and is crossed often in choppy markets, so it is a defensive rule rather than a timing signal.
What win rate does a 5:1 payoff need to break even?
The Library's win rate entry gives the breakeven rate as one divided by one plus the reward-to-risk ratio. At 5:1 that is one in six, about 16.7 percent, before commissions and slippage. Real trading needs a margin above that.
Which official data releases matter most to macro traders?
Monthly CPI, PPI and employment data from the Bureau of Labor Statistics, quarterly GDP from the Bureau of Economic Analysis, the eight scheduled FOMC meetings a year, and the weekly CFTC Commitments of Traders report for futures positioning. Each agency publishes its release calendar in advance.
What is intermarket analysis?
Reading currencies, bonds, stocks and commodities as one linked system, as John Murphy codified it. The Library's entry stresses that the relationships change with regime, so current correlations are measured over rolling windows rather than assumed.
How does Quant Charts support a macro playbook?
Multi-chart layouts hold the anchor market beside Treasury, gold and dollar proxies available as US ETFs on every plan, with futures and forex on paid plans. Quant backtests a 200-day filter or an asymmetric-payoff rule and reports win rate, max drawdown and profit factor, and the Journal records realized R-multiples.
References
LuxAlgo Resources
- Intermarket Analysis, Yield Curve, Real Yields and Put/call Ratio concepts (LuxAlgo Library)
- SMA, Golden Cross, Win Rate, Expectancy, R-multiple Framework, Fixed Fractional and Drawdown Statistics concepts (LuxAlgo Library)
- Intermarket Swing Projection indicator (LuxAlgo Library)
- Data, Making strategies with Quant, Reading a strategy backtest and Journal (LuxAlgo Docs)
External Resources
- Tudor Group
- Consumer Price Index, Producer Price Index and Current Employment Statistics (Bureau of Labor Statistics)
- Gross Domestic Product (Bureau of Economic Analysis)
- Federal Open Market Committee, FOMC meeting calendars and H.15 Selected Interest Rates (Federal Reserve)
- Commitments of Traders and About the COT Reports (CFTC)
- Stop Order (Investor.gov)
This article is educational and is not investment advice. The principles attributed to Paul Tudor Jones are paraphrased from the public record; the Tudor Group has not endorsed this article.
Read next