Position Trading with 200-Day Moving Average
The 200-day moving average is a long-horizon trend filter for position trading. It smooths daily prices and gives you a consistent reference for studying entries, exits and market exposure. It reacts to historical data, so it can lag turning points and generate repeated signals when price moves back and forth around it.
This guide uses the 200-day simple moving average (SMA) unless stated otherwise. A price above the average, a rising average and a 50/200-day crossover are different conditions. Define which one your strategy uses, then test realistic fills, costs and risk rather than assuming the line predicts the next move.
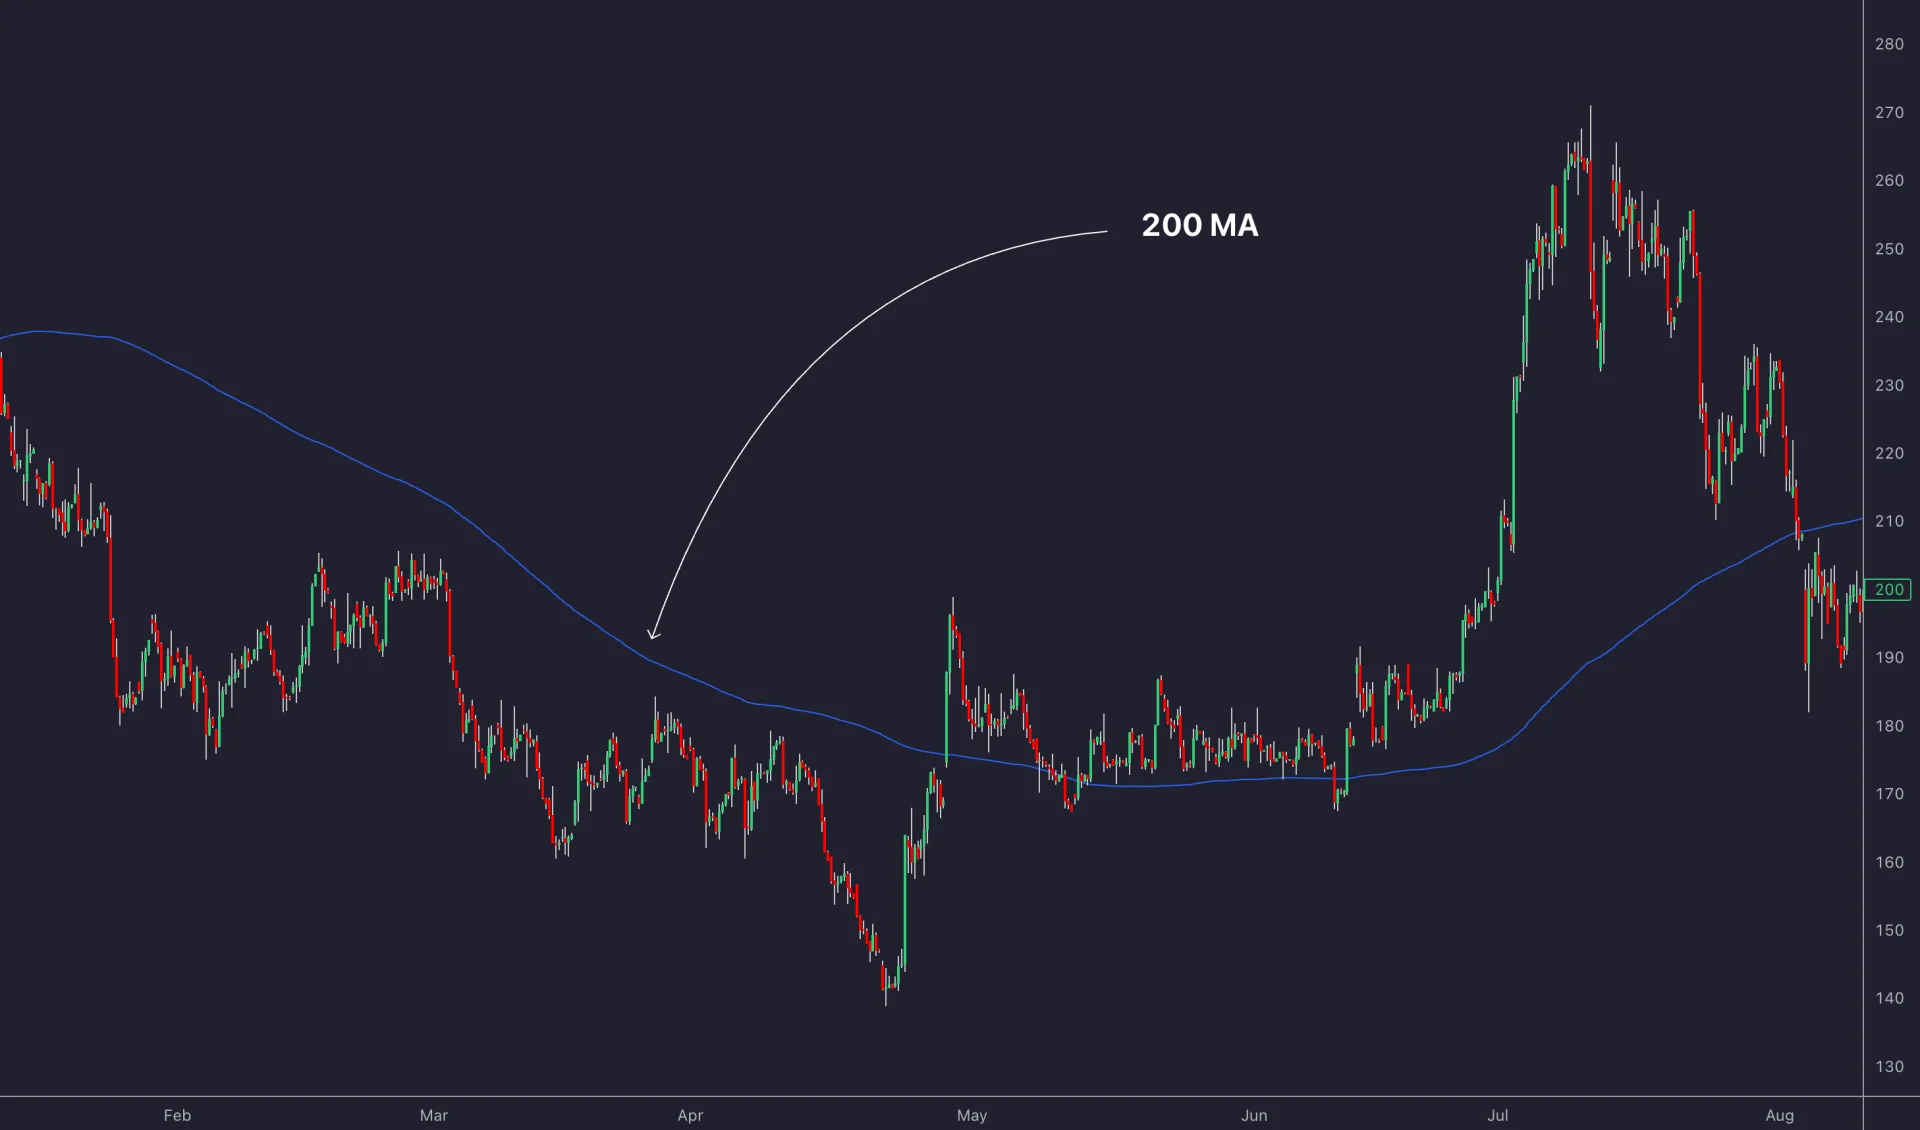
Calculate the 200-Day Average Correctly
Add the latest 200 completed daily closing prices and divide by 200. When the next daily close becomes available, drop the oldest close and add the newest. For the SMA, every observation has equal weight. An exponential moving average (EMA) uses different weighting and initialization, so a 200-day EMA is a different strategy input.
| Setting | For a 200-day SMA | Why it matters |
|---|---|---|
| Timeframe | Daily bars, with a defined session and timezone | 200 five-minute or hourly bars are not 200 days. |
| Length and source | 200 observations of the chosen daily close series | Changing close to another price source changes the calculation. |
| History | At least 200 daily observations before the first full SMA value | A newly listed asset may not have enough data. |
| Price treatment | Consistent split/dividend adjustment and data feed | Corporate actions and differing feeds can change historical signals. |
| Decision time | After the daily close when the rule requires a completed bar | An intraday value can move before that day finishes. |
For equities, 200 trading sessions span roughly nine to ten calendar months, depending on holidays. “About 40 weeks” is only a rough five-session-week shortcut. For continuously traded crypto markets, 200 daily bars span 200 calendar days under the selected daily boundary. A 40-week SMA of weekly closes is not numerically equivalent to averaging 200 daily closes.
Worked Rolling-Average Example
Suppose the latest 200 closes total 20,000, so the SMA is 100. The oldest close is 90 and the next completed close is 110. The updated sum is 20,000 − 90 + 110 = 20,020, giving a new SMA of 100.10. Its one-day change is (110 − 90) ÷ 200 = 0.10.
That identity explains why the SMA’s slope depends on the new close relative to the observation dropping out, not simply on whether today’s price rose from yesterday. Specify slope explicitly, such as today’s completed SMA exceeding its value five sessions earlier, if your rule needs more than one day of change.
Read Price Location, Slope and Distance Separately
| Observation | What it tells you | Limit |
|---|---|---|
| Close above the SMA | Price is above its trailing daily average | The average itself may still be falling. |
| Close below the SMA | Price is below its trailing daily average | A rebound can begin before the average turns upward. |
| Rising SMA | The selected average value increased over your comparison window | The change is backward-looking and may respond slowly. |
| Repeated crossings | Price is moving around the filter | Multiple entries and exits can accumulate costs. |
| Large price-to-SMA distance | Price is extended relative to its trailing average | Distance alone does not establish a stronger or safer trend. |
Calculate percentage distance as 100 × (close ÷ SMA − 1). A close of 110 with an SMA of 100 is 10% above the average. That describes location, not the probability of continuation. Compare distance with the instrument’s usual volatility and the entry’s stop distance rather than treating a larger gap as a better trade.
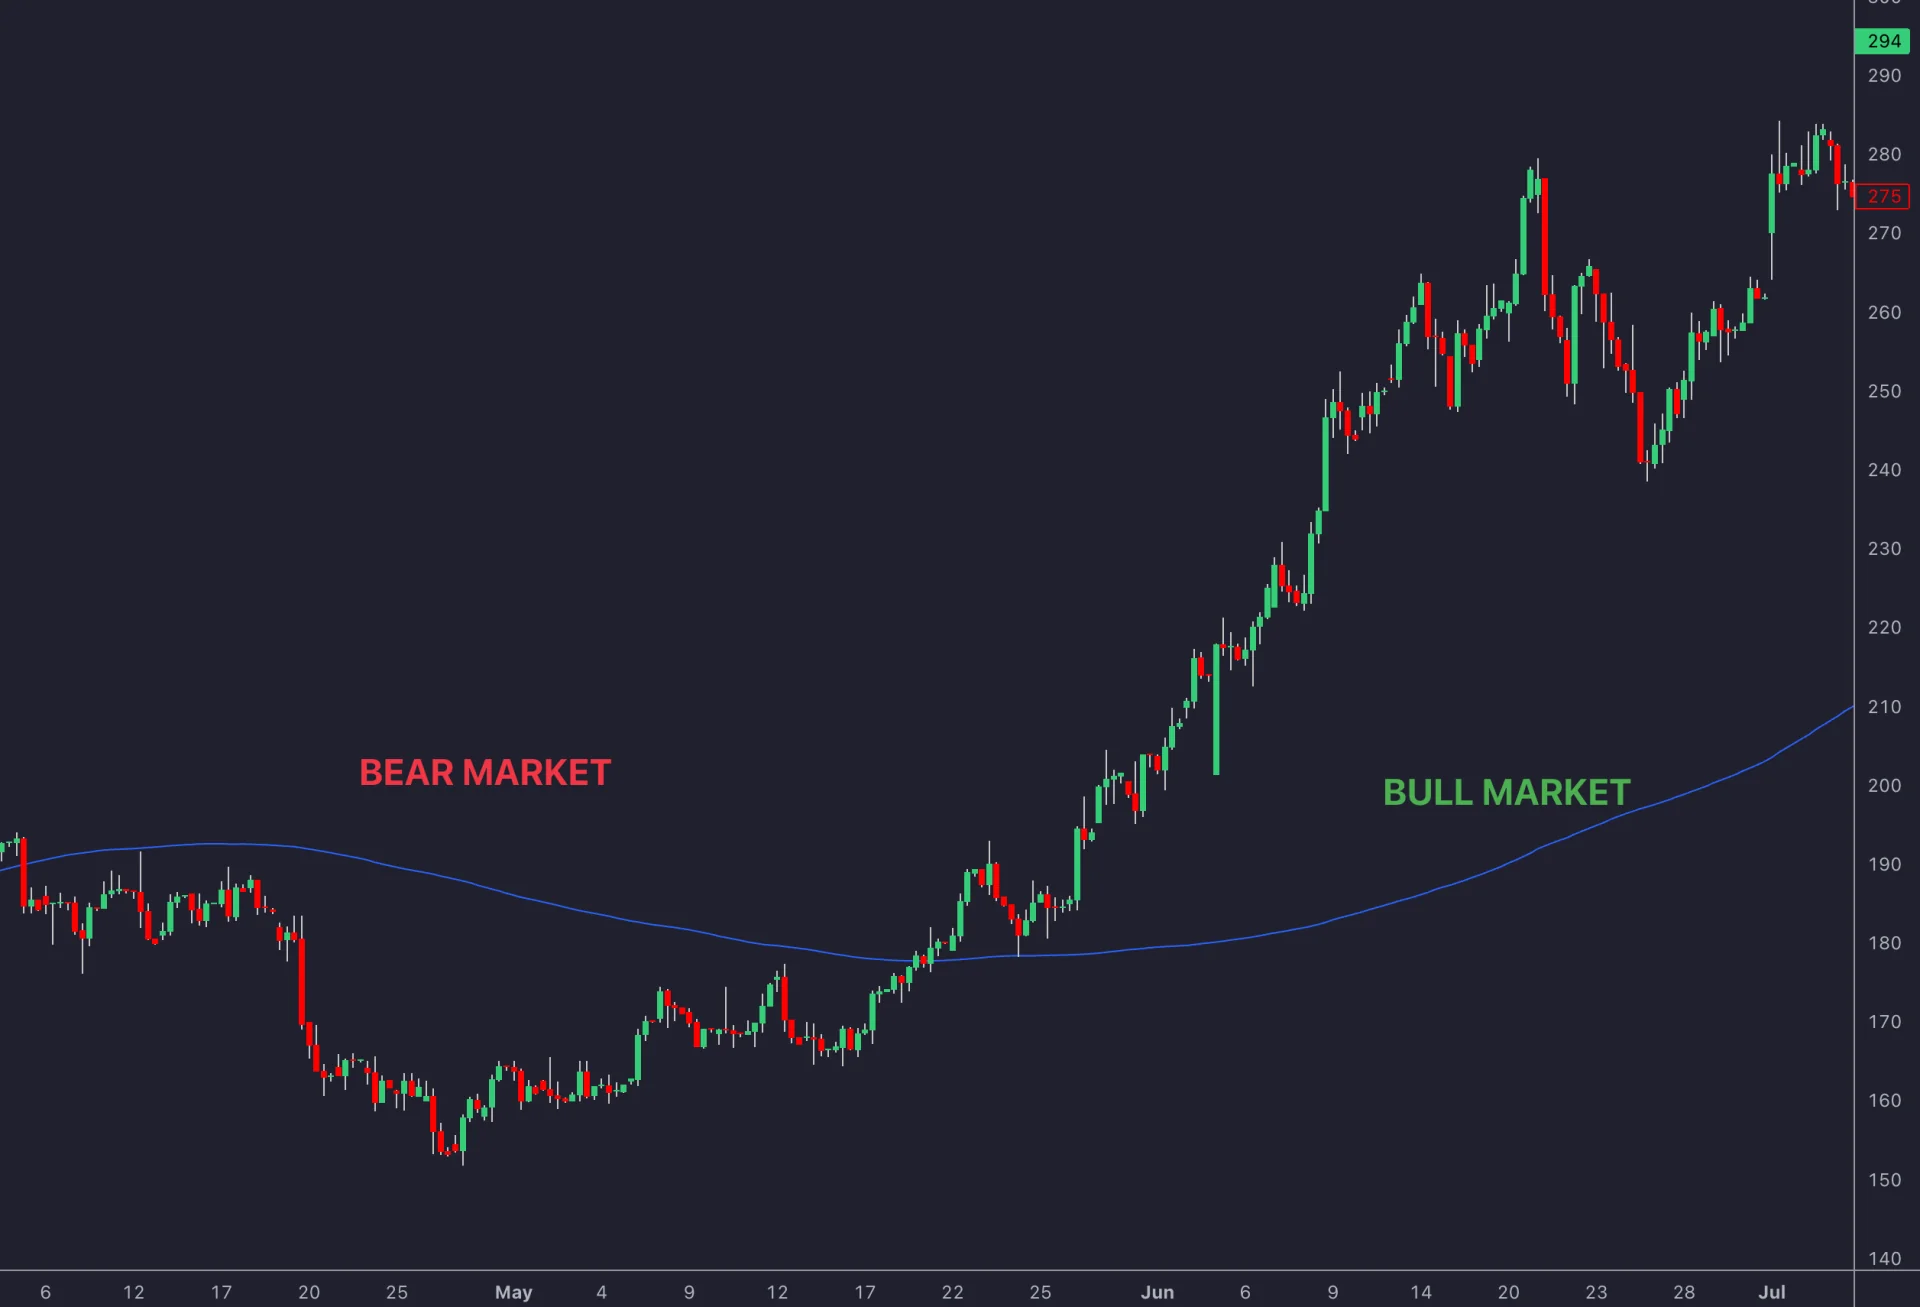
The average may provide a useful area to investigate a pullback or rejection, but it is not a physical barrier. Price can cross it repeatedly or gap through it. Treat support and resistance around the line as a hypothesis that requires defined price behavior, not an automatic order.
Three Position-Trading Approaches to Test
1. Price Crossing the 200-Day SMA
A simple long/cash rule enters after a completed daily close crosses from at or below the SMA to above it, then exits after a completed close crosses below. Decide how ties are handled and whether orders use the next session’s available price. A close-based signal does not automatically permit a fill at the same close after that value is already known.
Also specify the initial state. If your test starts with price already above the SMA, do you enter immediately or wait for a new crossing? Record what happens to capital while out of the position, including any modeled cash return. Going to cash and initiating a short position are different strategies.
2. Golden and Death Crosses
A golden cross commonly means the 50-day SMA crosses above the 200-day SMA; a death cross reverses that relationship. To test the event, compare both today’s and yesterday’s completed values. The condition “50-day above 200-day” can remain true for many days after the actual crossing.
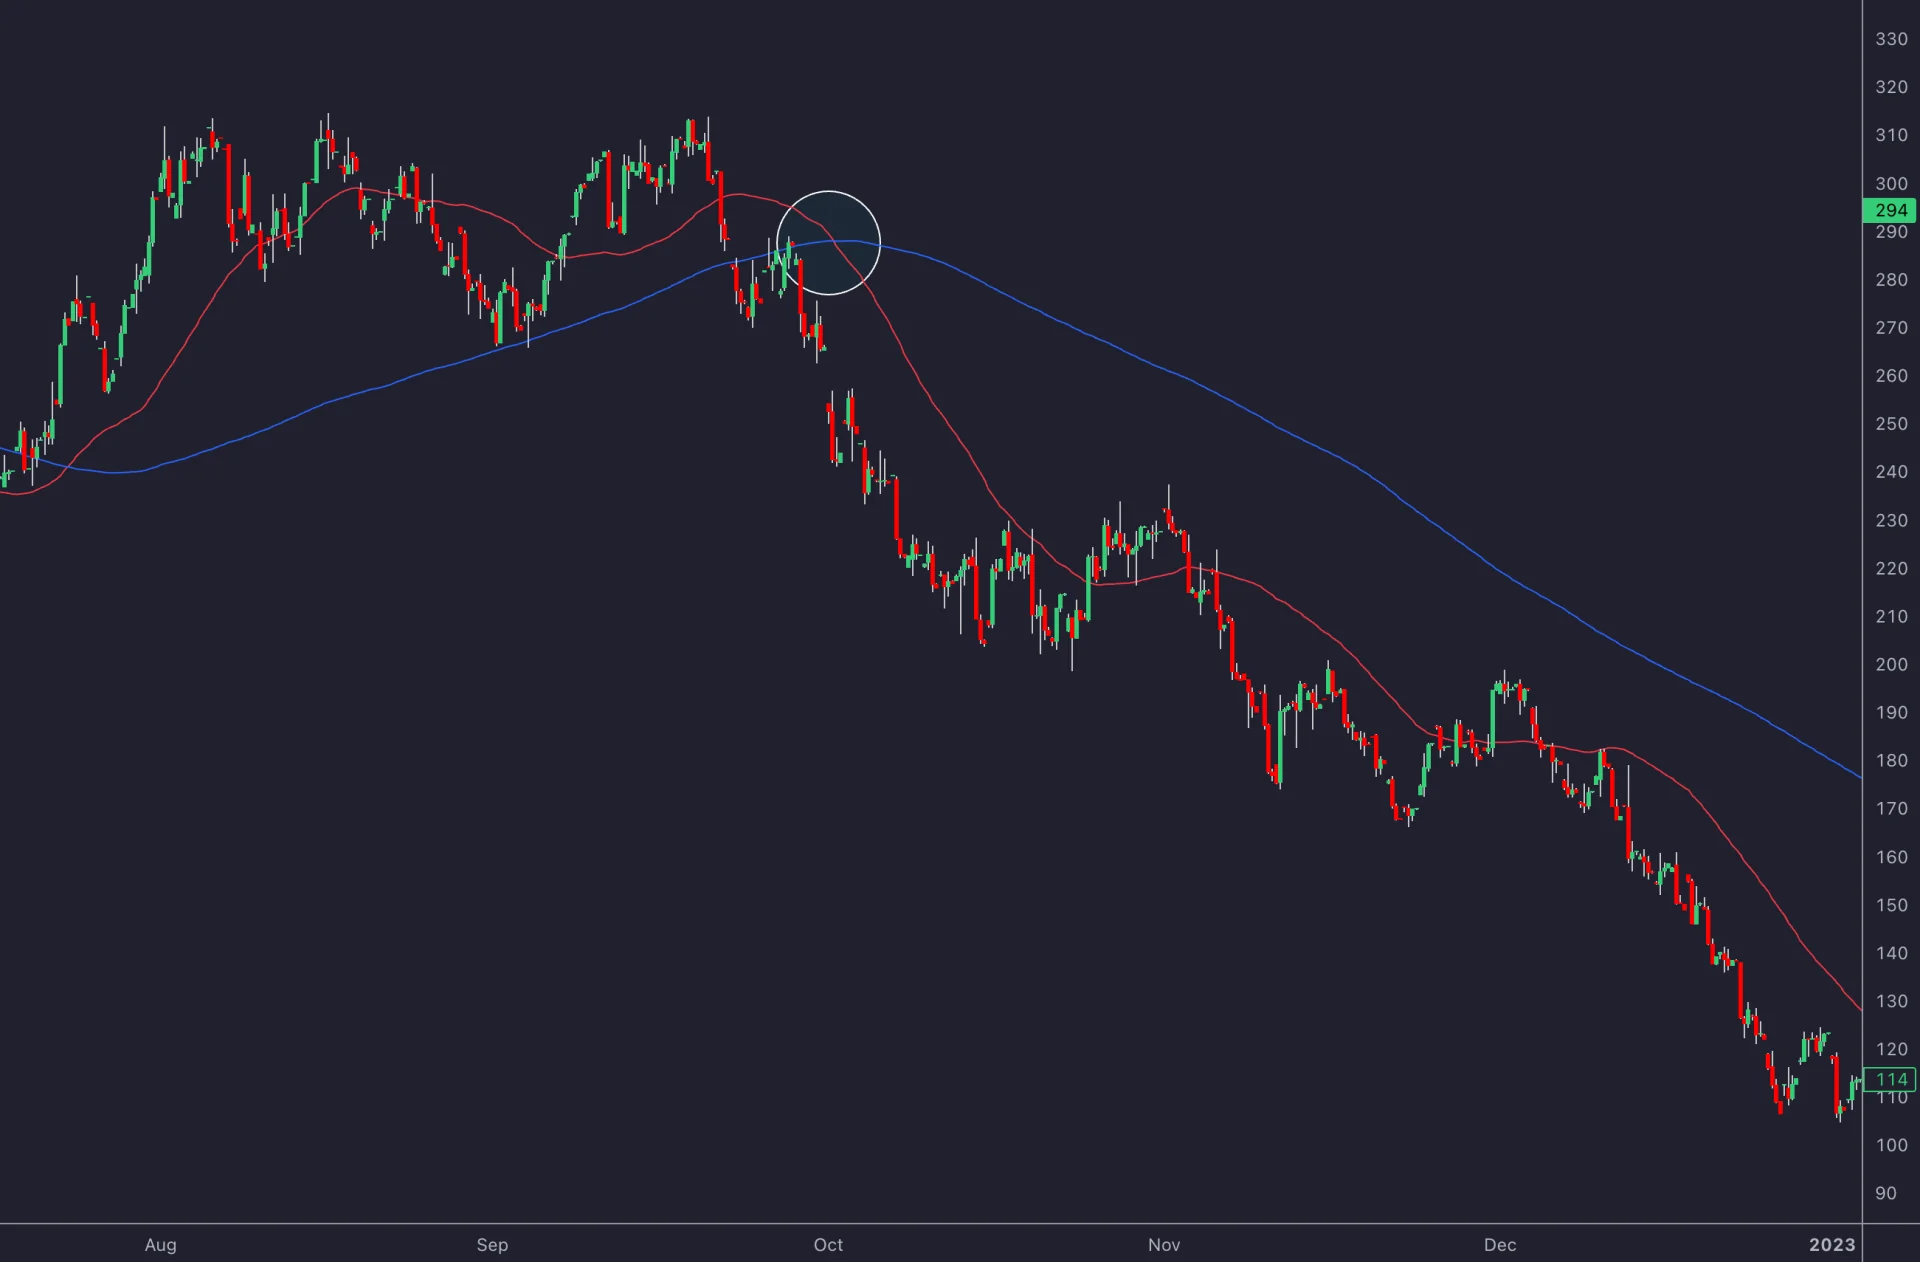
These two-average signals can be later than a price crossing, which can help ignore some short-term movement but delay exits and re-entry. Waiting another two, three or five days is an additional rule to test, not universal confirmation. A long exit after a death cross does not establish that shorting is suitable or profitable.
3. Pullback and Rejection Entries
For a long-side study, define the prior trend and an area around the SMA, then require a specified recovery in actual price. One hypothesis might require a rising 200-day SMA, a pullback within 1% of it, and a subsequent completed close above the prior day’s high. That is an illustrative rule, not a recommended threshold.
State whether the pullback can cross below the average, how long the setup remains valid and what cancels it. If support is identified through a swing point requiring later bars, use the time it becomes identifiable rather than the earlier pivot date. Buying every touch and waiting for a recovery signal are different entry methods.
Buffers, Momentum and Volume Filters
A buffer can reduce trading near the line by creating separate entry and exit thresholds. For example, a hypothetical rule might enter above 1.01 × SMA and exit below 0.99 × SMA. With an SMA of 100, those levels are 101 and 99. The gap between them can reduce some repeated switches but also delay action or increase losses; it is not a proven improvement without testing.
Another option requires several consecutive closes on the same side. Keep it distinct from a percentage buffer, and compare each change with the original rule before combining them. Trying many periods, buffers and holding rules and keeping only the best historical result can overfit the sample.
RSI above 50 or a positive MACD can add a defined momentum condition, but both derive from price and overlap with a moving-average filter. Volume adds information about activity on the selected feed; it does not guarantee continuation. Specify the volume baseline, session and whether the data represents actual traded volume or tick activity.
For multi-timeframe analysis, a weekly trend check and a daily entry rule need separate completed-bar timing. A weekly value that is still forming on Wednesday may differ by Friday. Keep the same data and adjustment conventions across charts and the test.
Separate Position Size from the Amount at Risk
Risking a percentage of capital is not the same as investing that percentage. Planned price risk equals quantity × distance from the actual entry to the planned stop, adjusted for the instrument’s point or contract value. Add expected fees and slippage, then check the notional exposure and any leverage independently.
Suppose capital is $10,000 and the chosen illustrative risk budget is $100. An actual share entry at 110 with a planned stop at 105 has $5 of price risk per share. Reserving $10 for estimated costs leaves $90, so the size is 18 shares. The position’s notional value is $1,980, or 19.8% of capital, even though the planned loss including the reserve is 1%.
If the exit fills at 103 after a gap, the price loss is 18 × 7 = $126 before costs. A stop does not guarantee the planned budget. For futures, forex or leveraged products, use the relevant contract size, tick value, currency conversion and margin requirements; do not transfer the share calculation unchanged.
Choose the stop from a written rule: actual price structure, a tested volatility distance, or another explicit condition. There is no universal requirement to place it 2–3% below the SMA, 5–7% away in volatile markets, or at least 2% from the line. A close-below-average exit and an intraday protective stop also behave differently.
If a stop trails, define when it is updated and whether it may ever move farther from the entry. Keep portfolio risk in view: several positions tied to the same market can decline together. Longer holding periods also bring overnight gaps, earnings announcements, financing or borrow costs, and changes in liquidity.
Build and Review the Strategy in Native LuxAlgo Charts
Open native LuxAlgo charts, select ordinary daily candles and add a moving average from the Indicators picker. Set the length to 200 and check the source and averaging method. Use the Data window to inspect exact values and save a template when you want consistent settings across later chart reviews.
The LuxAlgo Library offers additional studies for investigating trend, momentum, volatility and structure. Choose one because its calculation answers a specific question, not because adding more overlays promises better accuracy. A native study applies to the active chart; verify each chart’s symbol and timeframe.
Use Quant, our coding agent to express a complete test. For example: “Use a 200-period SMA of completed daily closes. Enter long at the next eligible price after a close crosses above it and exit after a close crosses below it. Expose the starting-state rule, position sizing, fees and slippage, and compare with a version using a 1% buffer.” Inspect the generated code and run the strategy manually following the Quant strategy workflow.
Check individual trades before relying on totals. Ensure the study has enough prior data, that no future daily close is used on an intraday chart, and that entries and exits reflect achievable prices. Save the tested rules and dates so later changes can be compared fairly.
An alert notifies you of a configured event; it is not an executed trade, and a generated idea does not establish an ideal entry or stop.
Interpret Historical Results without Inventing a Universal Return
A moving-average filter changes time in the market, turnover and exposure during declines. It may avoid part of a sustained fall while missing part of a recovery, and repeated small losses can accumulate in sideways conditions. The relevant comparison is the complete strategy against an appropriate baseline over identical dates and data.
For a published example, Quantified Strategies’ 200-day study reports a short-term RSI system whose win ratio rises from 76% to 81% when an above-200-day filter is added, while reported CAGR falls from 8.7% to 7.1%. That is a specific RSI strategy, not a general win rate for the SMA or for cryptocurrency.
These are the publisher’s reported backtests, not results independently reproduced here. The page uses moving “until today” endpoints in places, and its longer crossover comparison excludes reinvested dividends. A reproducible evaluation needs exact dates, complete rules, price adjustments and costs. The useful lesson is that a higher win rate can coexist with a lower compounded return.
| Comparison item | What to hold consistent | What to report |
|---|---|---|
| Data and period | Same instrument, dates, adjustments and sufficient prior history | Any missing observations, survivorship limitations or feed changes. |
| Execution | Same timing and attainable prices | Fees, spread, slippage, gaps and order assumptions. |
| Exposure | Same capital basis and treatment of uninvested cash | Time invested, turnover, leverage and position limits. |
| Outcomes | Same net-return and drawdown definitions | Trade count, average win/loss, CAGR and maximum drawdown. |
| Validation | A later sample kept out of parameter selection | All tested variants and whether any benefit persists. |
Do not assign fixed stock, forex and crypto win rates to “the 200-day strategy” without specifying which strategy and sample. Likewise, an isolated historical rally or a split-sensitive stock-price example cannot establish what the rule would have earned. Use point-in-time signals and complete trade records instead of selecting only the large moves it appears to capture.
Frequently Asked Questions
Is a 200-period moving average always a 200-day average?
No. On an hourly chart it normally uses 200 hourly observations. For a 200-day SMA, use daily closes or an explicitly calculated daily series with correct timing. A 40-week average of weekly closes is not the same calculation.
Does price above the 200-day SMA mean the average is rising?
No. Price location and average slope are separate conditions. The daily SMA change depends on the new close relative to the close leaving the 200-observation window. Define both conditions if your strategy requires both.
Should I buy every golden cross?
A golden cross is a possible research condition, not a compulsory trade. Define the averages, completed-bar timing, entry, exit and risk rules, then evaluate whipsaws and costs. A 50-day average remaining above the 200-day average is different from a fresh cross.
Where should the stop go?
There is no universal percentage distance from the SMA. Use a written actual-price or volatility-based rule and size the position from entry-to-stop risk plus costs. Account for gaps and the possibility of an exit worse than the planned stop.
Can a higher win rate still produce lower returns?
Yes. Returns also depend on average gains and losses, costs, exposure and trade frequency. Compare net compounded results and drawdown, not win rate alone, using the same period and assumptions.
How can I test the 200-day strategy with LuxAlgo?
Set up a daily moving-average study in native LuxAlgo charts. Quant, our coding agent, can help express explicit entry, exit and risk rules. Inspect generated code, run the strategy manually, and verify individual fills and the later evaluation sample.
Read next