Ratio Charts: Visual Analysis for Success
This chart plots one price series divided by another. For positive prices, a rising A/B ratio means A has outperformed B over the interval being compared. It does not mean A rose in price, that A is cheap, or that a long–short trade earned the ratio’s percentage change.
Start with the two underlying markets in native LuxAlgo charts so relative performance stays connected to absolute price behavior. For a supported strategy, ask Quant, our coding agent, to implement explicit rules, inspect the generated code and run it manually. Verify support for the required secondary data and execution model before treating a two-series study as a tradable strategy.
Calculate the ratio before interpreting it
At a matched observation time, define R = A / B. If A is $100 and B is $50, R is 2. The number describes the chosen price relationship, not a valuation multiple such as a price-to-earnings ratio. Changing which asset is in the numerator reverses the comparison.
The StockCharts Price Relative guide explains this use of ratios to compare a security with another security, a sector or a benchmark. Its StockCharts syntax uses a colon, such as IBM:$SPX. Other platforms can use different symbol syntax, so do not assume a formula can be pasted unchanged everywhere.
| Hypothetical change | Effect on A/B | Interpretation |
|---|---|---|
| A rises 10%; B rises 5% | 1.10 / 1.05 − 1 ≈ +4.76% | A outperformed while both rose. |
| A falls 5%; B falls 10% | 0.95 / 0.90 − 1 ≈ +5.56% | A outperformed while both fell. |
| A rises 5%; B rises 10% | 1.05 / 1.10 − 1 ≈ −4.55% | A underperformed while both rose. |
The exact ratio change is (1 + rA) / (1 + rB) − 1, using decimal returns over the same interval. Subtracting rB from rA is only an approximation when changes are small. For example, 10% minus 5% is a five-percentage-point return difference; the ratio itself gained about 4.76%.
For comparisons across several pairs, an indexed series such as 100 × R / R₀ makes the starting value consistent. Record the starting date. A raw ratio above 1 is not inherently stronger than another ratio below 1, because price units and share counts affect the level.
Choose the comparison for the question
- Stock versus peer: investigate relative performance within a business group while checking differences in exposures.
- Stock versus sector or index: separate company behavior from a broader reference. Benchmark choice can materially change the conclusion.
- Sector versus sector: study changes in leadership, without assuming the chart directly measures investor fund flows.
- Commodity versus commodity: align units, currency and contract definitions. A futures ratio can be affected by contract changes and different expiration schedules.
Price-based comparisons do not automatically include distributions or match total-return benchmarks. Align the adjustment convention on both series. A split, inconsistent currency conversion or stale observation can create a misleading apparent change in the relationship.
Keep the data aligned
- Use the same observation timing and state whether closes are from regular or extended sessions. Markets using different local clocks may close at different moments.
- Inspect missing data rather than silently carrying a stale value forward. A live numerator divided by yesterday’s denominator is not a simultaneous comparison.
- Reject a zero denominator and define how missing values are handled. The usual percentage-outperformance interpretation assumes positive prices.
- Verify the source, currency and adjustment basis of both series, especially around corporate actions.
- For intraday candles, do not assume A’s high divided by B’s high equals the ratio’s high. Those extremes may occur at different times.
A close-based ratio avoids claiming an intrabar path that the inputs cannot establish, but it still requires synchronized closes. Check several calculated observations against the original prices before adding any indicators.
A simple thinkScript illustration
For readers using thinkorswim, the official close() reference documents a symbol parameter for retrieving closing prices. The original article’s basic comparison can be expressed as follows; this is an illustrative plot, not a tested trading strategy:
declare lower;
input symbol1 = "AAPL";
input symbol2 = "MSFT";
plot ratio = close(symbol1) / close(symbol2);
Confirm the aggregation, price type and data availability in the platform. The compact example does not implement missing-data handling, a zero-denominator check, position sizing or orders. It has not been execution-tested here, and it is not code for native LuxAlgo.
Read relative trends alongside absolute prices
A moving average or a pre-established boundary can describe the direction of the ratio. A break identifies a change under that rule; it does not establish that the change will persist. Specify the lookback and when a bar is complete before evaluating the pattern.
A falling ratio can mean the numerator is declining faster, rising more slowly, or falling while the denominator rises. It is not an automatic instruction to buy the weaker asset. A momentum approach and a mean-reversion approach need different hypotheses and failure conditions.
Relative strength here is also different from the Relative Strength Index. RSI is an oscillator calculated from a series’ gains and losses. Applying RSI to A/B measures momentum in the ratio; it is not the same calculation as comparing A with B.
A LuxAlgo view of relative strength
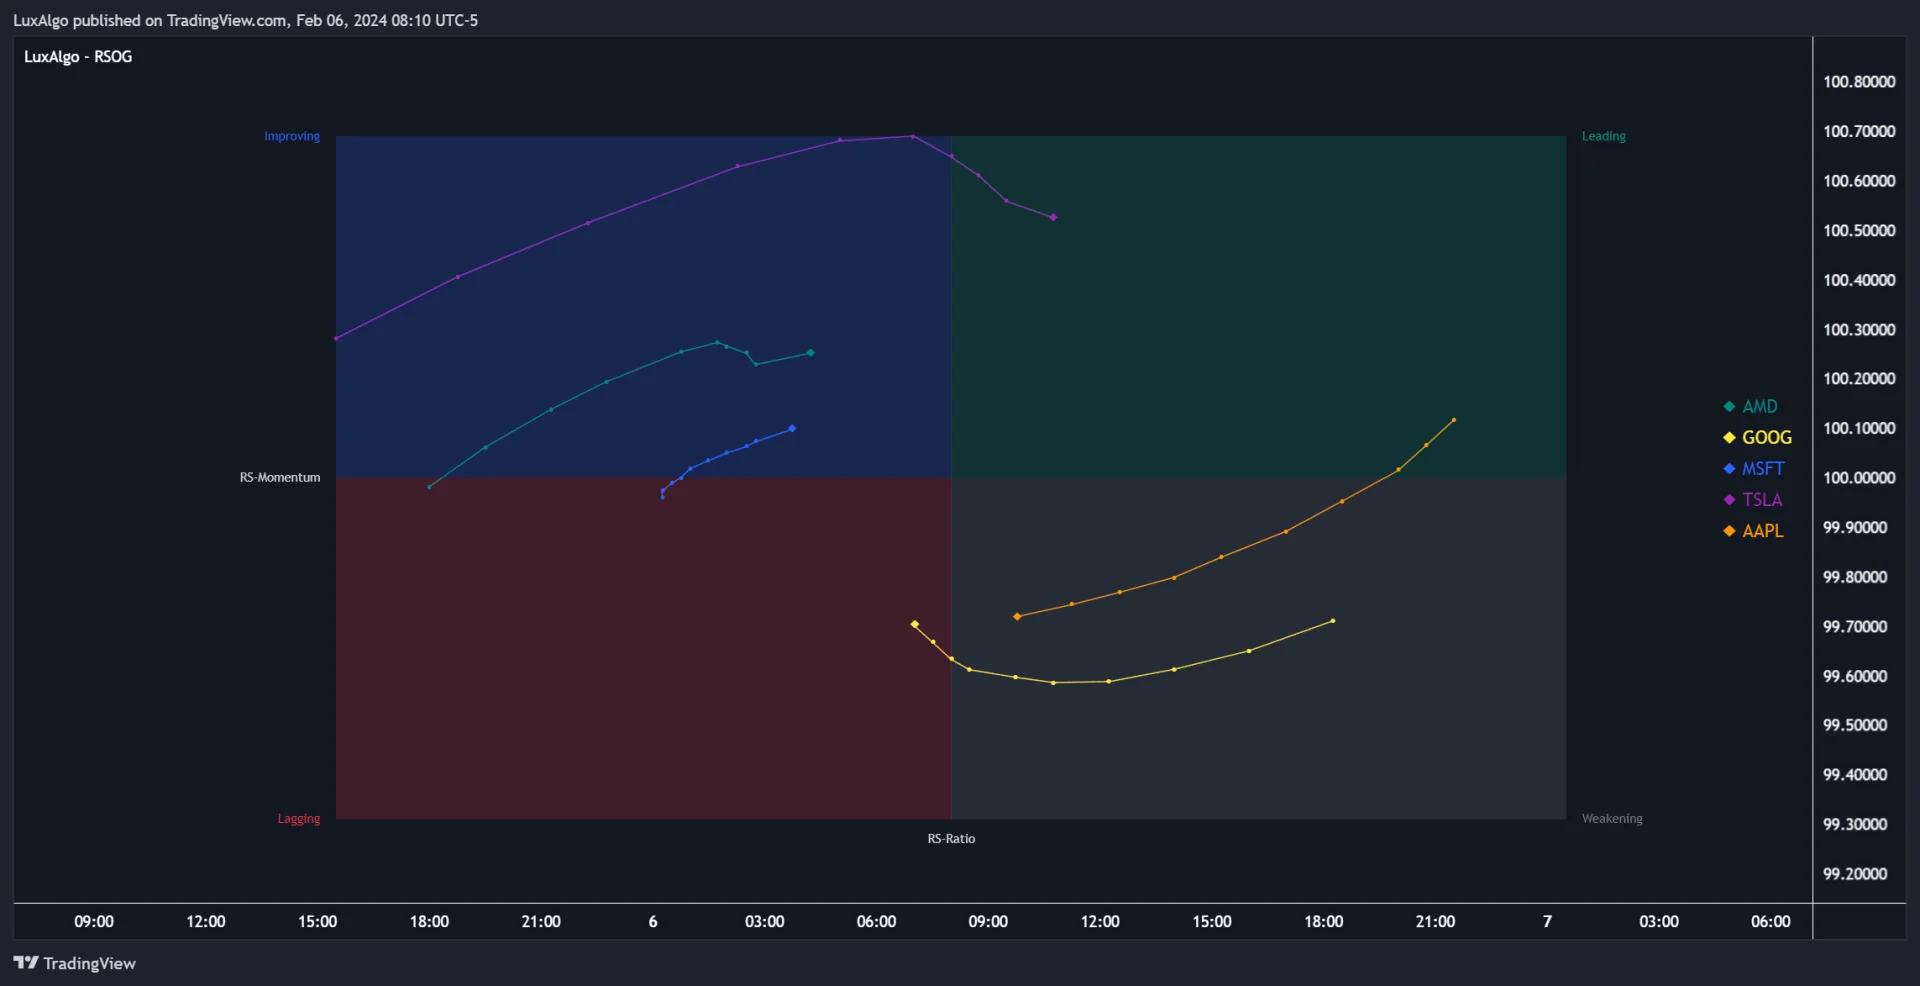
LuxAlgo’s Relative Strength Scatter Plot places selected symbols against a benchmark using smoothed, normalized relative-strength and momentum measures. It extends the comparison into two dimensions; its RS-Ratio axis is not simply the raw A/B price ratio.
Add indicators with explicit definitions
A moving average of A/B and the ratio of two separately calculated moving averages are different series. If using a “moving average ratio,” write out the formula so another person can reproduce it.
- RSI: define the ratio input, length and thresholds. An extreme reading does not guarantee reversion.
- MACD: momentum changes can help describe the ratio, but divergence is not an automatic entry.
- Bollinger Bands: specify the input and settings. A band touch does not establish a probability of reversal.
- Volume: inspect the underlying markets separately. A synthetic price ratio has no single natural traded-volume series.
Several indicators calculated from the same ratio can repeat similar information. Evaluate whether an extra condition improves results on later data rather than assuming multiple indicators provide independent confirmation.
Use higher timeframes without future information
A weekly ratio can provide context for a daily rule, but the current week’s final value is not known on Monday. Use completed observations or explicitly model how a forming bar is handled. Lower-timeframe refinements should follow the same timestamp and data-quality rules.
The ratio is not a portfolio profit-and-loss statement
Suppose A starts at $100 and B at $50. A hypothetical position buys 10 shares of A and shorts 20 shares of B, giving $1,000 on each side and $2,000 gross initial exposure. If A rises to $110 and B to $52.50, the long gains $100 and the short loses $50: $50 gross profit.
Meanwhile, A/B moved from 2 to about 2.09524, a 4.76% increase. The $50 profit is 2.5% of the $2,000 gross initial exposure. Return on account equity depends on the capital definition, financing, margin and other positions. These quantities should not be labeled interchangeably.
The example excludes spreads, fees, borrowing costs, dividends owed on a short position and execution differences. Equal initial dollar exposure does not establish beta neutrality or guarantee limited losses. The ratio itself is not a security you can necessarily buy at its plotted value.
A long-only selection process has a different risk profile: the relatively stronger asset can still lose money when both assets decline. A two-leg process must specify share quantities or another hedge rule, rebalancing and how to handle one leg failing to execute. Short positions can incur losses beyond their initial proceeds.
Test the intended strategy, not just the picture
| Decision | Define in advance | Common error |
|---|---|---|
| Signal | The ratio, lookback, completed-bar rule and threshold. | Selecting the most attractive historical pair after seeing its result. |
| Position | Long-only selection or a specified two-leg allocation. | Treating ratio change as realized portfolio return. |
| Exit | A failure condition, time limit and treatment of both legs. | Keeping a losing relationship indefinitely because it once reverted. |
| Validation | Costs, data alignment and later evaluation periods. | Reporting only the best-looking example. |
A stable-looking price relationship does not prove correlation, cointegration or mean reversion. Those are separate statistical questions. If a strategy requires them, state the estimation window, assumptions and how the model will be re-evaluated as conditions change.
Avoid unsupported historical claims such as “the ratio doubled, so the paired trade returned 100%.” A credible trade result needs entries, quantities, exits, capital and costs. The arithmetic example above makes those assumptions visible without presenting a selected historical winner as evidence of an edge.
Build a supported LuxAlgo research workflow
Use native charts to inspect the underlying symbols, sessions and timeframes. Start with clear rules and verify that the required second series can be accessed in the intended script environment. A side-by-side layout alone does not create a synthetic ratio or a two-asset backtest.
- Ask Quant, our coding agent, to implement only supported inputs and behavior. Specify the numerator, denominator, timing and missing-data policy.
- Inspect the generated code and compare sample outputs with hand calculations. Do not substitute the active chart’s series for an unavailable benchmark.
- Run the strategy manually and review inputs and properties. Confirm what instrument or instruments the test actually models.
- If a two-leg portfolio is required, use an environment that models both legs, quantities and costs. A single-symbol result cannot stand in for that test.
- Keep later evaluation data separate from parameter selection and record unsuccessful variants.
Test rules in the native strategy workflow; indicator overlays and historical plots do not themselves execute a broker trade.
Video: creating ratio charts in StockCharts
This recorded walkthrough covers ratio-chart creation in StockCharts. Interface details may differ from the current product. Use the current documentation for syntax and the calculations above for interpretation; a chart demonstration is not a performance validation.
Frequently asked questions
Does a rising ratio mean the first asset is rising?
No. With positive prices, it means the first asset outperformed the second over the interval. Both assets can be falling.
Is relative strength the same as RSI?
No. A price ratio compares two series. RSI is an oscillator based on gains and losses in a selected series.
Is the ratio return equal to one asset’s return minus the other’s?
Not exactly. The ratio change is (1 + rA) / (1 + rB) − 1. The return difference is only a small-change approximation.
Does the ratio being above 1 indicate an undervalued asset?
No. The level depends on the selected prices, units and adjustment basis. It is not a valuation conclusion.
Does a 10% ratio gain mean a paired trade made 10%?
No. Trade results depend on both legs’ quantities, entry and exit prices, costs and the capital used as the return denominator.
Can I assume a chart-based backtest models both assets?
No. Verify secondary-data support and the execution model. A study can display two series while a strategy tests only one instrument.
References
LuxAlgo — Relative Strength Scatter Plot; benchmark comparison and the LuxAlgo illustration.
- StockCharts ChartSchool — Price Relative/Relative Strength; ratio definition and chart syntax.
- Schwab thinkorswim — close(); symbol and aggregation inputs for the illustrative thinkScript plot.
- LuxAlgo — Chart Overview; underlying symbols, layouts and timeframes.
- LuxAlgo — Making Strategies and Strategy Settings; supported native workflow and test properties.
- StockCharts ratio-chart walkthrough; recorded interface demonstration.
All numerical trading examples are hypothetical. Historical chart annotations are educational illustrations, not verified strategy performance.
Read next