Reversal Candles: Identify Market Turning Points
Reversal candles identify possible turning points, not confirmed future trends. A hammer after a decline, a shooting star after an advance, or an engulfing formation can give you a setup to investigate. Its location, completed price action and trade rules determine how you use it.
This guide covers candle anatomy, three common patterns, confirmation choices and practical risk examples. LuxAlgo’s charting and AI platform supports the process: review ordinary candles and context on Quant Charts, then use Quant, our coding agent, to help turn a visual idea into explicit rules you can test.
How Reversal Candles Form
Parts of a Reversal Candle
Each candle summarizes the open, high, low and close for its interval. On an intraday chart, that interval is only part of a session. A candle does not reveal the full sequence of trades between those prices.
| Component | Measurement | What it tells you |
|---|---|---|
| Real body | Distance between open and close | The net change during the interval |
| Upper shadow | High minus the higher of open or close | How far price traded above the body |
| Lower shadow | The lower of open or close minus the low | How far price traded below the body |
A small body means the open and close were close together; it can coexist with a wide trading range. A long wick records an excursion that was not sustained at the close. Neither feature proves what institutions intended or that the next candle will reverse.
Market Psychology Behind Patterns
Traders often describe a hammer as selling pressure followed by recovery, or a shooting star as an advance that failed to hold. These are useful interpretations of the shape. They should not be treated as direct measurements of buyer conviction or a guaranteed change in control.
Location gives the interpretation meaning. A lower-wick candle after a decline is a hammer candidate; the same shape after an advance is a hanging man. Wait for the candle to close before classifying it, because its body and shadows can change while it forms.
Three Main Reversal Candle Patterns
1. Hammer
A hammer has a small real body near the top of its range, a long lower shadow and little or no upper shadow. A common screening convention requires the lower shadow to be at least twice the body length. Specify the exact tolerance in a strategy; a wick merely one-third of the candle’s total range is not an adequate hammer definition.
The preceding decline matters more than whether the body is green or red. Near a previously marked support zone, the candle can become a bullish candidate. A later close above its high is one confirmation choice, with an invalidation reference below its low. Waiting can improve clarity while also increasing the entry price and stop distance.
An inverted hammer has the opposite wick orientation after a decline: a small body near the bottom and a long upper shadow. It also needs subsequent bullish follow-through. Neither version prevents a trader from buying into a continuing downtrend.
2. Shooting Star
A shooting star appears after an advance, with a small body near the bottom of its range, a long upper shadow and little lower shadow. An upper shadow at least twice the body is a common rule. The similar shape after a decline is an inverted hammer, with a different interpretation.
Resistance and a later close below the candle’s low can define a bearish setup. High volume is optional context, not part of a universal guarantee. Price can break above the star’s high and continue upward; retain those failures when evaluating the pattern.
3. Bullish and Bearish Engulfing
An engulfing pattern concerns the real bodies of two candles. The second body covers the first body and closes in the opposite direction. It does not have to engulf the first candle’s entire high-low range. A long lower shadow is not a requirement.
| Pattern | Context and bodies | One possible confirmation |
|---|---|---|
| Bullish engulfing | After a decline: a larger bullish body engulfs the preceding bearish body | A completed close above the formation’s high |
| Bearish engulfing | After an advance: a larger bearish body engulfs the preceding bullish body | A completed close below the formation’s low |
| Hanging man | After an advance: small upper body with long lower wick | Subsequent bearish follow-through; shape alone is insufficient |
Different detectors allow different equality and gap tolerances. Fix those choices before testing, especially in continuously traded markets. The StockCharts candlestick dictionary provides a useful reference for distinguishing the named structures.
Confirming Reversal Signals
Trend, Momentum and Volume Checks
Start by defining the trend being reversed. A bullish candle during a pullback inside a larger uptrend is a different hypothesis from buying against an established downtrend. A short-term bounce may remain only a retracement until a specified swing or structural level is broken.
Moving averages, RSI divergence and a MACD crossover can describe additional conditions. They are transformations of market data, so several agreeing indicators may repeat similar information. Add filters one at a time and check whether they improve results after costs, rather than assuming more agreement means a stronger trade.
Volume measures reported activity for the selected feed. Compare it with a stated prior average and use the same session. A two-times or three-times spike is a testable threshold, not a universal rating of reversal strength. News, an opening auction or exhaustion can produce heavy volume without the expected follow-through.
For forex, check whether the feed provides tick volume rather than consolidated traded volume. For equities, exchange-specific volume and consolidated volume differ. Comparing unlike sources can change which candles pass a filter.
Timeframe Analysis Methods
A top-down review can separate broad context from the entry trigger. The combinations below are examples, not required or proven-optimal settings.
| Style | Candidate trigger chart | Broader review |
|---|---|---|
| Scalping | 5–15 minutes | 1-hour and 4-hour context |
| Day trading | 1 hour | 4-hour and daily context |
| Swing trading | 4 hours | Daily and weekly context |
| Position trading | Daily | Weekly and monthly context |
Use only completed higher-timeframe candles in a test unless the model deliberately handles intrabar updates. A daily signal that becomes visible after the close cannot justify an earlier intraday entry. Higher timeframes also involve different holding periods and stop distances; they do not automatically produce more dependable signals.
Price Level Analysis
Mark support and resistance before the pattern appears. If support breaks and a rally fails beneath it, the old support may act as resistance. If resistance breaks and a pullback holds above it, the old resistance may become support. Both are hypotheses that can fail.
A bearish candle at a failed retest can supply a trigger with an invalidation reference above resistance. A bullish candle at a successful retest can supply the opposite setup. Treat levels as zones with explicit tolerances, not exact prices that must hold. Fibonacci retracements can be additional reference levels, but their presence alone does not validate a reversal.
Trading with Reversal Candles
Entry and Exit Guidelines
Write the entry rule before seeing the outcome: a close beyond the pattern, a stop order through its extreme, or a retest entry are different models. Waiting for the next candle is one approach, not a universal requirement. Record when the setup expires and what cancels it.
For a bullish engulfing setup, one model uses the full two-candle low as the stop reference. For a bearish engulfing setup, the full formation high may be more appropriate than automatically using only the second candle’s high. Hammer and shooting-star models often use their respective extremes plus a defined buffer.
Choose a target, trailing rule or time exit as well. A correct pattern label does not tell you how much to risk or when to leave. A distant confirmation entry can leave little reward before the next opposing level.
Worked Risk and Position-Scaling Example
Suppose a hypothetical stock hammer forms near support. Your rule produces a $100 entry, a $98 stop and a $104 target. Risk is $2 per share and potential reward is $4, or 2R before costs. For a $20,000 account using an illustrative 0.5% risk budget, planned risk is $100, allowing 50 shares worth $5,000.
A fill at the stop loses $100 before costs. A gap exit at $97 loses $150. Stops do not cap losses at the quoted level. The example risk percentage is not a universal recommendation; liquidity, leverage, correlated positions and personal constraints also matter.
If you scale in, recompute aggregate risk. For example, 25 shares at $100 and 20 more at $100.50 with the same $98 stop risk $50 plus $50, or $100 before costs. Adding shares simply because another indicator agrees can silently exceed the original budget.
Forex Setup Examples
As a hypothetical AUD/USD four-hour example, a morning star at previously marked support could prompt a long candidate: a bearish first body, a small middle body and a bullish third candle recovering well into the first body. Define confirmation, entry, the pattern-low stop and the next resistance target. A doji is not mandatory for an ordinary morning star, and forex gap conventions need to be explicit.
For a hypothetical EUR/USD four-hour tweezer top, specify how closely the two highs must match, the preceding advance and the bearish trigger. A stop reference above both highs and a target at a lower level make the idea testable. These are setup illustrations, not documented profitable historical trades.
When reviewing TSLA or SPY examples, verify the exact date, session and adjusted price history. An isolated quoted price or attractive screenshot cannot establish a past entry or profitable reversal. Save losing examples alongside successful ones.
Tools for Finding Reversal Patterns
Review Context on Quant Charts
Use Quant Charts to inspect ordinary candles, compare intervals and mark relevant levels. A multi-chart layout helps keep the broader trend visible while reviewing an entry chart. Keep the symbol, feed and session consistent.
Reversal Candlestick Structure
Reversal Candlestick Structure detects sixteen named formations and applies a stochastic-based filtering layer. Its Reversal % dashboard describes the share of detections flagged as potential reversals under its algorithm. It is not a strategy win rate or proof of profitable trades.
Pattern toggles select the formations. Trend Length changes trend sensitivity; Threshold changes early-extremity detection; Warmup Length specifies the trend-establishment period before reversals are considered. Changing these settings changes the sample, so record them during comparisons.
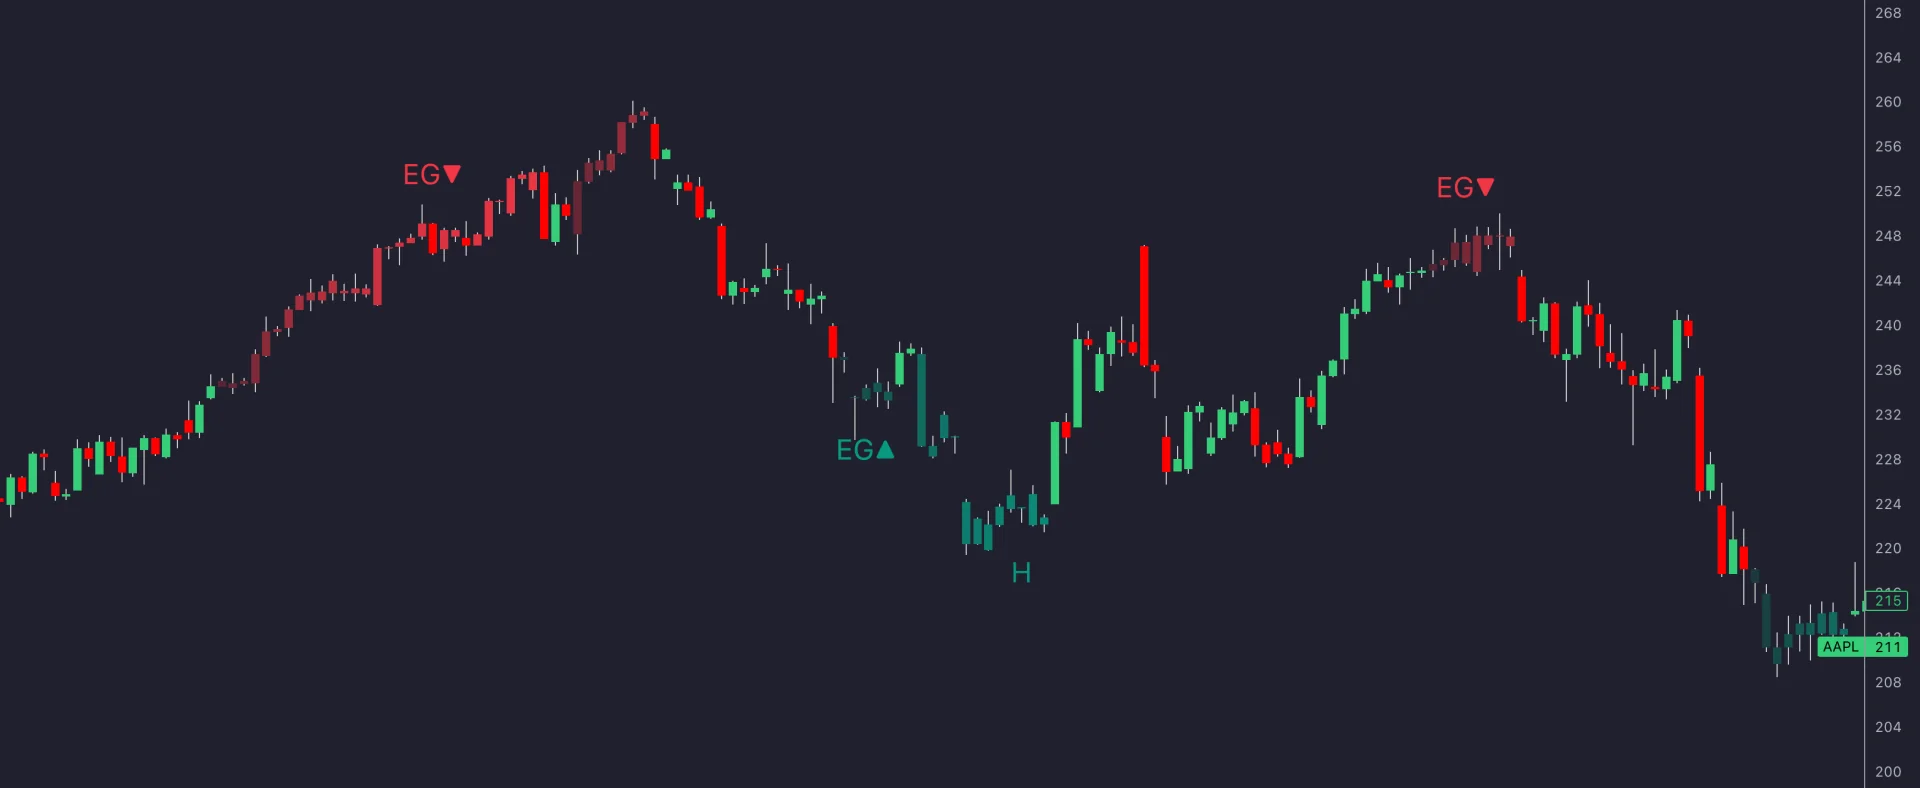
The supported list includes hammer, inverted hammer, engulfing, stars, harami, tweezers, soldiers/crows and rising/falling three formations. The last two are conventionally continuation patterns despite appearing in this tool. Read the pattern definition rather than inferring its meaning from the indicator name.
The current Library page provides a native chart preview and an Open on Quant Charts route, alongside TradingView access. It lists NinjaTrader and MetaTrader as coming soon. Product availability should be checked on the page rather than assumed across platforms.
Complementary Indicators and Trailing References
Ultimate RSI and Adaptive MACD offer momentum studies to investigate. Candlestick Structure and Swing Highs & Lows with Candle Patterns are distinct studies; their filters and confirmation timing should not be treated as identical.
Market Structure Trailing Stop, Statistical Trailing Stop and FVG Trailing Stop use different approaches to plotting trailing references. Check each tool’s rules rather than assuming every line is the same volatility stop. An indicator line is not a broker order, and moving it cannot guarantee that profits are locked in. Model the exact exit rule, bar timing and possible gaps.
Test Reversal Rules with Quant
Ask Quant, our coding agent, to help implement a specific hypothesis, such as a completed hammer after a defined decline with entry only after a close above its high. Include body/wick thresholds, the trend filter, setup expiry, stop, target, sizing and costs.
Follow Making Strategies with Quant: inspect the generated code and click Run yourself. Review fills and metrics using the native backtest guide. Check that pattern information and higher-timeframe closes were available at each entry.
Retain an untouched evaluation period and examine failed setups. Compare the pattern alone with each added filter, tracking average wins/losses, drawdown, trade count and costs. A backtest with Quant does not by itself validate a trading edge.
Candlestick Patterns Trading Course for Beginners
Using Reversal Candles Effectively
Start with one pattern, a defined location and a complete entry-and-exit rule. Review it on Quant Charts, measure the risk at the actual entry and test the rules before assuming that added confirmation helps. A reversal candle is the beginning of the analysis, not the conclusion.
FAQs
How can I combine reversal candles with indicators?
Use a defined trend, momentum or volume filter and test its contribution separately. RSI, MACD and moving averages can add context, but agreement does not guarantee a successful reversal.
What are common reversal-candle mistakes?
Common errors include ignoring the preceding trend, classifying an unfinished candle, confusing bodies with full ranges, selecting only winners and entering without a complete risk plan.
Does high volume confirm a reversal?
It confirms increased reported activity, not the future direction. Specify the feed and comparison period, then test whether a volume threshold improves the setup.
Must an engulfing candle cover the previous wicks?
No. The conventional engulfing pattern concerns the real bodies. Engulfing the complete high-low range is a different, stricter condition.
Is the Reversal % dashboard a win rate?
No. It describes detections flagged as potential reversals by the indicator. Trade profitability requires separate entry, exit, sizing and execution rules.
What separates a reversal from a retracement?
A retracement is a move against an existing trend that may resume. Define the swing or structural change required by your reversal model instead of inferring a lasting turn from one candle.
References
LuxAlgo Resources
- Quant Charts
- LuxAlgo Quant
- Making Strategies with Quant
- Native Backtest Guide
- Reversal Candlestick Structure
- Candlestick Structure
- Ultimate RSI
- Adaptive MACD
External Resources
Read next