Rob Booker ADX Breakout: Entry Signals
The Rob Booker ADX Breakout is an approach, popularized on TradingView under that name, that uses the Average Directional Index (ADX) to find consolidation and then trades the breakout from it. The logic has two halves. While the ADX is low, the market has no persistent directional dominance, so a box drawn around that period's high and low marks a range worth watching. When price closes beyond the box and the ADX begins to rise, with the directional indicators agreeing with the break, the approach treats the move as a breakout with strength behind it rather than a poke through a level. The ADX supplies the regime read; the box supplies the level; the rest of the trade still has to be defined and tested.
Key Takeaways
- ADX basics: J. Welles Wilder's 1978 trend-strength gauge on a 0 to 100 scale, direction-blind, built from the +DI and −DI lines. Readings above the conventional 25 level are read as trending; low readings as balance.
- Consolidation first: a low ADX marks the range; the box is drawn around its high and low. The level is defined before the breakout, which is what makes the breakout testable.
- Confirmation: a close beyond the box with the ADX rising and the dominant DI pointing the same way. The ADX lags by construction, so the confirmation arrives after the break, not at it.
- Risk: stops come from the box geometry and targets from multiples of its height; the arithmetic below shows why that geometry has to be checked rather than assumed.
- On Quant Charts: the native Average Directional Index, Range Detector and Donchian Channels cover the components, and Quant can build and test the complete rule.
The LuxAlgo Average Directional Index opens on Quant Charts in one click with alerts for DI crosses and the ADX crossing its key level, and Quant, our coding agent, can turn the written breakout rule into a strategy you can inspect in Code and test with Run.
MTF ADX Pattern: Using ADX to Anticipate a Breakout
Joe Rabil published this video in December 2020. It shows a multi-timeframe reading of the ADX ahead of breakouts; treat the examples as illustrations of the reading rather than as evidence about results.
Understanding the Average Directional Index (ADX)
The ADX answers one question: is either side dominating persistently? It does not say which side. Wilder built it from directional movement, the part of each bar's range that extends beyond the previous bar's range, scaled by true range and smoothed with his own recursive average. The result is a bounded line that rises whenever up-moves or down-moves dominate consistently, and sinks when neither does. A crashing market prints a soaring ADX just as a strong rally does.
ADX Components Explained
- +DI (positive directional indicator): smoothed upward directional movement as a share of true range. Rising and above −DI means up-moves are dominating.
- −DI (negative directional indicator): the same for downward movement. Rising and above +DI means down-moves are dominating.
- ADX: the smoothed absolute difference between +DI and −DI, divided by their sum and scaled to 100. Two rounds of Wilder smoothing, 14 periods each by default, make it readable and make it late.
Direction comes from the DI pair, whichever is on top; strength comes from the ADX. The classic entry configuration in Wilder's system is a DI cross while the ADX is rising, which is the same combination the breakout approach looks for at the edge of a box.
Reading ADX Values
| ADX reading | Conventional read | What it means for a breakout rule |
|---|---|---|
| Below about 20 | No durable dominance; range tactics | Candidate consolidation; draw the box around the period's high and low |
| Rising through 25 (the native Key Level) | A trend is establishing | The confirmation the approach waits for after a close beyond the box |
| Above 40 and rising | Strong dominance | The move is mature; late entries need smaller size and closer trailing stops |
| Rolling over from a high reading | Dominance fading | Contraction rather than reversal; price often drifts rather than turns |
The thresholds are conventions, not properties of the math. Volatile markets reach high readings quickly and quiet markets slowly, so the levels that separate range from trend on one instrument may not transfer to another. Whatever thresholds you use, record them with the rule.
Using ADX to Spot Breakout Opportunities
The ADX's job in this approach is to sort the chart into two regimes before any trade is considered. A low reading says the market is in a trading range, where the edges reject and the middle churns, and where most attempted escapes fail. That is where the box is drawn. A rising reading after a close beyond the box says one side has begun to dominate, which is the condition under which a breakout is more likely to be accepted than faded. Because the ADX needs several bars of one-sided movement before it rises, the confirmation always arrives after the first breakout bar; the approach accepts that delay in exchange for skipping some false breakouts, and whether the trade is worth making is a matter for the test.
How the ADX Breakout Approach Creates Entry Signals
Three conditions, in order: a consolidation identified by a low ADX, a decisive close beyond that consolidation's high or low, and an ADX that has started to rise with the dominant DI agreeing with the direction of the break. On TradingView, the indicator published under this name draws the consolidation box and marks the break; its inputs are set in the settings dialog. The same rule can be built from scratch on any platform that has an ADX.
Identifying Consolidation and Breakout Zones
The box is the highest high and lowest low of the bars during which the ADX stayed below the chosen threshold. Two properties make a box worth watching. Length: a range that has held for many bars has more resting orders at its edges than one that lasted a few. Location: a box just below a prior high or at a well-tested zone borrows significance from that level. Width matters in the opposite direction: a narrow box relative to recent volatility is a volatility contraction, and a break from it can travel further relative to the risk; a wide box gives the stop a long way to sit from the entry. Neither observation is a guarantee, and both can be measured and tested.
Using ADX to Confirm Entries
The trigger is a bar that closes beyond the box, not a wick through it, with two oscillator conditions on the same or a subsequent closed bar: the ADX has turned up from its low reading, and +DI is above −DI for a break upward or −DI above +DI for a break downward. A DI cross that occurs during the breakout bars is the strongest version of the second condition. If price closes beyond the box while the ADX keeps falling, the approach does not enter; that combination describes a range that is widening rather than a trend starting.
The lag is the point and the price. Waiting for the ADX to rise means the first bar or more of the move has already happened and the entry is worse than a plain breakout entry. What is bought with that worse price is a filter against breaks that immediately fail. Test both versions, with and without the ADX condition, on identical data to see whether the filter earns its place on your market.
Setting Stop-Loss and Take-Profit Levels
The common convention places the stop just beyond the far side of the box and targets multiples of the box height from the breakout level. That geometry deserves a hard look before it is adopted, because it decides the reward-to-risk ratio of every trade. Consider a hypothetical daily chart with a $25,000 account and a 1% risk budget of $250; see Risking It Right for the budgeting logic.
| Step | Calculation | Result before costs |
|---|---|---|
| Consolidation box while ADX stays near 16 | High $72.40, low $70.60 | Box height $1.80 |
| Breakout bar closes at $72.95; ADX turns up, +DI above −DI | Buy next open | Entry $73.00 |
| Stop beyond the box low | $73.00 − $70.40 | $2.60 risk per share; 96 shares for $250; $7,008 notional |
| Target at 1× box height from the box high | $72.40 + $1.80 = $74.20 | $1.20 reward, about 0.46R: unfavourable |
| Target at 2× box height | $72.40 + $3.60 = $76.00 | $3.00 reward, about 1.15R |
| Alternative: stop at the box midpoint $71.50 | $73.00 − $71.50 | $1.50 risk; 166 shares for $249; the 2× target becomes 2.0R, and more trades stop out |
| False break: close back inside the box at $72.10 | Exit next open $72.00; 96 × $1.00 | $96 loss, about 0.38R, if the rule exits on re-entry rather than waiting for the stop |
Two lessons follow. A stop beyond the far side of the box with a one-box-height target risks more than it stands to make, so that pairing needs a very high win rate to break even. And a break-even win rate is arithmetic, not opinion: a 2R rule breaks even, before costs, at a 33% win rate, a 1R rule at 50%, a 0.46R rule at 68%. Choose the stop and target pairing, then let the test report the win rate, rather than assuming one. Partial exits and a trailing stop behind successive swing lows are reasonable variations; each is a separate rule to test.
ADX Breakouts on Quant Charts
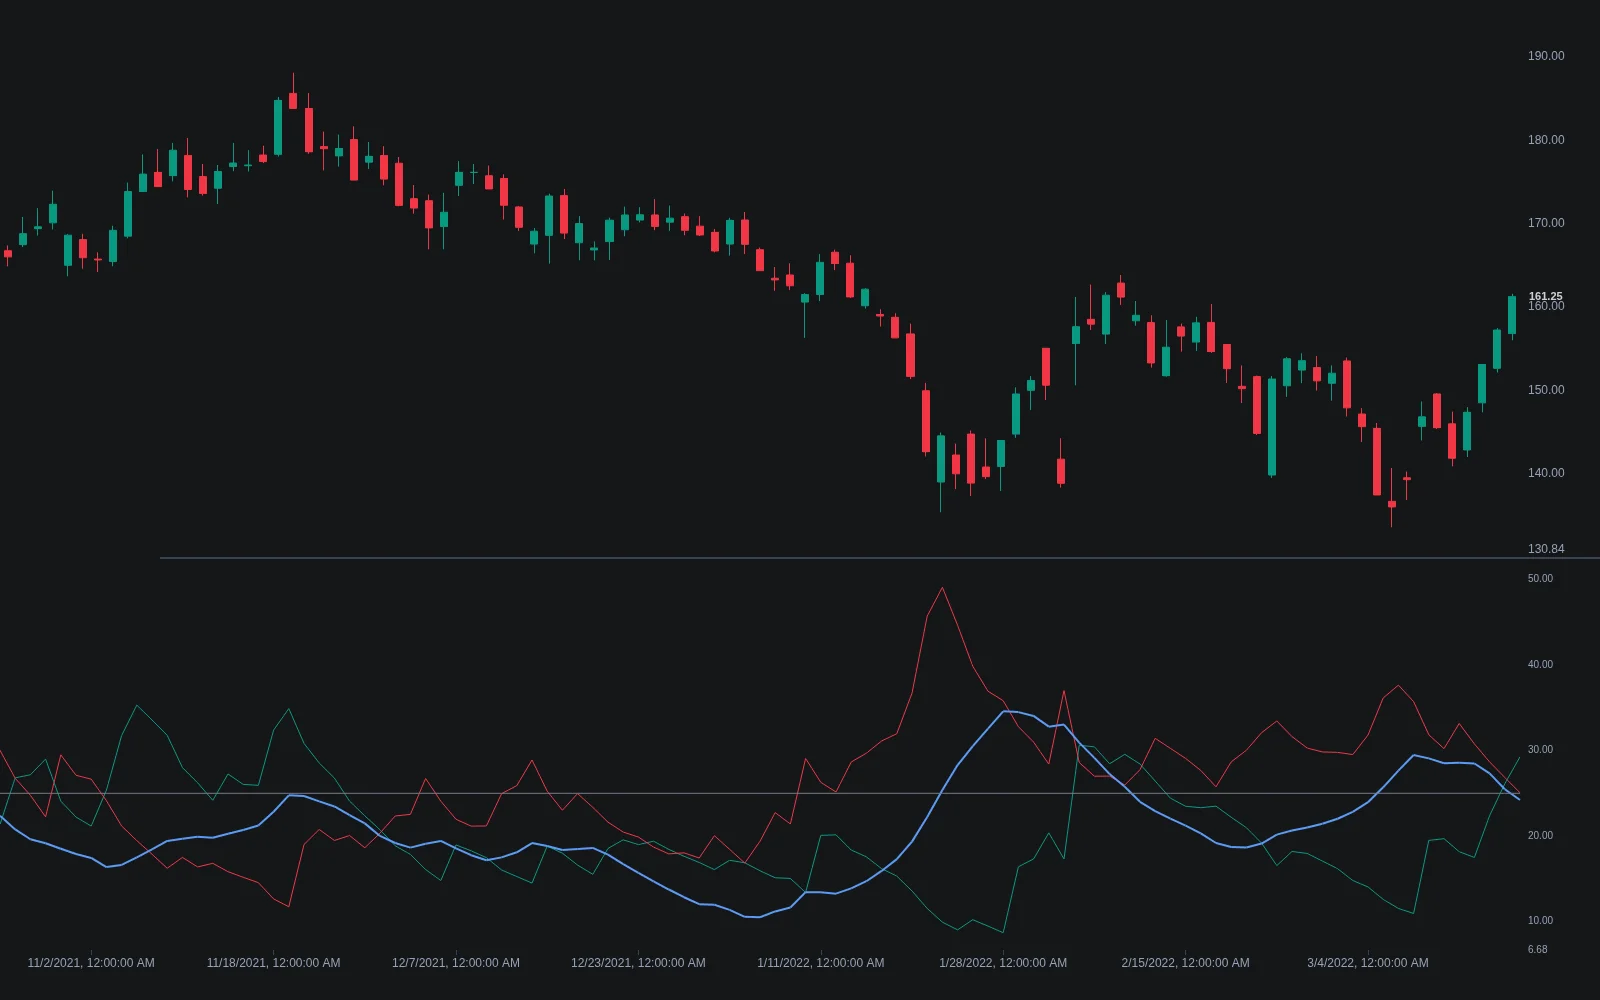
The Library's Average Directional Index is Wilder's full system: DI Length 14, ADX Smoothing 14 and a dashed Key Level at 25, with three alerts, Bullish DI Cross, Bearish DI Cross and ADX Above Key Level. Those three alerts are the ADX half of this approach. The box half is covered by two native tools.
| Tool | What it contributes | Key inputs and alerts |
|---|---|---|
| Average Directional Index | Regime read and directional confirmation | DI Length 14, ADX Smoothing 14, Key Level 25; DI cross and Key Level alerts |
| Range Detector | Finds sideways ranges automatically and draws the box as it forms; extremities turn green or red when price breaks out, and a dotted midline marks equilibrium | Minimum Range Length, Range Width (ATR multiplier), ATR Length |
| Donchian Channels | A rolling highest-high and lowest-low channel, the simplest objective box | Length 20; Breakout Up and Breakout Down alerts |
Native Box Detection
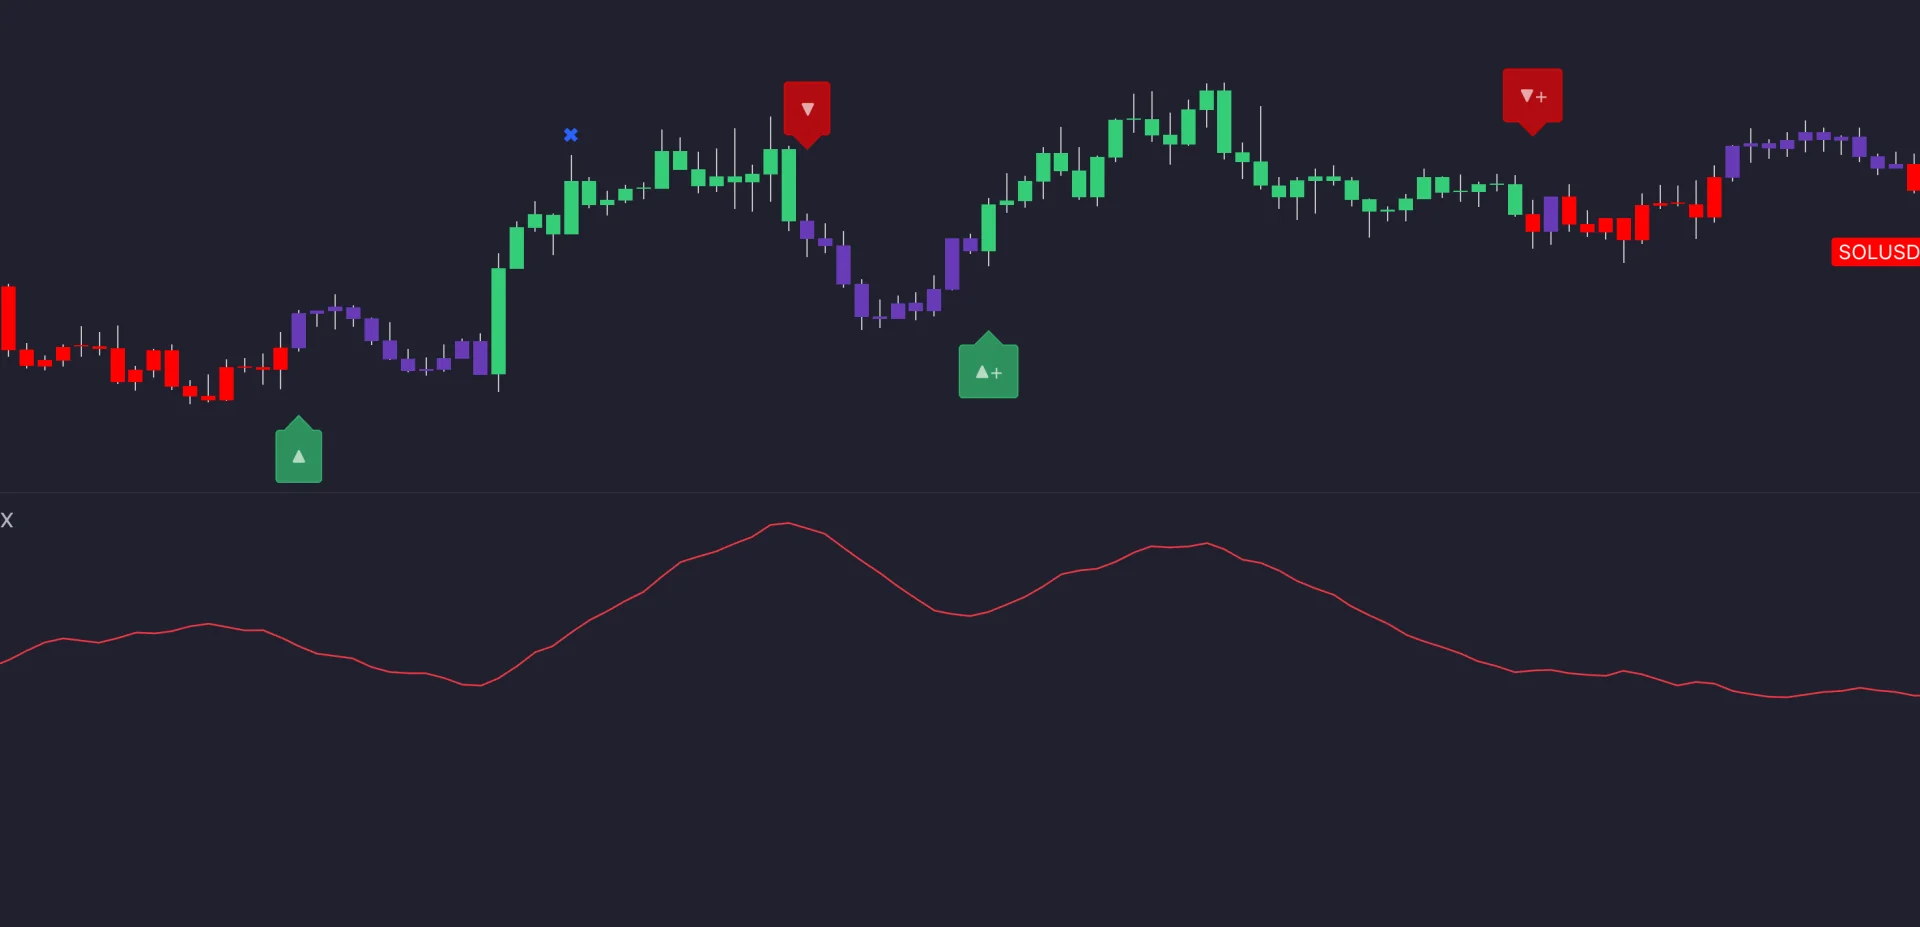
The Range Detector automates the consolidation half without using the ADX at all: it checks whether every price within a window stays inside the window's mean plus or minus an ATR-derived width, boxes the range once it has held for enough bars, and colours the extremities when price escapes. Running it beside the Average Directional Index shows where the two definitions of consolidation agree, and those overlaps are the natural candidates for the rule. Donchian Channels give a simpler alternative: a close above the 20-bar channel is a breakout by construction, and the ADX condition can be applied to it directly.
Testing the Rule with Quant
Write the rule completely: the ADX lengths and the low-ADX threshold that defines consolidation, the minimum number of bars in the box, the trigger (a close beyond the box), the confirmation (ADX rising, dominant DI aligned), the stop, the target or trailing rule and the position sizing. Describe it to Quant, inspect the Code to confirm that every condition is evaluated on closed bars and that the box is fixed before the break, and click Run. The Making Strategies with Quant guide shows the workflow, and the native backtest guide explains the Backtest Summary: net profit, trade count, win rate, maximum drawdown and profit factor, with commission and slippage set in the strategy properties.
Three comparisons matter. The full rule against a plain box breakout without the ADX condition, to see what the filter buys. The two stop placements from the table above, to see which reward-to-risk pairing survives costs. And a higher-timeframe trend filter, taking only breakouts in the direction of the higher timeframe's dominant DI, against no filter. Read trade count before return, and hold out data the settings never saw, since a rule with an ADX threshold, a box length and two ADX lengths is easy to overfit. The LuxAlgo platform does not place orders for you; it is a charting platform.
Risk Management and Best Practices for ADX Breakout Trading
Size every trade from the distance to the stop so that the loss at the stop is a fixed fraction of the account, and keep that fraction the same whether the box is narrow or wide; a wide box means a smaller position, not a larger loss. Breakout rules lose in clusters when a market stays in balance and produces several false breaks in a row, so the fixed fraction matters more than the outcome of any one trade. Volume on the breakout bar is a reasonable confirmation to test; the Library's volume at breakout page explains why a quiet break deserves more suspicion.
Adjusting ADX Settings for Different Markets
Wilder's defaults are 14 and 14. Shorter lengths flip the DI lines faster and let the ADX register a regime change sooner, at the cost of more false starts; longer lengths cut the whipsaw and delay the confirmation further. The low-ADX threshold that defines consolidation trades the same way: a higher threshold finds more boxes, a lower one fewer and tighter ones. There is no setting that tests best across markets and intervals. Change one input at a time, record all of them with every result, and prefer a setting that works acceptably across several markets to one that works brilliantly on one, which is usually the signature of curve fitting. See The Best Timeframe for Trading for the related question of interval choice.
Conclusion
The ADX breakout approach is a disciplined way to ask two questions in order: is the market in balance, and has one side now begun to dominate? The ADX answers the first with a low reading and the second with a rising one, the box turns the first answer into a level, and the DI lines add direction. What the approach does not supply is the trade: the stop, the target, the size and the evidence all have to be added, and the box geometry in particular has to be checked, because the conventional pairing of a far-side stop with a one-box target risks more than it stands to make.
The native Average Directional Index, Range Detector and Donchian Channels on Quant Charts cover the components with alerts on the exact events this approach uses, and Quant can build and test the complete rule. Whatever the test shows, the boxes and the ADX will be the same; the question is whether the rule around them earns its place.
FAQs
What makes the ADX breakout approach different from a plain breakout strategy?
It adds a regime condition on both sides of the break. The box is only drawn where the ADX says the market is in balance, and the entry only fires when the ADX has begun to rise with the dominant DI agreeing with the direction. That filters some false breaks at the cost of a later, worse entry; whether the trade is worth it is a question for the test.
Does a rising ADX tell me which way price is going?
No. The ADX is direction-blind and rises whenever either side dominates persistently, so it climbs in strong declines as well as strong rallies. Read direction from the DI pair, +DI above −DI for up and the reverse for down, and use the ADX only for the strength of that verdict.
What ADX level defines consolidation?
There is no fixed answer. Readings below about 20 are commonly read as no durable dominance and 25 as the trending threshold, which is the native indicator's default Key Level. Volatile instruments reach higher readings more easily, so the threshold that separates range from trend should be checked on the market you trade and recorded with the rule.
How can I reduce false breakouts with this approach?
Require a full-bodied close beyond the box rather than a wick, wait for the ADX to turn up and the DI lines to agree, prefer boxes that have held for many bars or sit at a tested level, and consider a higher-timeframe trend filter. Each condition reduces trade count; test the rule with and without each one on identical data.
Where should the stop go on an ADX breakout trade?
Beyond the far side of the box is the common convention, but it often makes the reward-to-risk ratio poor when the target is a single box height. A stop at the box midpoint or just inside the broken edge risks less per share and stops out more often. Choose one pairing, size from it, and let the test report the win rate rather than assuming one.
Can I test an ADX breakout rule on Quant Charts?
Yes. Open the Average Directional Index and the Range Detector or Donchian Channels from the Library with Open on Quant Charts, describe the complete rule to Quant including thresholds, box definition, trigger, stop and sizing, inspect the Code and click Run. Compare it with a plain box breakout under the same costs.
References
LuxAlgo Resources
- Quant Charts
- LuxAlgo Quant
- Average Directional Index Indicator
- Range Detector
- Donchian Channels
- Breakout
- Trading Range
- False Breakout
- Volume at Breakout
- Volatility Contraction Pattern
- Higher-Timeframe Trend Filter
- Swing High and Low
- Making Strategies with Quant
- Native Backtest Guide
- Risking It Right
- The Best Timeframe for Trading
External Resources
Read next