Rob Booker Missed Pivot Points Indicator: Highlighting Untouched Pivot Levels

A missed pivot is a pivot level that price never touched during the period it was drawn for. Pivot points are projected from the prior period's high, low and close before the session begins, and most of the time price trades through the central pivot at some point in the day, week or month it belongs to. When a market moves so fast that it never returns to that level, Rob Booker calls the result a missed pivot, and his Missed Pivot Points indicator on TradingView keeps those untouched lines on the chart after their period ends. Booker's use for them is specific: they are targets, not entry levels. TradingView's help page describes the indicator as a way to find profit targets when a trend begins to lose momentum, particularly for longer-term reversal trades, and notes that missed pivots often stack into clusters and line up with Fibonacci retracement levels. The logic is that a projected reference the market skipped in a hurry tends to be revisited once the hurry is over; the honest caveat is that the revisit can take weeks or months, and the evidence for it is anecdotal rather than statistical.
Key points:
- Definition: a daily, weekly or monthly pivot that no candle touched during its own period, kept on the chart as a horizontal level.
- Use: a target for the move back toward it after a reversal, in Booker's system paired with his Knoxville Divergence for the entry.
- Clusters count: several missed pivots stacked close together are the setups Booker's guidance singles out.
- Time is the cost: missed pivots in a sharp trend can stay untouched for a long time, so the target is only as useful as your patience and your stop.
The LuxAlgo Pivot Points indicator keeps past ladders on the chart so untouched levels can be seen, and it opens on Quant Charts in one click. Quant, our coding agent, can flag missed pivots programmatically and turn a reversal-to-target rule into a strategy you can inspect in Code and test with Run.
How Missed Pivots Are Identified
The Construction
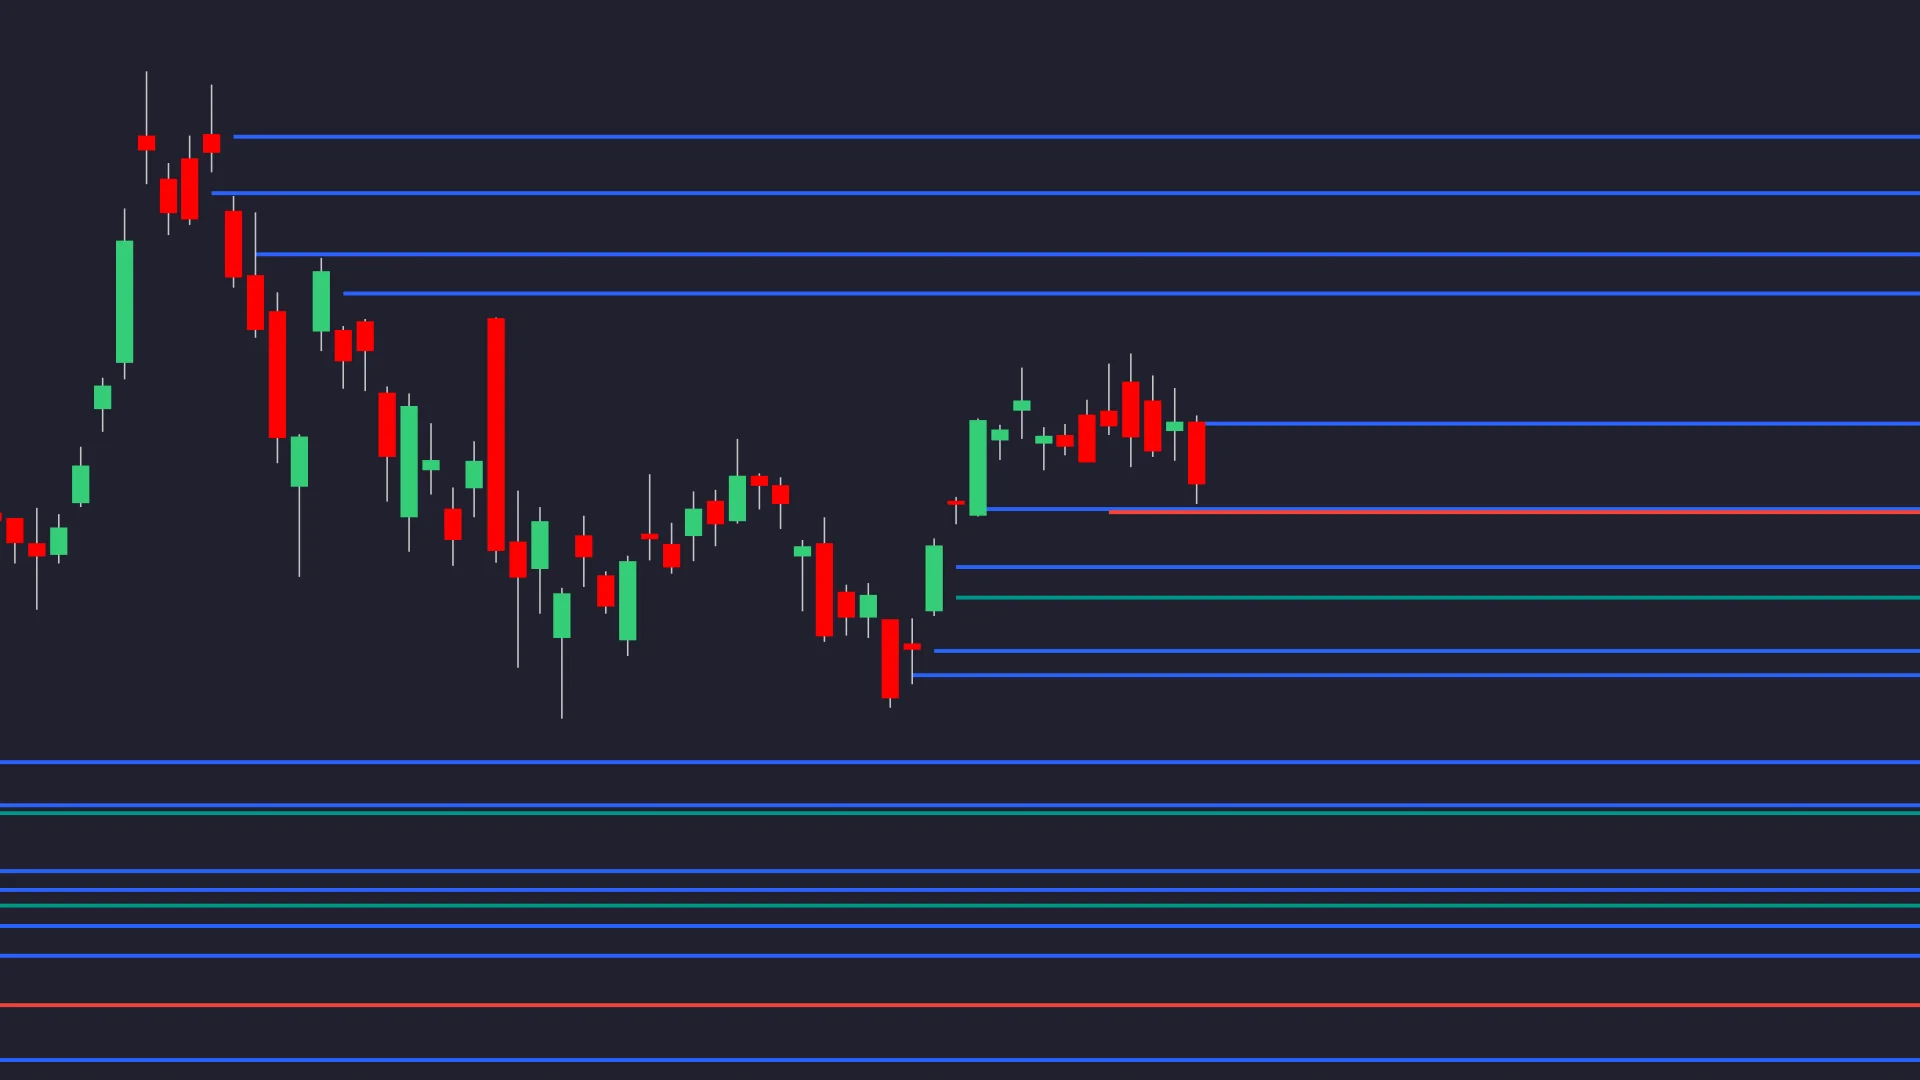
The indicator starts from the standard floor-pivot arithmetic: the central pivot is the average of the prior period's high, low and close, with resistance and support rungs reflected around it. For each new period it checks whether any bar's range crossed the level. If none did by the time the period closes, the level is a missed pivot and stays drawn, extending to the right, until price finally trades through it. TradingView's implementation offers daily, weekly and monthly pivot periods and controls for line size and boldness; the choice of period sets the horizon of the targets, with weekly and monthly missed pivots serving longer-term reversal trades and daily ones the intraday version described on the companion Intraday Pivot Points page. Session convention matters as it does for any pivot: a 24-hour feed and a regular-hours feed give different prior highs, lows and closes, so the same symbol can show different missed pivots on the two.
A Worked Weekly Ledger
The table follows a hypothetical stock through six weeks. Each week's central pivot is computed from the previous week's high, low and close, and the week's own range decides whether it was touched.
| Week | Prior week high / low / close | Weekly pivot | This week's range | Result |
|---|---|---|---|---|
| 2 | $120.00 / $114.00 / $119.20 | $117.73 | $116.90 to $121.50 | Touched |
| 3 | $121.50 / $116.90 / $118.00 | $118.80 | $112.90 to $118.60 | Missed by $0.20 in a sharp sell-off |
| 4 | $118.60 / $112.90 / $113.40 | $114.97 | $110.10 to $115.20 | Touched |
| 5 | $115.20 / $110.10 / $114.80 | $113.37 | $113.60 to $117.90 | Missed by $0.23 in a sharp rebound |
| 6 | $117.90 / $113.60 / $117.50 | $116.33 | $115.80 to $121.00 | Touched |
Two missed pivots survive: $118.80 above the market from the sell-off week, and $113.37 below it from the rebound week. Both were missed by small margins in fast weeks, which is the pattern the concept describes: the market moved too quickly to return to the level it had projected for itself. In Booker's framing the $118.80 line is now a target for a long taken after the decline reverses, and the $113.37 line a target for a short if the rebound fails.
Why Untouched Levels Are Watched
Freshness, Not Magnetism
The popular explanation is that untouched levels act as magnets because orders pile up at them. The more defensible version is narrower. A level that has not been tested still holds whatever interest created it, and each test consumes some of that interest; the Library's level freshness and decay page describes exactly this scoring, with a zero-touch level ranking highest and the score decaying on every test. A missed pivot is a fresh level by construction. It is also a widely watched one, because pivots are computed identically by everyone using the same session data, so a return to it is a point where many participants expect a reaction. Neither property guarantees that price will come back, or that it will react when it does; both explain why the level deserves a place on the chart.
What the Evidence Actually Says
The most-cited support for missed pivots is a piece of informal research by trader Scott Welsh, who checked every weekly pivot on Home Depot from June 1990 onward and found that all of them had eventually been touched, in some cases only after weeks or months during the 2000 and 2008 declines. That is an interesting observation, and it needs its caveats stated. It covers one stock with a strong long-term uptrend, which makes upside targets far more likely to be reached; Welsh himself looked only at long trades back up to missed levels for that reason. It says nothing about how long the wait was or what a position would have endured in the meantime, and a target that is eventually hit is not a profitable trade if the stop is hit first. Treat the claim as a hypothesis for your own instrument and test it, rather than as a property of markets.
Clusters and Confluence
TradingView's help page passes on two of Booker's own reading rules. First, look for a consolidation of many missed pivots, horizontal lines stacked one on top of another, which marks a zone the market skipped repeatedly and a stronger candidate target than a single line. Second, missed pivots tend to line up with Fibonacci retracement levels, and the overlap is where he places the most confidence. The general principle is confluence scoring: a projected level that coincides with an independently derived reference, a prior period high or low, a retracement or a volume node, earns more weight than one alone. The measured move is a useful cross-check for target distance when a missed pivot sits far from the entry.
Trading Toward a Missed Pivot
Targets First, Entries Second
Booker's method reverses the usual order. The missed pivot is chosen first as the destination; the entry comes from a separate reversal signal, in his system the Knoxville Divergence indicator, and in general any reversal read you trust: a divergence, a failed breakdown, a higher low after a sell-off. The stop belongs to the entry structure, below the reversal low for a long, and the target is the nearest missed pivot in the direction of the trade, or the near edge of a cluster. When the nearest missed pivot is too close to give a worthwhile reward-to-risk, the trade is skipped rather than the target stretched.
A Worked Reversal Trade
Take the ledger above after week five. Price has based around $113.60 to $114.80, a higher low has formed above the week-four low, and the week-three missed pivot at $118.80 sits overhead. On a $25,000 account with a 1% risk budget of $250, the rule is a long on the close that confirms the higher low, a stop below the base, and the missed pivot as the target. See Risking It Right for the budgeting logic.
| Step | Calculation | Result before costs |
|---|---|---|
| Target | Nearest missed pivot above price | $118.80, from the week-three ledger row |
| Entry | Close confirming the higher low | Buy $114.90 |
| Stop below the base | $113.60 low minus a $0.90 allowance | Stop $112.70; $2.20 risk per share |
| Position size | $250 ÷ $2.20, rounded down | 113 shares; $248.60 planned risk; $12,984 notional |
| Reward | $118.80 − $114.90 | $3.90, about 1.8R |
| Gap through the stop, fill at $112.10 | 113 × ($114.90 − $112.10) | $316.40 loss, about 1.3R; a stop level is not a guaranteed fill |
| Time limit | Written before entry | If the target is not reached within N bars, exit at market; missed pivots can take months |
The missed pivot supplied the target, the reversal structure supplied the entry and stop, and the stop distance supplied the size. The last row is the part most descriptions leave out: a target that is eventually hit is worthless if capital sits in the trade for a quarter waiting for it, so a time stop is part of the rule.
Managing the Trade
Two habits keep the method honest. Scale out at the near edge of a cluster rather than the far edge, since the first line is the one most likely to produce a reaction, and move the stop to break-even only once price has cleared the entry structure by a distance that costs would not erase. And record every missed pivot you trade toward with the date it was missed and the date it was hit, because the distribution of waiting times on your instrument is the fact that decides whether the method fits your holding period.
Video: The Missed Pivot Point Indicator on TradingView
The Financial Wars channel published this walkthrough in January 2018. It shows how missed levels stay on the chart after their period ends and how traders watch for price to revisit them; treat any results shown as illustrations of the method rather than as evidence about performance.
Pivots and Missed Pivots on Quant Charts
Seeing Untouched Levels with the Native Pivot Points
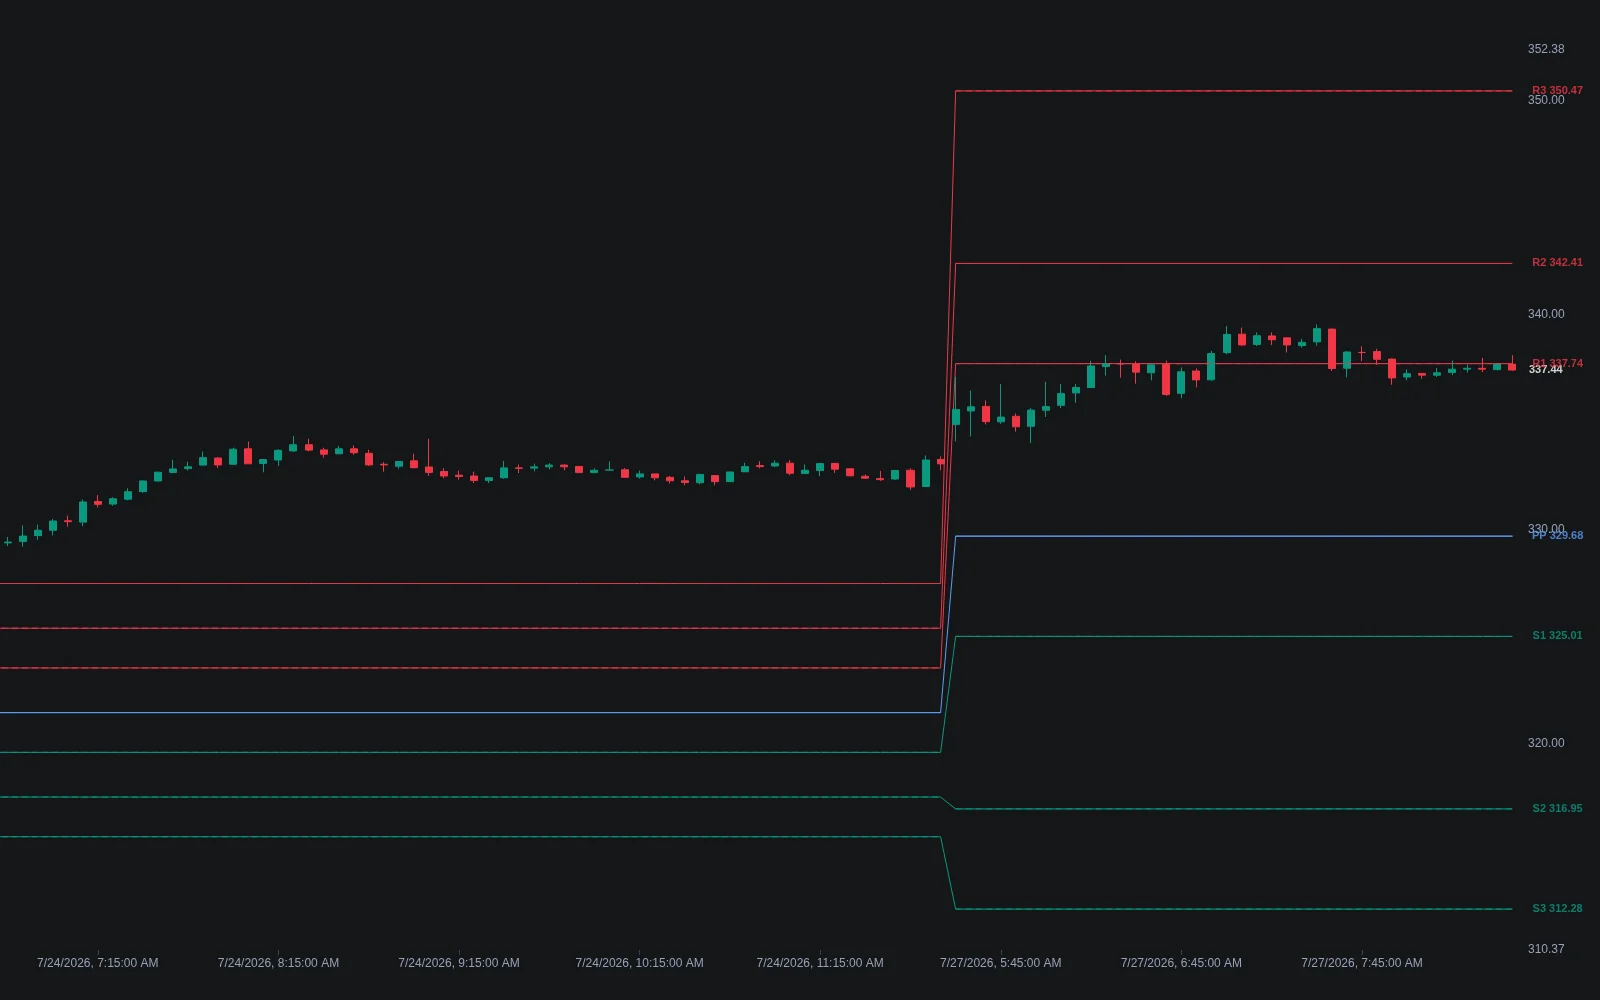
The Library's Pivot Points draws the classic ladder from an Anchor Period of Daily, Weekly or Monthly (Auto picks one step above the chart timeframe), with one to three rungs and a Periods Shown setting, default five, that freezes each elapsed ladder into history. Reviewing those past ladders is the manual version of the missed-pivot check: a central pivot or rung that the candles of its own period never reached is a missed level, and the history view makes the comparison direct. Its alerts include First Test of PP, R1 and S1, which fire on the first touch of a level in a period, so a level that never fires was missed. Pivot Points Standard adds the Fibonacci, Camarilla and Woodie formula sets for traders who want the confluence check against Fibonacci-based rungs. Both open on Quant Charts from their Library pages.
| Tool | What it adds | Where it runs |
|---|---|---|
| Pivot Points | Classic ladder with past periods kept on the chart and First Test alerts | Quant Charts, from the Library page |
| Pivot Points Standard | Traditional, Fibonacci, Camarilla and Woodie ladders for confluence checks | Quant Charts, from the Library page |
| Support and Resistance Levels with Breaks | Swing-based levels from actual price to weigh against projected pivots | Quant Charts, from the Library page |
| Missed pivots (Quant script) | Untouched pivots flagged and extended automatically, with alerts on first touch | Quant Charts, written by Quant and inspectable in Code |
Flagging and Testing Missed Pivots with Quant
Describe the rule to Quant in full: the pivot formula and anchor period, the session convention, the definition of a touch (any bar's range crossing the level during its own period), how long an untouched level should be kept, the reversal condition that permits an entry, the stop, the missed-pivot target and the time stop. Inspect the Code to confirm the pivot is computed from the completed prior period and that the touch test uses each bar's high and low rather than the close, and click Run. The Making Strategies with Quant guide shows the workflow, and the native backtest guide explains the Backtest Summary: net profit, trade count, win rate, maximum drawdown and profit factor, with commission and slippage set in the strategy properties.
Three questions are worth testing. How often missed pivots on your instrument are eventually touched, and how long it takes, split by whether the level was above or below price; that is the Welsh observation reproduced on your own data. Whether a reversal-to-missed-pivot rule beats the same reversal entry with a fixed 2R target, which is the honest test of Booker's central claim. And whether the near edge of a cluster outperforms a single missed pivot as the target. Read trade count and time in market before headline return, and hold out data the rule never saw. A trend or structure signal near a missed pivot is confluence to test rather than confirmation, and the LuxAlgo platform does not place orders for you.
Strengths and Limitations
| Aspect | Strength | Limitation |
|---|---|---|
| Definition | Objective: a pivot no bar touched in its period, computed the same way by everyone | Depends on the session convention and the pivot formula chosen |
| Role | A clear, pre-drawn target for reversal trades | Not an entry signal; needs a separate reversal read and a structural stop |
| Freshness | Untested levels rank highest in level-scoring logic | Fresh does not mean magnetic; the return can take months or not happen before the stop |
| Evidence | Long histories on trending stocks show most weekly pivots eventually touched | Anecdotal, one-sided (long only) and silent on waiting time and drawdown |
| Clusters | Stacked missed pivots and Fibonacci overlap give a stronger target | Clusters are judged by eye unless coded; test the definition |
| Tooling | TradingView built-in, native Pivot Points history view, reproducible in Quant | No LuxAlgo tool ships a dedicated missed-pivot indicator; it is a script to write |
Conclusion
Missed pivots are a small, precise idea: a level the market projected for itself and then skipped in a hurry, kept on the chart as a candidate destination for the return trip. Booker's use of them as targets rather than entries is the right emphasis, and his reading rules, stacked clusters and Fibonacci overlap, add discipline to which lines deserve attention. What the idea needs from you is the rest of the trade: an independent reversal signal, a stop from structure, a time limit, and a test on your own instrument of how often and how quickly the return actually arrives. The native Pivot Points history on Quant Charts makes the levels visible; Quant makes the rule testable.
Key Takeaways
- A missed pivot is a target. Booker uses untouched pivots as destinations for reversal trades, with the entry coming from a separate signal.
- Fresh, not magnetic. Untested levels rank highest in level scoring; that explains attention, not certainty.
- Clusters and confluence. Stacked missed pivots that overlap a retracement or a prior-period level are the setups his guidance singles out.
- Time is the hidden cost. Eventually touched is not the same as profitably reached; write a time stop into the rule.
- Native and testable. Pivot Points on Quant Charts keeps past ladders visible with First Test alerts, and Quant can flag missed pivots and test the rule.
FAQs
What is a missed pivot point?
A pivot level, daily, weekly or monthly, that no bar touched during the period it was projected for. Pivots are computed from the prior period's high, low and close, and price usually trades through the central pivot within the period; when a fast move prevents that, the untouched level is a missed pivot, and Rob Booker's indicator keeps it on the chart until price finally reaches it.
How does Rob Booker use missed pivots?
As profit targets rather than entry levels. TradingView's help page describes the indicator as a way to find targets when a trend loses momentum, especially for longer-term reversal trades, with the entry coming from a separate reversal signal such as his Knoxville Divergence. Clusters of stacked missed pivots and overlap with Fibonacci retracement levels are the setups his guidance emphasises.
Do missed pivots always get hit?
No rule guarantees it. The most-cited evidence is an informal study showing every weekly pivot on one long-uptrending stock since 1990 was eventually touched, sometimes only after months during major declines. That covers one instrument, one direction and says nothing about waiting time or drawdown, so treat it as a hypothesis to test on your own market rather than a property of markets.
Which pivot period should I use for missed pivots?
Match the period to the holding time of the trade that will target it. Weekly and monthly missed pivots suit longer-term reversal trades, which is the use TradingView's help page describes; daily missed pivots belong to the intraday version covered on the Intraday Pivot Points page. Whatever the period, fix the session convention first, because regular-hours and 24-hour data give different levels.
Where should the stop go on a missed-pivot trade?
With the entry structure, not with the target. For a long taken after a reversal, the stop sits below the reversal low with a small allowance; the missed pivot above is the target. Size the position from that stop distance, and skip the trade when the nearest missed pivot is too close to offer a worthwhile reward-to-risk.
Can I find missed pivots on Quant Charts?
Yes. Open the Pivot Points indicator from the Library with Open on Quant Charts and use Periods Shown to keep past ladders visible; a level the candles never reached in its own period is a missed pivot, and the First Test alerts fire only on levels that were touched. To flag and extend missed pivots automatically and test a reversal-to-target rule, describe the definition to Quant, inspect the Code and click Run.
References
LuxAlgo Resources
- Quant Charts
- LuxAlgo Quant
- Pivot Points Indicator
- Pivot Points Standard Indicator
- Support and Resistance Levels with Breaks
- Pivot Points Concept
- Floor Pivots
- Prior Period Levels
- Level Freshness and Decay
- Confluence and Scoring Systems
- Measured Move
- Making Strategies with Quant
- Native Backtest Guide
- Rob Booker Pivot Points Indicator: Support and Resistance Levels
- Risking It Right
External Resources
Read next