Rob Booker Reversal Indicator: Spotting Potential Market Reversals
The Rob Booker Reversal is a TradingView built-in indicator that prints a triangle when two familiar oscillators agree: the MACD line has just crossed zero, and the Stochastic %K is at an extreme in the opposite direction. A red triangle marks a MACD line that has crossed below zero while %K is above the overbought level; a green triangle marks a MACD line that has crossed above zero while %K is below the oversold level. The marker is easy to read, but TradingView's own documentation is blunt about who should use it: traders who already understand both the MACD and the Stochastic. Here is what you need to know:
- How it works: a slow regime read (the MACD zero cross) and a fast range-position read (the Stochastic %K at an extreme) must line up on the same bar. That combination is uncommon by construction, so signals are infrequent.
- Visual signals: red triangles for the bearish condition and green triangles for the bullish one, drawn on the price chart.
- Adjustable inputs: Fast MA Period, Slow MA Period, KPeriod, Slowing, Stochastic Upper and Stochastic Lower. Any change produces a different indicator that needs its own test.
- Use: a candidate for a reversal or pullback entry, to be confirmed by a level, a price trigger and a stop taken from structure.
- Limitations: MACD lags by construction, the Stochastic pins at extremes in trends, and a triangle carries no stop, target or size. It is not a standalone system.
The indicator itself lives on TradingView. Its two ingredients, the MACD and the Stochastic, are available natively on Quant Charts from the LuxAlgo Library, and Quant, our coding agent, can reproduce the published rule from those two building blocks so you can inspect it in Code and test it with Run.
How the Rob Booker Reversal Indicator Works
Core Mechanics of the Indicator
The two components measure different things. The MACD line is the difference between a fast and a slow exponential moving average of price, so a cross of the zero line means the fast average has moved to the other side of the slow one: a trend-regime statement, and the slowest of the MACD's three reads. The Stochastic %K measures where the latest close sits inside the recent high-low range on a 0 to 100 scale, a fast read that reaches its overbought and oversold zones often.
The indicator requires both at once, in opposite directions. For a green triangle, the MACD line must have crossed above zero, which normally happens after price has already recovered for a while, on a bar where %K is below the oversold level, which means the close is near the bottom of its recent range. Those two facts rarely coincide; when they do, it is typically because a young uptrend has just suffered a sharp pullback that pushed the close to the bottom of the range without yet dragging the fast average back below the slow one. The red triangle is the mirror case. Read this way, the marker is less a "reversal" call than a pullback-within-a-fresh-trend flag, and that framing matters for where the stop goes.
Settings and Parameters You Can Adjust
TradingView lists six inputs. Their default values are shown in the indicator's settings dialog rather than in its documentation, so check them on your chart before assuming they match the classic MACD and Stochastic defaults.
| Input | Component | What it controls | Effect of changing it |
|---|---|---|---|
| Fast MA Period | MACD | Length of the fast EMA | Shorter values make zero crosses earlier and more frequent; longer values delay and thin them |
| Slow MA Period | MACD | Length of the slow EMA | Sets the regime the zero line represents; a longer slow average means fewer, larger regime changes |
| KPeriod | Stochastic | Lookback for the high-low range used in %K | Shorter ranges reach the extremes constantly; longer ranges reserve them for larger moves |
| Slowing | Stochastic | Smoothing applied to %K | 1 gives the fast stochastic; 3 the classic slow version with fewer extreme readings |
| Stochastic Upper | Stochastic | Overbought threshold for red triangles | Higher values demand a more stretched close before a bearish marker prints |
| Stochastic Lower | Stochastic | Oversold threshold for green triangles | Lower values demand a more stretched close before a bullish marker prints |
Because the signal is the intersection of two conditions, small changes have outsized effects on frequency. Raising Stochastic Upper or lowering Stochastic Lower can remove most markers; shortening the MACD lengths can multiply them. Whatever you choose, record the six values with any result, since a test at one set says nothing about another.
Reading Visual Signals and Markers
The triangles are the only output. A red triangle appears on the bar where the MACD line has crossed zero from above with %K above Stochastic Upper; a green triangle appears where the MACD line has crossed zero from below with %K below Stochastic Lower. Both conditions are evaluated on the bar's values, so a marker on the live bar can appear and disappear until that bar closes; a marker on a closed bar is fixed. Work from closed bars, and treat the triangle as the start of a checklist rather than its end.
Using the Indicator in Live Trading
Step-by-Step Signal Recognition Guide
- Wait for the bar to close. Only a triangle on a completed bar is a signal.
- Locate it. A green triangle inside a tested support zone, or a red one inside a tested resistance zone, is a candidate; a triangle in the middle of nowhere is noise until price proves otherwise.
- Check the regime. The MACD zero cross says the fast average has just moved to the other side of the slow one. Confirm that reading against structure: a green triangle after a sequence of higher lows is consistent; one inside a persistent downtrend is a counter-trend bet and should be sized as one.
- Look for a price trigger. A hammer, engulfing bar or doji at the zone, or a close beyond the signal bar's high or low, converts the oscillator condition into a price event.
- Treat volume as a hypothesis. Rising volume on the reversal bar is consistent with participation behind the turn; test whether requiring it improves your results before making it a rule.
Entry and Exit Strategies
The common entry rules are the next bar's open after the signal bar closes, or a stop order just beyond the signal bar's high (for green) or low (for red). The second is later and filters some failures. Exits belong to structure rather than to the indicator: a first target at the nearest opposing zone, a trailing stop behind successive swing lows or highs, or an early exit if the MACD line crosses back through zero, which says the regime read that justified the trade has reversed. The hypothetical example below uses a daily chart, a $25,000 account and a 1% risk budget of $250; see Risking It Right for the budgeting logic.
| Step | Calculation | Result before costs |
|---|---|---|
| Green triangle on a closed daily bar inside a support zone | Signal bar low $40.90, close $41.60 | Buy stop at $41.85 above the signal bar high |
| Stop below the signal bar low and the zone's far edge | $41.85 − $40.95 | $0.90 risk per share |
| Position size | $250 ÷ $0.90, rounded down | 277 shares; $249.30 planned risk; $11,592.45 notional |
| First target at the nearest resistance zone | $44.20 − $41.85 | $2.35 reward, about 2.6R |
| Early exit: MACD crosses back below zero at $41.30 | 277 × ($41.85 − $41.30) | $152.35 loss, about 0.61R |
| Gap through the stop, fill at $40.40 | 277 × ($41.85 − $40.40) | $401.65 loss, about 1.61R; a stop level is not a guaranteed fill |
Risk Management Best Practices
Place the stop beyond the structure that justified the trade, the signal bar's extreme or the far edge of the zone, plus an allowance for normal wick traffic, and derive the position size from that distance so that every trade risks the same fraction of the account. Reward and win rate are linked: a rule that targets 2R breaks even, before costs, at a 33% win rate, and a 3R rule at 25%. No win rate can be assumed for this or any indicator; it comes from the test. See Risk-Reward Ratio vs Win Rate and Win Rate and Risk/Reward: Connection Explained.
Higher-timeframe agreement is a reasonable filter: a green triangle on the hourly chart while the daily MACD is also above zero is a pullback in a larger uptrend, while the same triangle against a daily downtrend is a counter-trend trade. Whether the filter earns its place is, again, a question for the test rather than an assumption.
Rob Booker Reversal on TradingView and on Quant Charts
On TradingView, the indicator is added from the built-in indicators list and its six inputs are set in the settings dialog. It has no native equivalent in the LuxAlgo Library, but both of its components do, and the published rule is short enough to rebuild exactly.
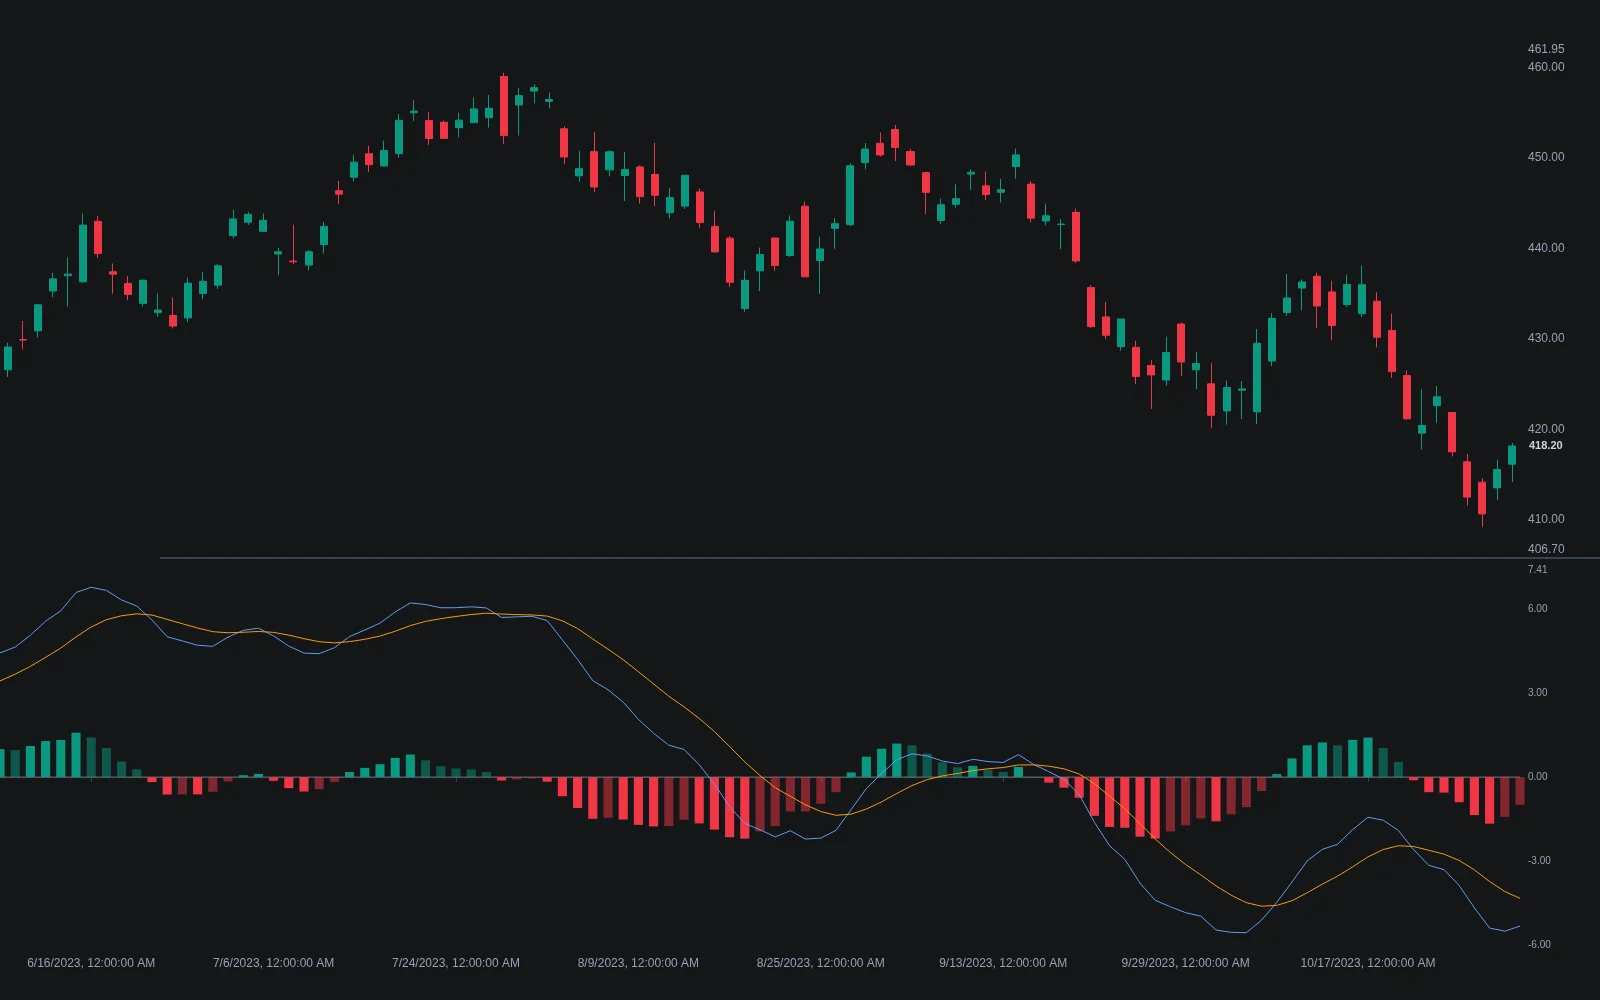
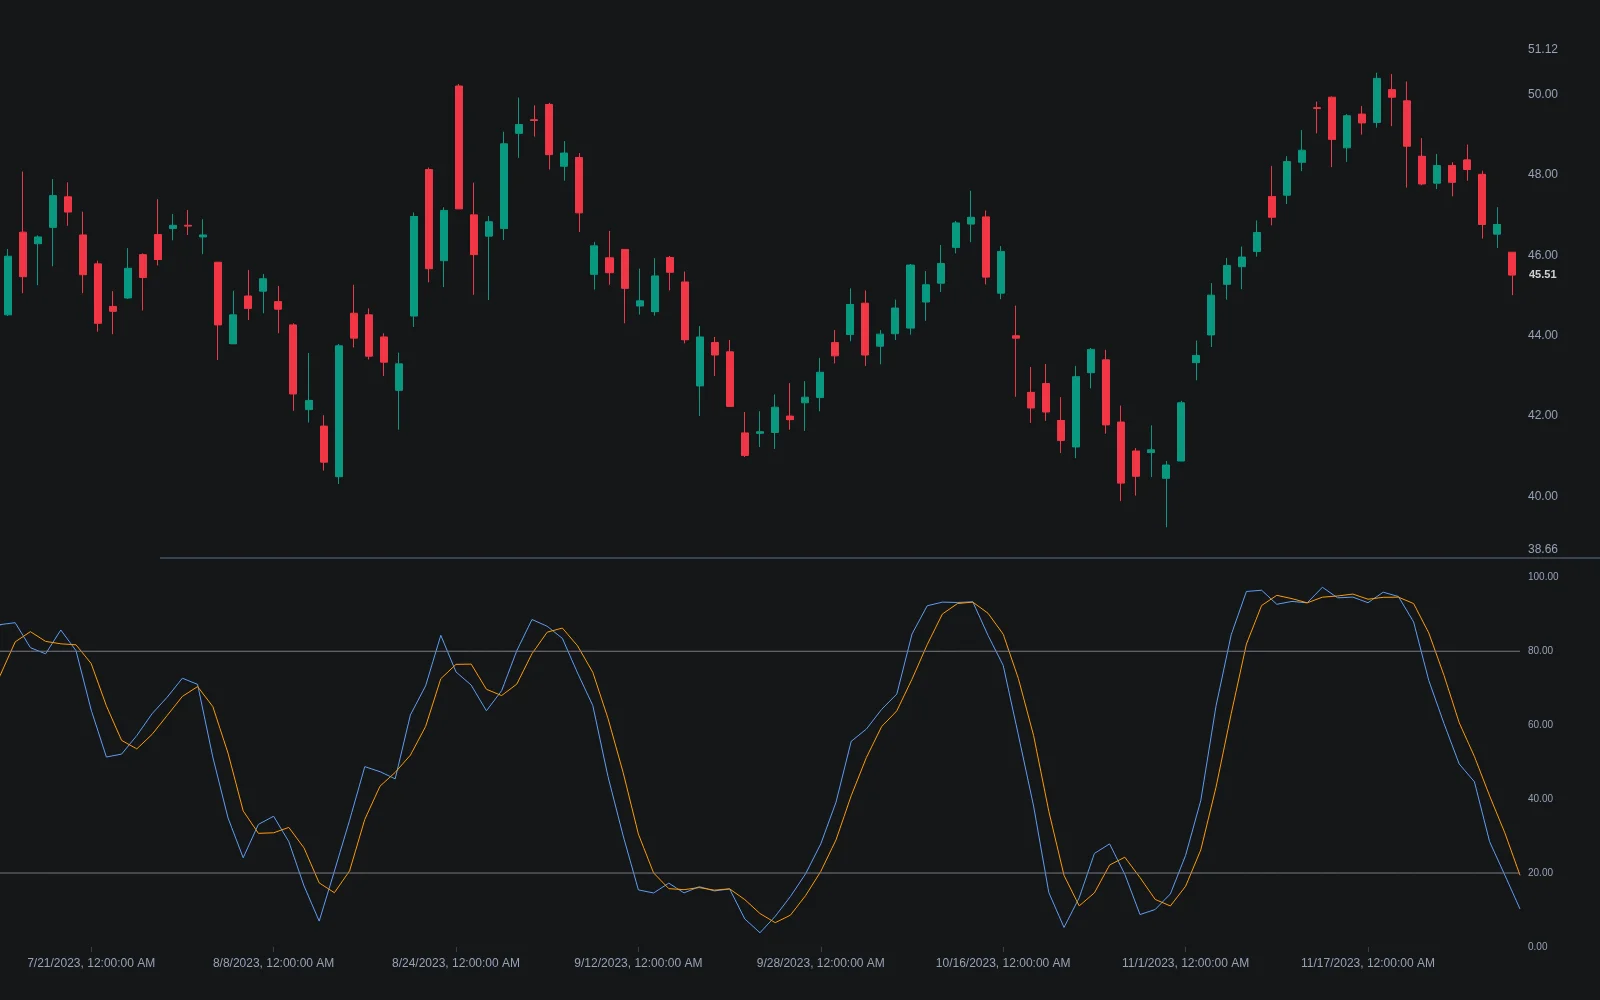
The Library's MACD is Appel's standard build with Fast Length 12, Slow Length 26 and Signal Smoothing 9, and it ships with Bullish Zero Cross and Bearish Zero Cross alerts alongside the signal-line cross alerts. The Stochastic is Lane's standard build with a 14-bar %K smoothed over 3, a 3-bar %D and levels at 80 and 20, with six alerts covering %K/%D crosses and %K entering and leaving each zone. Both open on Quant Charts in one click from their Library pages, and both publish their source.
Rebuilding and Testing the Rule with Quant
Describe the rule to Quant in plain words: a bullish marker when the MACD line crosses above zero on a bar where the Stochastic %K is below the lower level, a bearish marker when it crosses below zero with %K above the upper level, with the six lengths and levels as inputs. Then add the parts the indicator leaves out: the entry (next open or a stop beyond the signal bar), the stop, the target or trailing rule and the position sizing. Inspect the Code to confirm that the conditions are evaluated on closed bars, and click Run. The Making Strategies with Quant guide shows the workflow, and the native backtest guide explains the Backtest Summary: net profit, trade count, win rate, maximum drawdown and profit factor, with commission and slippage set in the strategy properties.
Two comparisons are worth running. First, the combined rule against each component alone: MACD zero crosses without the Stochastic condition, and Stochastic extremes without the MACD condition, on identical data and costs, to see what the intersection actually adds. Second, the rule with and without the zone requirement. Read trade count before return; a rule that fires a handful of times a year per market needs many markets and a long history before any conclusion is safe, and any six-input rule is easy to overfit, so hold out data the settings never saw. LuxAlgo's Support and Resistance Signals MTF can supply the zone side of the checklist natively on Quant Charts; it does not read the triangles, and agreement between it and a triangle is confluence to test rather than confirmation. The LuxAlgo platform does not place orders for you; it is a charting platform.
Pros and Cons of the Rob Booker Reversal Indicator
Key Strengths of the Indicator
Objective and reproducible. The rule is two published conditions on two standard oscillators, so anyone can reproduce a marker and audit why it printed. Selective. Because the conditions rarely coincide, the indicator prints far fewer markers than either oscillator alone, which suits traders who want a short list of candidates rather than a stream of signals. Transparent inputs. The six settings map directly onto the two components, so a change in behavior can always be traced to a change in one of them. Portable. The rule runs on any market and interval, and can be rebuilt on any platform that has a MACD and a Stochastic.
Limitations to Consider
Lag. A MACD zero cross is a slow event; by the time it prints, the regime it describes has often been under way for some bars, and the triangle marks a pullback in that regime rather than its start. Extremes in trends. The Stochastic pins at its extremes in strong trends, so a red triangle in a powerful uptrend is frequently strength rather than a top. Rare by design. Selectivity means small samples; a test with a few dozen trades cannot distinguish an edge from noise. Nothing about the trade. The marker carries no stop, target, size or regime check; all of those have to be added and tested. Live-bar flicker. Both conditions are read from the current bar until it closes, so an intrabar marker can vanish; act on closed bars only.
Pros and Cons Comparison Table
| Advantages | Limitations |
|---|---|
| Two published conditions; every marker can be audited | MACD zero cross lags; markers arrive after the regime change |
| Infrequent markers make a manageable candidate list | Small samples make results hard to trust |
| Six inputs map directly onto the two components | Six inputs are easy to overfit |
| Rebuildable natively from the MACD and Stochastic | No stop, target, size or regime check included |
| Works on any market and interval | Stochastic extremes mislead in strong trends |
Conclusion
The Rob Booker Reversal is a compact, honest rule: a slow regime read and a fast range-position read must agree on one bar. That makes its markers rare and auditable, and it also makes them late and incomplete. Read as a pullback flag inside a freshly turned trend, located in a zone, triggered by a price event and protected by a stop taken from structure, it can be a reasonable candidate generator. Read as a standalone reversal call, it is the kind of indicator TradingView's own documentation warns should be used only by traders who understand its parts.
The parts are available natively on Quant Charts, and Quant can rebuild the rule from its published definition. Whatever the test shows, the triangles will still print in the same places; the question is whether the rule you wrap around them earns its place.
FAQs
How can I minimize false signals from the Rob Booker Reversal?
Act only on triangles on closed bars that form inside a tested support or resistance zone, require a price trigger such as a close beyond the signal bar, and check the higher timeframe's MACD regime. Each filter reduces trade count; test the rule with and without each one on identical data.
What tools work alongside the Rob Booker Reversal?
A support and resistance tool to locate zones, candlestick reversal patterns for the price trigger, and a higher-timeframe trend filter. On Quant Charts the native MACD and Stochastic reproduce the components, and Support and Resistance Signals MTF supplies zones. Treat agreement between tools as confluence to test, not as confirmation.
How should I adjust the settings for different markets and timeframes?
Change one input at a time and record all six with every result. Shorter MACD lengths and a shorter KPeriod multiply markers; stricter Stochastic levels remove them. There is no setting that tests best across markets, and a result at one set says nothing about another.
Does the Rob Booker Reversal repaint?
Markers on closed bars are fixed, because MACD and Stochastic values do not change once a bar has closed. On the live bar both conditions are re-evaluated with every tick, so a triangle can appear and disappear until the close. Work from closed bars and, when testing, make sure the code does the same.
Is the Rob Booker Reversal available on Quant Charts?
Not as a named indicator. The MACD and Stochastic it is built from open on Quant Charts from their Library pages, and Quant can code the published rule from those two, with the six inputs exposed, so you can inspect it in Code and test it with Run.
Why are the signals so infrequent?
Because the two conditions point in opposite directions. A MACD zero cross usually happens after price has recovered for a while, while an oversold Stochastic means the close is near the bottom of its recent range. Both at once typically requires a sharp pullback inside a freshly turned trend, which is uncommon.
References
LuxAlgo Resources
- Quant Charts
- LuxAlgo Quant
- MACD Indicator
- MACD Concept
- Stochastic Indicator
- Stochastic Oscillator Concept
- Overbought and Oversold
- S/R Zone
- Swing High and Low
- Hammer
- Bullish and Bearish Engulfing
- Doji
- Support and Resistance Signals MTF
- Making Strategies with Quant
- Native Backtest Guide
- Risking It Right
- Risk-Reward Ratio vs Win Rate
- Win Rate and Risk/Reward: Connection Explained
External Resources
Read next