Scaling In and Out: Risk Mitigation for Volatility Breakouts

A volatility breakout occurs when price moves beyond a defined range as trading activity or price movement expands. The move may continue, stall, or quickly reverse. There is no single failure rate that applies across markets, timeframes, and breakout definitions.
Scaling in limits the quantity committed at the first signal and allows later additions under explicit conditions. Scaling out reduces the position through partial exits. These choices can change the path of risk and returns, but adding later can worsen the average entry, while selling early can reduce the payoff from a large winner.
Use LuxAlgo’s native charts to define the range and market context, then ask Quant to turn the complete entry, sizing, and exit sequence into a strategy for review and testing. The objective is a measurable tradeoff, not a promise that scaling simultaneously reduces drawdown and preserves every gain.
3 Different Ways to Scale Into a Stock to Manage & Reduce Your Risk
Sasha the Options Coach discusses staged stock entries and exits. Treat the examples as approaches to evaluate against your own execution costs and risk limits.
How to Scale Positions for Risk Control
Step-by-Step Position Scaling
Start by defining the range without using future information. For example, a daily strategy could require a completed close above the highest high of the preceding 20 completed bars. State when the order is submitted and what fill model applies; recognizing a closing signal is different from guaranteeing a fill at that close.
Next, define the phases. The following structure is an example to test, not a recommended set of universal thresholds:
- Initial entry: take a limited position after the breakout condition. Record the actual entry price, stop, and ATR reference.
- Confirmation entry: allow one addition after a later completed bar meets a specified continuation or retest condition. If using a move of 1.5 ATR, state the starting price, ATR period, and whether ATR is frozen or recalculated.
- Momentum entry: allow a final addition only if its conditions and the remaining risk budget both permit it. A rule involving the 20-period EMA and above-average volume needs a defined timeframe and volume comparison window.
A price remaining above an EMA is not permission to add on every bar. Specify one trigger per stage and a maximum number of entries. Also define when the setup expires, when no further additions are allowed, and what happens if an exit condition arrives before the sequence finishes.
Scaling vs. Full Position Entry
| Question | Staged entry | Single entry |
|---|---|---|
| Initial exposure | Only the first tranche is committed | The planned quantity is committed at once; this need not mean the whole account |
| Fast continuation | Later entries may be more expensive or never fill | More quantity participates from the initial fill |
| Early failed breakout | Can lose less if fewer shares are open under a comparable stop | More quantity is exposed if the planned full size is already open |
| Costs and handling | More orders and quantity changes; fee impact depends on pricing | Fewer entry orders, but partial exits remain possible |
| Risk after additions | Must be recalculated across all open entries | Depends on the quantity, stop, and execution assumptions |
Do not compare a lightly exposed scaled strategy with a much larger single-entry strategy and attribute the entire drawdown difference to better signals. Keep maximum planned risk and capital constraints comparable, and report how actual exposure differs. Psychological comfort is another possible benefit, but it varies by trader and does not establish profitability.
Tools for Breakout Position Scaling
Position Size Calculator Methods
Average True Range measures price variability, including gaps relative to the previous close. It does not predict direction or the largest possible next move. Choose its period, timeframe, and smoothing consistently before testing an ATR-based rule.
For unleveraged stock shares, a simplified single-entry calculation is:
Shares = floor(available risk budget ÷ planned stop distance per share).
If the stop distance is defined as ATR × multiplier, substitute that value in the denominator. Do not multiply ATR by a stop distance that is already expressed in price units. For futures or other contracts, convert price movement into monetary risk using the applicable contract value and currency. Include costs, quantity increments, and buying-power limits.
For multiple long entries with a common stop below all their prices, sum quantity × (entry price − stop) across the entries. CME’s position-sizing guide explains the relationship between the chosen risk allowance and stop distance.
Worked Breakout Example
Assume a hypothetical stock trade with ATR frozen at $2 from the chosen completed signal bar, an initial fill at $50, and a common stop at $46. An illustrative $400 budget covers the planned loss at that stop before costs and execution differences. Actual entry fills, rather than trigger prices, determine risk.
| Stage | Assumed fill | Shares | Added planned loss at $46 | Combined planned loss |
|---|---|---|---|---|
| Initial | $50 | 30 | 30 × $4 = $120 | $120 |
| Continuation, if permitted | $53 | 20 | 20 × $7 = $140 | $260 |
| Final signal, if permitted | $54 | 10 | 10 × $8 = $80 | $340 |
The fully built position is 60 shares with an average entry of about $51.67. The remaining $60 is headroom for this simplified calculation, not a guarantee against slippage. Equal-size additions at different prices would contribute different amounts of risk. If the stop moves or a fill differs, recompute the whole position before proceeding.
LuxAlgo Tools for Breakout Analysis
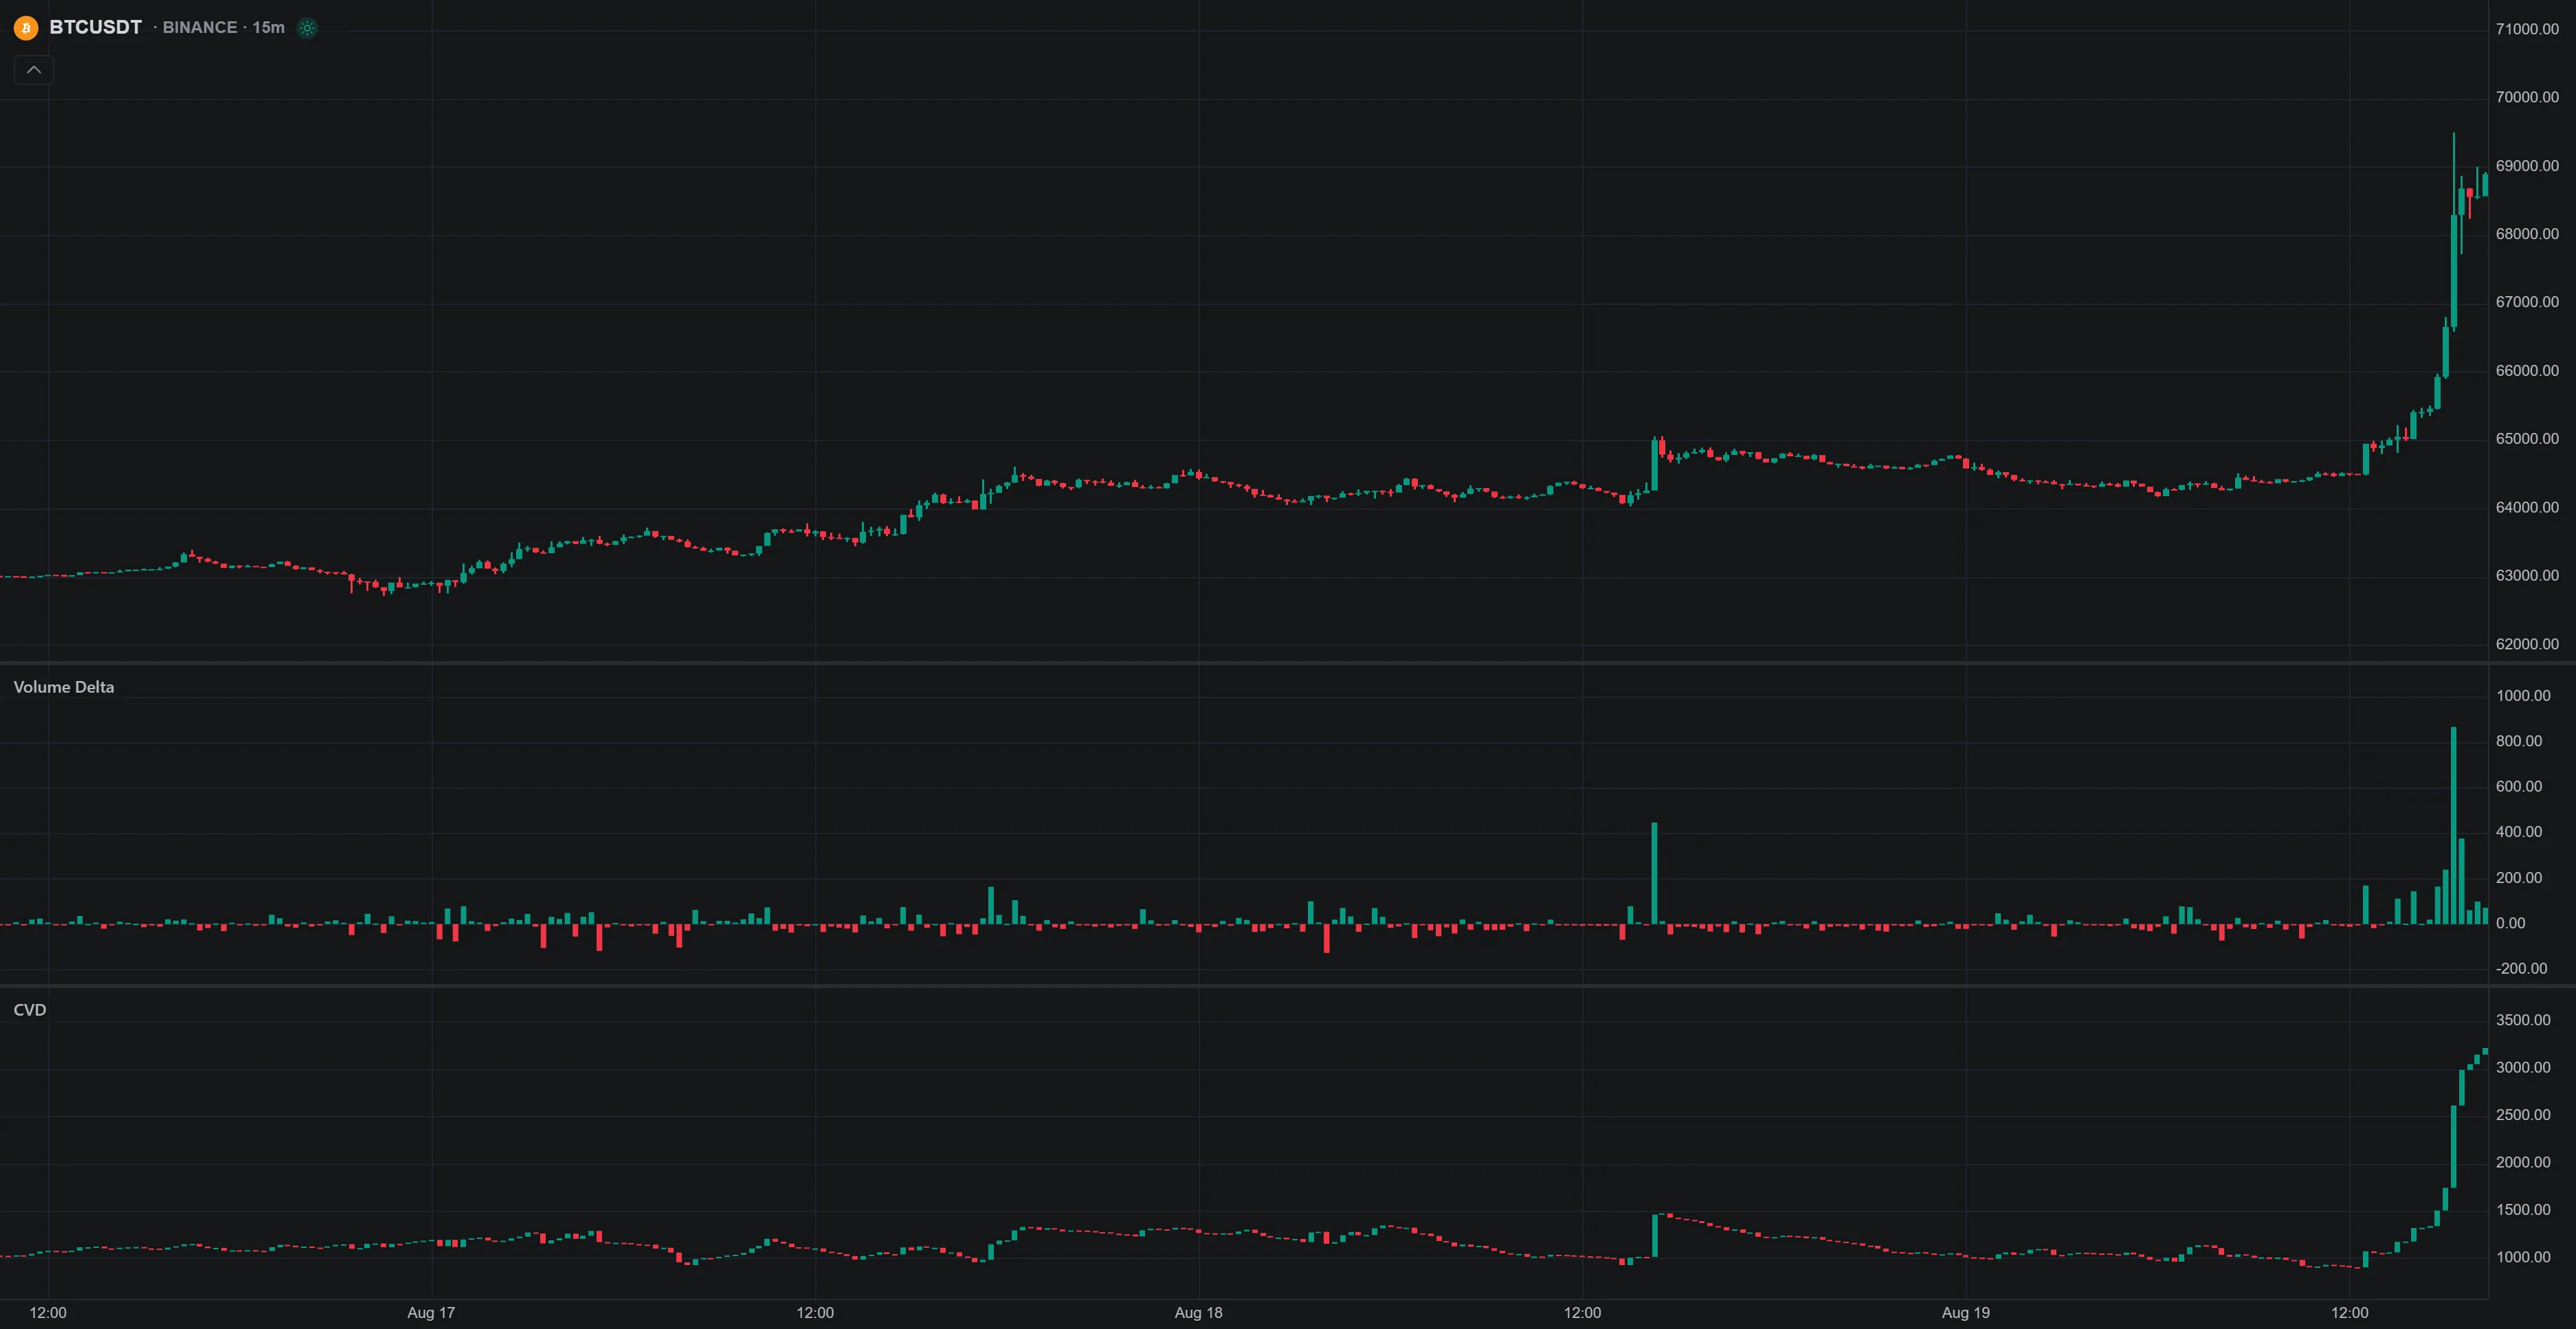
Review the range and breakout on native charts, and use indicators with defined inputs to make the conditions repeatable. Where the selected market and data coverage support it, volume delta, footprints, and volume profiles can add information about activity at prices. Check the data coverage and history limits before relying on that information.
Keep chart context separate from programmed entry conditions. Seeing an order-flow pattern does not mean a generated strategy can automatically access or reproduce that exact dataset, and a momentum or structure tool from the Library is not universal confirmation that a breakout will hold.
Risk Rules for Position Scaling
A Three-Step Risk Control System
- Limit the combined position. Choose an account-level risk allowance and exposure limit before the trade. Apply them across the full planned sequence and consider other correlated positions. No fixed percentage is suitable for every account or strategy.
- Define stop updates. Specify the trigger, reference price, and whether the stop may only tighten. An ATR-based line can move away from price if ATR expands unless the rule explicitly prevents this. See ATR stop-loss methods for those distinctions.
- Define partial exits and the remainder. State whether each percentage refers to the original position or the quantity still open. Reconcile pending orders after fills and specify whether new additions stop once profit-taking starts.
Moving a stop to the weighted average entry does not guarantee a break-even result after costs, and stop prices are not guaranteed execution prices. A gap can exceed the planned loss; a stop-limit can fail to execute. The SEC’s order-types guidance explains these execution differences.
Profit Targeting Rules
Make the price reference explicit when using ATR targets. In the example above, a first target 2.5 ATR above the initial $50 fill is $55, and a second target 4 ATR above it is $58. Those distances are different from targets measured from the later weighted average entry.
If the position reaches all 60 shares before any exit and you sell 20 at $55 and the remaining 40 at $58, proceeds are $3,420 against an entry cost of $3,100: a $320 profit before costs. That is less than the $340 planned loss at the unchanged stop. A “4 ATR target” does not mean the whole trade earns four times its risk.
If only the first entry fills, or the first target is reached before later additions, the quantities and outcome change. Include those branches in the plan. In faster markets, calculate the effect of changing stop distance and size together: halving quantity while doubling stop distance leaves the same planned loss before costs.
Testing Scaling Methods
Testing Across Market Conditions
Compare the scaled sequence with a simpler baseline using the same breakout definition, data period, and realistic execution assumptions. Review failed breakouts, strong continuations, gaps, and incomplete entry sequences. Separate the effect of entry timing from the effect of carrying less exposure.
Choose enough relevant history and trades to investigate the strategy; a universal “five to ten years” requirement does not fit every timeframe or data source. Test additional markets individually when they are part of the intended use. Success on one instrument does not establish broad applicability.
Keep a period out of the rule-selection process, and avoid repeatedly tuning against it. If using walk-forward evaluation, define training and subsequent evaluation windows in advance. Testing may reveal that scaling is worse than the baseline; it cannot guarantee an improvement in risk-adjusted returns.
Reviewing the Strategy with LuxAlgo Quant
Describe the breakout, frozen or changing ATR reference, permitted additions, quantity budget, and partial exits to Quant. Review the generated code and run it on the intended chart. Check repeated signals, pyramiding, stop coverage, and cases where only part of the sequence fills.
In strategy settings and results, set capital, order size, costs, and margin consistently. Use exposed Inputs for parameter changes and Quant for logic changes. A percentage order-size property is not itself a percentage-risk calculation.
Read net profit, win rate, profit factor, drawdown, and the trade log together. There is no universal pass mark of 60% win rate, 2.0 profit factor, or 20% drawdown. Results also depend on the sample and sizing. Group partial fills consistently so several profitable exits do not artificially inflate the apparent number of winning trades.
Change the symbol or timeframe and rerun when comparing datasets. Star useful runs to preserve their configuration. Do not assume a backtest automatically adapts parameters live, runs a simultaneous portfolio test, or includes Monte Carlo and walk-forward analysis. Those require their own defined methods and verified implementation.
Putting Breakout Scaling into Practice
Practice the complete order sequence before committing capital: first entry, additions that qualify or fail, partial exits, and the final stop. Record intended quantities and actual fills, then compare the combined outcome with the original budget.
Scaling earns a place in a breakout strategy when its measured exposure, cost, and return tradeoffs fit the plan. Keep the rules explicit enough to audit, and use LuxAlgo’s chart-and-Quant workflow to test what changes when a breakout develops differently from the ideal example.
Read next