Technical Indicators: What Works & What Fails Traders
A useful technical indicator answers a defined question with information available at the time of the decision. It can make trend, momentum or volatility easier to assess. That usefulness is different from proving that a trading rule will remain profitable after costs.
Evaluate the calculation, the timing of its output and whether it adds information to the tools already on the chart. Popularity, attractive colors and a few well-placed historical signals cannot establish those properties. The most useful question is what the indicator contributes to a specific, testable process.
What an Indicator Does—and What It Does Not Establish
Technical indicators transform market data into a measure or visual representation. A moving average summarizes recent prices; a momentum calculation compares prices across a chosen interval; a volatility measure describes variation. These transformations can simplify a chart without creating new underlying observations.
The debate about technical analysis often concerns a different question: whether a rule based on available market information can earn persistent returns after costs and risk are considered. A descriptive indicator can be useful even when it does not provide a profitable standalone entry rule. Conversely, a promising historical strategy needs more evidence than a readable chart.
| Purpose | Useful question | What still needs testing |
|---|---|---|
| Trend | Is the chosen price measure rising or falling? | Whether acting on that condition improves the strategy |
| Momentum | How has price changed over the defined interval? | Whether the change persists or reverses under the tested conditions |
| Volatility | How much has the measured series varied? | Whether the estimate is suitable for the proposed sizing or exit rule |
| Market structure | Where did a defined swing or level become identifiable? | When the level was actually known and how it affected decisions |
Complexity and Adaptivity Are Not Proof of an Edge
Computing tools make it easier to create indicators, adjust settings and display multiple calculations. A more complex formula may answer a useful question, but complexity alone does not establish better trading results. It can also add parameters and opportunities to fit historical noise.
Adaptive indicators, including tools described as KAMA or FRAMA, vary their response according to a measure of the data. The relevant comparison is a specific implementation against a simpler alternative using the same market, dates, costs and decision rules. Neither “adaptive always wins” nor “adaptive never helps” follows from the label.
Adaptation also does not remove design choices. The measure used to adapt, its bounds and the way signals become trades still require decisions. Document them and test whether the result depends on a narrow combination of settings. A parameter choice that looks ideal in one sample may be fragile elsewhere.
Separate Indicator Quality from Strategy Performance
An indicator does not specify a complete trade by itself. A strategy also needs entry timing, exits, sizing and execution assumptions. Comparing two tools using different exits or different costs can mistakenly attribute the difference to the indicator.
Begin with a simple baseline and change one meaningful element at a time. If the proposal is that a filter improves a breakout rule, compare the breakout with and without that filter. Record the trades removed as well as the trades retained. A higher winning proportion can coexist with lower net profit or larger losses.
Use a later period that was not used to choose the settings, and record how many alternatives were tried. Repeatedly selecting the strongest result from many experiments increases the chance of choosing a coincidence. A single unused period is useful evidence, but not a guarantee that future conditions will match it.
Include plausible fees and slippage. For a hypothetical set of trades with $120 of gross gains, $80 of gross losses and $60 of costs, the net result is −$20. A visually convincing signal can still fail to overcome the expense of acting on it.
Look for Redundant Information
Two indicators can look different while expressing closely related information. Multiple moving averages or momentum measures may largely respond to the same price changes. Agreement between them should not automatically be counted as independent confirmation.
The original article’s momentum example offers an exact relationship. Let P(t) be the chosen price input and let SMA(n,t) be its n-observation simple moving average, using equally weighted consecutive observations. Then:
SMA(n,t) − SMA(n,t−1) = [P(t) − P(t−n)] ÷ n.
The intermediate observations cancel when one rolling average is subtracted from the previous one. For positive n, the change in that SMA therefore has the same sign as the unnormalized n-period momentum P(t) − P(t−n), provided both calculations use the same input and aligned observations.
For example, if the latest input is 110, the input five observations earlier is 100 and n is 5, momentum is 10 and the one-observation change in the five-period SMA is 2. Plotting both can illustrate the relationship; it does not provide two independent pieces of directional evidence.
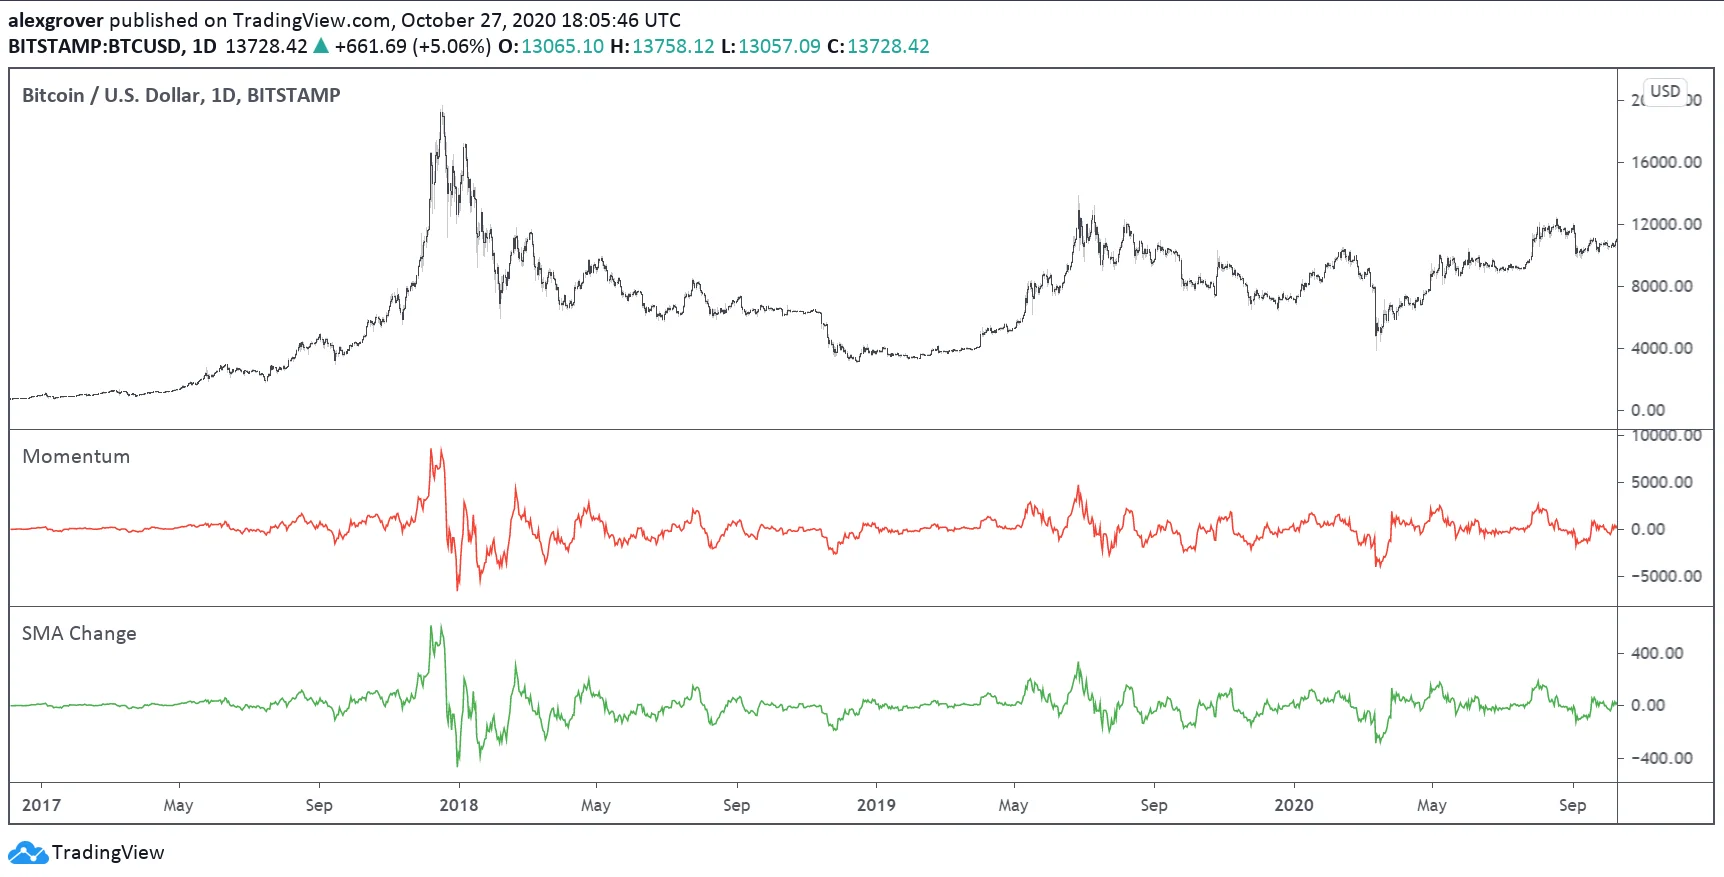
This identity is specific to an arithmetic price difference and a simple moving average with matching observations. It is not a general identity for RSI, percentage rate of change or every type of moving average. Differences in scaling and smoothing can also change how a tool is interpreted.
Use Ribbons When the Additional Lines Have a Job
A moving-average ribbon displays several averages, often across a range of periods. It can make the ordering, spread and convergence of those measures visible. Whether that helps depends on what decision uses those properties.
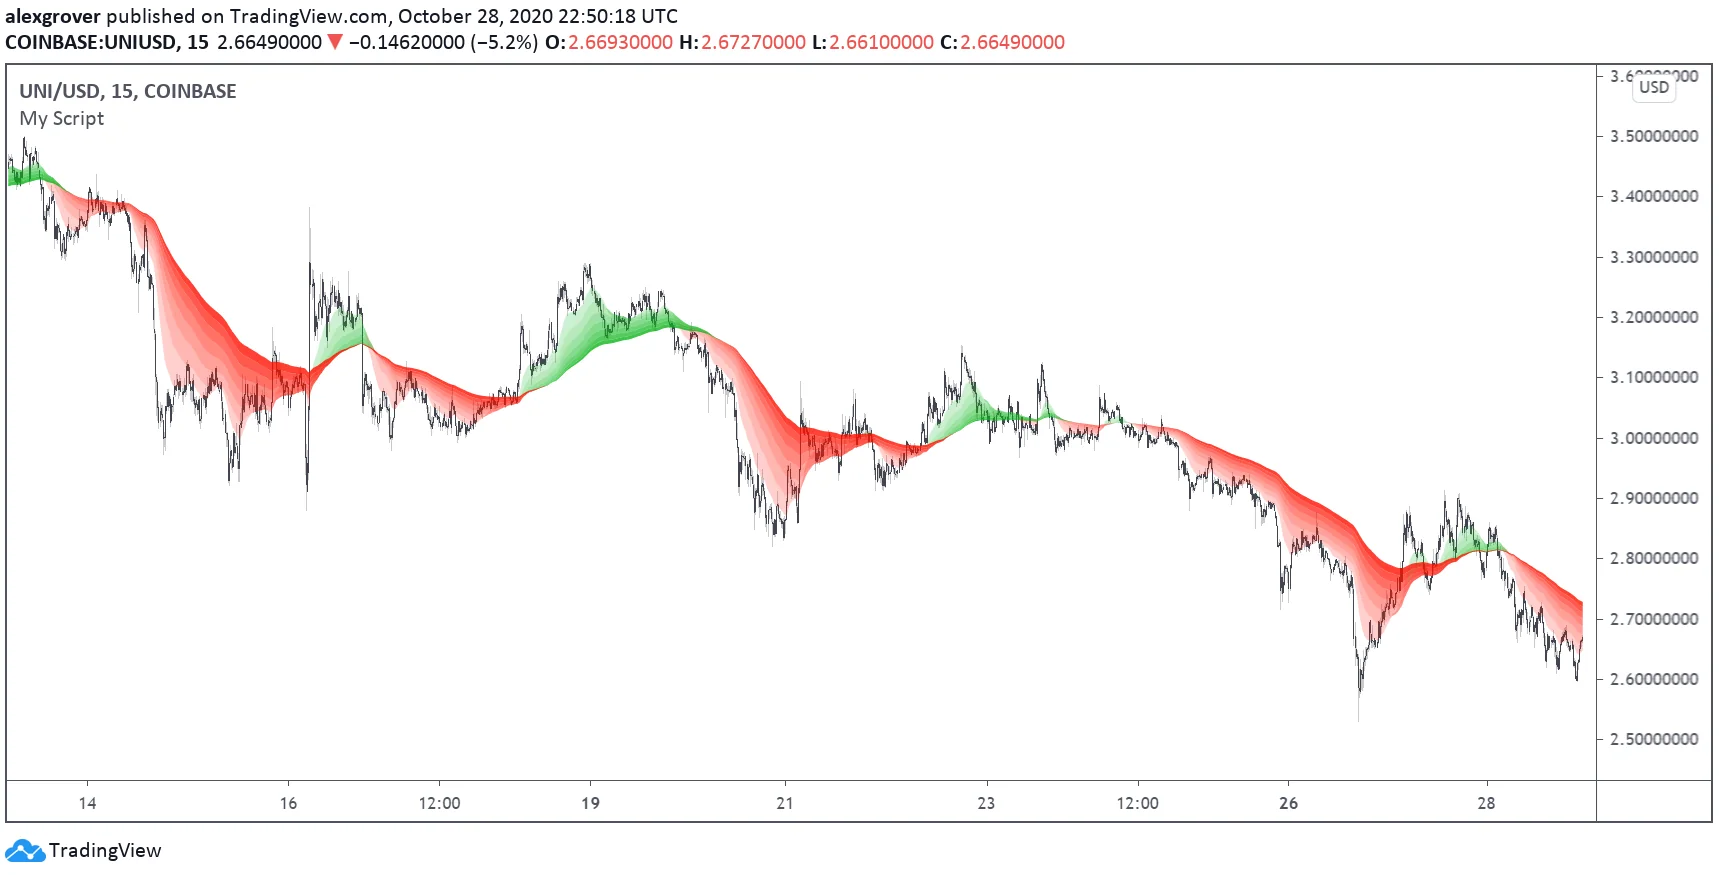
If adjacent lines provide nearly identical information and do not change a decision, a simpler display may be easier to interpret. If the spacing between defined averages is part of a tested rule, retain the lines needed to express it. Remove clutter according to purpose, rather than assuming every multi-line tool is either superior or useless.
Readability matters because users must understand the information. It does not establish predictive power. A clear legend, sensible scaling and visible limitations are more useful evaluation criteria than assuming a colorful or popular tool is technically stronger.
Understand the Different Meanings of Repainting
TradingView’s repainting documentation distinguishes historical and real-time behavior. The important question is not only whether a script repaints, but which values can change and when a usable signal becomes known. The following timing distinctions apply when assessing a tool; Pine-specific implementation details remain part of the TradingView workflow.
| Behavior | What happens | How to assess it |
|---|---|---|
| Open-bar updates | A calculation changes as the current bar develops | Decide whether the rule acts during the bar or waits for confirmation |
| Higher-timeframe updates | An unfinished higher-timeframe value changes | Use the information that was available at the actual decision time |
| Delayed pivot confirmation | A swing needs later observations before it can be identified | Record confirmation time separately from the swing’s chart location |
| Future information in historical decisions | A test uses information not yet available at the stated entry | Correct the test before interpreting its performance |
| Data or history changes | Revised inputs or a different history can change calculations | Record the source, history and calculation assumptions |
An indicator that updates on an open bar is not automatically deceptive or unusable. For example, an unfinished bar’s price can cross a threshold and later move back before closing. Historical bars show the completed result, which may differ from what was visible partway through that bar.
Waiting for a confirmed bar can make the rule easier to reproduce, but it delays the decision. The test must use that later timing rather than retaining the earlier price as if confirmation were already available. A slower, reproducible decision and an earlier, changing observation are different choices.
A Pivot’s Location Is Not Its Confirmation Time
A pivot rule can require observations to the right of a possible swing. If a rule needs three completed bars after a candidate high, that high cannot be confirmed by that rule until those bars exist. Drawing the marker back at the high identifies its location; it does not make the information available three bars earlier.
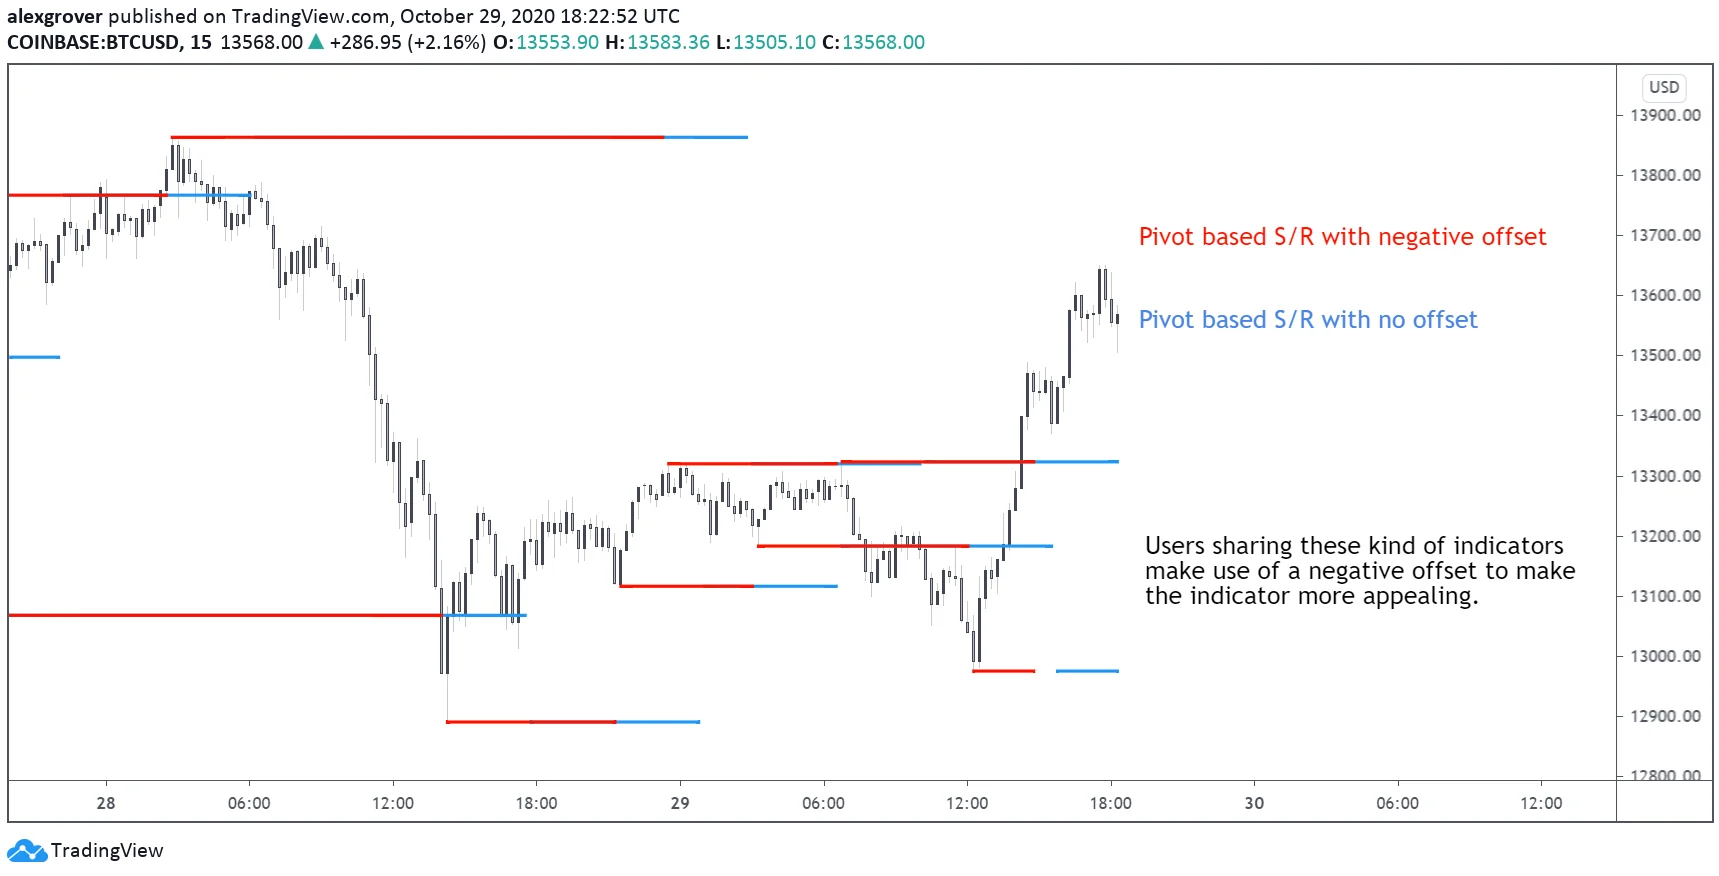
A historical test should act no earlier than the confirmation used by the rule. A level drawn backward can still be useful for describing structure when the delay is clear. It becomes misleading if the presentation or performance calculation treats the later discovery as an earlier actionable signal.
Distinguish a confirmed pivot from an estimate of a developing swing. Both may be shown on a chart, but they have different uncertainty. Check documentation and observe the tool over time instead of inferring its real-time behavior from a finished screenshot.
Build a Repeatable Indicator Review
- Name the question the tool is intended to answer.
- Record the input, timeframe, settings and required history.
- Identify when the output becomes available and what can change afterward.
- Compare the tool with a simpler baseline and remove redundant conditions.
- Test complete trading rules with realistic costs and an unused period.
- Inspect individual trades, losing periods and sensitivity to nearby settings.
- Keep a record of changes so a favorable result can be reproduced.
Robustness does not mean an indicator must profit with every possible setting. It means the evidence should fit the intended use and should not depend on an unexplained, isolated choice. Investigate why nearby settings or another period produce very different results before relying on the result.
Test a Defined Idea in LuxAlgo’s Native Charts
Start with the question rather than a crowded chart. In LuxAlgo’s native charts, compare a defined condition across relevant symbols and timeframes while keeping the assumptions visible. A different timeframe changes the observations used by a fixed-period indicator, so it requires another test.
Ask Quant, our coding agent to help express a supported strategy hypothesis. Inspect the generated code and run it manually. Check strategy settings, costs and individual trades before comparing another sample. Generated code still needs to match the intended calculation and timing.
Review native data coverage when comparing platforms. The documented US-equity source is Cboe EDGX rather than a consolidated all-venue feed. Data coverage, sessions and history can explain differences that are incorrectly blamed on an indicator formula.
A useful indicator makes a defined part of the market easier to understand. Whether trading on that information helps requires separate evidence about timing, costs, risk and behavior across conditions. Keep those two evaluations distinct when choosing what belongs on a chart.
Frequently Asked Questions
Is there one technical indicator that works in every market?
There is no universal result established by an indicator’s name or popularity. Evaluate the specific calculation and complete decision rule for the intended market, timing, costs and conditions.
Does combining several indicators provide independent confirmation?
Not necessarily. Tools based on the same prices can repeat closely related information. Compare what each adds and test whether the extra condition improves the defined process.
Is every form of repainting misleading?
No. Open-bar updates can be expected behavior. The important questions are what changes, when a signal becomes available and whether historical decisions use information that existed at the time.
Can a pivot marker be traded at the bar where it is drawn?
Only if the information required by the rule was available then. A pivot confirmed by later bars cannot be treated as known at the earlier swing merely because its marker is drawn there.
How can LuxAlgo help evaluate an indicator-based idea?
Use native charts and Quant to express a defined, supported strategy hypothesis. Inspect generated code and run it manually, review timing and costs, and compare an unused period rather than relying on a finished chart.
Read next