Shareholder Equity — Balance Sheet Health Gauge

Shareholder equity is the line on the balance sheet that belongs to the owners. The SEC's Beginners' Guide to Financial Statements defines it as the money that would be left if a company sold all of its assets and paid off all of its liabilities, and describes it as the amount owners invested in the company's stock plus or minus the company's earnings or losses since inception, less any earnings distributed as dividends. Because it is a residual, it moves with everything else: profits raise it, losses and dividends lower it, share issuance adds to it and buybacks subtract from it. This guide explains what sits inside the equity line, how the ratios built on it are calculated and why the SEC cautions that acceptable values vary by industry, how to read the statement that tracks its changes, what a negative balance does and does not mean, and how to screen for balance sheet health in Quant Charts. It quotes no company figures, because the point is the method.
What Shareholder Equity Is
The SEC guide summarizes a balance sheet in one equation: assets equal liabilities plus shareholders' equity. Assets are things the company owns that have value, including cash, inventory, property and intangibles such as patents. Liabilities are amounts owed to others: bank debt, payables, payroll, taxes and obligations to deliver goods or services. Equity is whatever is left, which is why the guide calls it capital or net worth. A balance sheet is a snapshot at the end of a reporting period; it does not show the flows during the period, which is what the other statements are for.
Two features of the definition matter for reading equity as a health gauge. First, assets are recorded largely at historical cost less depreciation, so book equity is an accounting figure, not a market appraisal. Second, equity can be negative: a company whose liabilities exceed its recorded assets shows a deficit. What that deficit means depends on how it arose, which the components below reveal.
The Components of the Equity Line
The equity section of a balance sheet is usually broken into a few captions, and the mix tells a story.
- Paid-in capital. The amount shareholders paid the company for its shares when they were issued, shown as the par value of the shares plus additional paid-in capital above par. This is the "amount owners invested" half of the SEC's definition.
- Retained earnings. The cumulative earnings the company has kept rather than distributed. The SEC guide notes that companies sometimes distribute earnings instead of retaining them, and calls those distributions dividends. A long record of positive retained earnings means the business has, on balance, earned more than it paid out; an accumulated deficit means the reverse.
- Treasury stock. Shares the company has bought back and holds, recorded as a deduction from equity. Large buyback programs can drive total equity down, and even below zero, in a business that is profitable and generating cash.
- Accumulated other comprehensive income. Gains and losses that bypass the income statement, such as certain currency translation and investment revaluation effects.
- Preferred stock. Where a company has issued it, preferred equity is shown separately. Investor.gov explains that preferred stockholders usually do not have voting rights but receive dividends before common stockholders and have priority over them if the company is liquidated, after bondholders.
The distinction between the first two captions is the one investors use most. A company whose equity is mostly paid-in capital has been funded by its shareholders; one whose equity is mostly retained earnings has funded itself from profits. Neither is automatically better, but the second is the pattern of a mature, self-financing business.
Common Stock, Preferred Stock and the Order of Claims
Investor.gov's overview of stocks describes the two main kinds. Common stock entitles owners to vote at shareholder meetings and to receive dividends when declared. Preferred stock usually carries no vote but is paid dividends first and ranks ahead of common in a liquidation. The same page sets out the full order of claims in a bankruptcy: bondholders are paid first, then preferred stockholders, and common stockholders are last in line. Shareholder equity as reported is the residual after all liabilities; common equity is the residual after preferred claims as well, which is the figure to use in per-share calculations for common shares.
The Ratios Built on Equity
Equity is the denominator or numerator in several of the ratios the SEC guide lists, and the guide's general rule applies to all of them: desirable ratios vary by industry.
- Debt-to-equity. The SEC guide defines it as total liabilities divided by shareholders' equity, both from the balance sheet, and gives the reading: a reading of 2 to 1 means the company has two dollars of debt for every dollar shareholders have invested, so it is taking on debt at twice the rate its owners are investing. Some analysts use only interest-bearing debt in the numerator; the filing's own presentation should say which.
- Return on equity. Net income divided by shareholders' equity, usually the average over the period. It measures how much profit the business earns on the owners' capital. Because leverage shrinks the denominator, a highly indebted company can post a high return on equity while carrying more risk, so the ratio is read together with debt-to-equity.
- Book value per share. Common shareholders' equity divided by shares outstanding, the accounting value attributable to each share. Comparing it with the market price gives the price-to-book ratio, which is low for asset-heavy businesses and high for companies whose value lies in intangibles the balance sheet does not record.
- Equity to assets. Shareholders' equity divided by total assets, the share of the balance sheet funded by owners rather than creditors. It is the complement of the leverage picture: the lower the figure, the thinner the cushion between asset values and liabilities.
- Working capital. Not an equity ratio but a companion to it. The SEC guide defines it as current assets less current liabilities, the money left if the company paid the debts due within a year from the assets expected to turn into cash within a year.
| Measure | Formula | Statement | What a change signals |
|---|---|---|---|
| Shareholders' equity | Total assets minus total liabilities | Balance sheet | Cumulative result of profits, losses, issuance, buybacks and dividends |
| Debt-to-equity | Total liabilities divided by shareholders' equity | Balance sheet | Rising: more creditor funding per dollar of owner funding |
| Return on equity | Net income divided by average shareholders' equity | Income statement and balance sheet | Rising with rising leverage deserves a second look |
| Book value per share | Common equity divided by shares outstanding | Balance sheet | Falling while price rises widens price-to-book |
| Equity to assets | Shareholders' equity divided by total assets | Balance sheet | Falling: thinner cushion against asset write-downs |
| Working capital | Current assets minus current liabilities | Balance sheet | Negative: short-term obligations exceed short-term resources |

The Statement That Tracks the Changes
The SEC guide names a fourth financial statement, the statement of shareholders' equity, which shows changes in the interests of the company's shareholders over time. It reconciles the opening equity balance to the closing one, line by line: net income or loss for the period, dividends declared, shares issued for cash or for employee compensation, shares repurchased, and other comprehensive income. Reading it answers the question a single balance sheet cannot: did equity fall because the company lost money, because it paid out more than it earned, or because it bought back its own shares? Those are three different situations with three different implications for an investor, and the statement of changes separates them.
Reading Retained Earnings and Negative Equity
A rising retained earnings balance means the company has been profitable after dividends over its life. A declining balance has three common causes. The company may be losing money, which shows on the income statement. It may be paying dividends in excess of earnings, which shows in the statement of changes and the cash flow statement's financing section. Or it may be running buybacks that reduce total equity even though retained earnings themselves are growing, in which case the fall shows in the treasury stock line, not in retained earnings.
The same logic applies to negative total equity. A deficit produced by cumulative losses is a solvency warning, particularly when paired with negative working capital. A deficit produced by buybacks and dividends at a company with strong operating cash flow is a capital-allocation choice, and the cash flow statement, which the SEC guide says tells you whether the company generated cash rather than merely reported a profit, is where the two cases separate. The SEC guide's advice to read the footnotes and the Management's Discussion and Analysis applies with force here, because management is required to discuss known trends and uncertainties that would materially affect the reported figures.
A Balance Sheet Health Checklist
- Is total equity positive, and if not, did the deficit come from losses or from buybacks and dividends?
- Is retained earnings growing, flat or shrinking, and does the trend match the income statement?
- How does debt-to-equity compare with the company's own history and with its sector, per the SEC's caution that ratios vary by industry?
- Is return on equity being earned on a stable equity base, or is it being inflated by a shrinking one?
- Is working capital positive, and is operating cash flow covering dividends and buybacks?
- What do the footnotes and MD&A say about debt covenants, off-balance-sheet obligations and restrictions on distributions?
Where Quant Charts Fits
The Financials tab as a first screen. Put a list of candidates on a watchlist in Quant Charts and open the Advanced view. The Financials tab shows revenue, net income, EPS, P/E, dividend per share, yield and beta for each stock, with year-over-year growth where it exists, and column headers sort while header filters narrow by number or checklist. Net income and its growth are the income-statement half of the retained-earnings story; a company whose net income has been positive for years and whose dividend is well covered is the profile this article describes. Balance sheet captions themselves, equity, liabilities and treasury stock, are read in the 10-K, which Investor.gov's guide to researching investments explains how to find on EDGAR.
Group by sector before comparing. The SEC's rule that desirable ratios vary by industry is built into the Advanced view: Group by clusters the Price and Financials rows by sector, so a utility's leverage is compared with other utilities and a software company's with other software companies. Sections let you keep your own groupings, for example "equity growing" and "review footnotes", saved with the list.
The video below shows how favorite tools are arranged and reached through the wheel in Quant Charts.
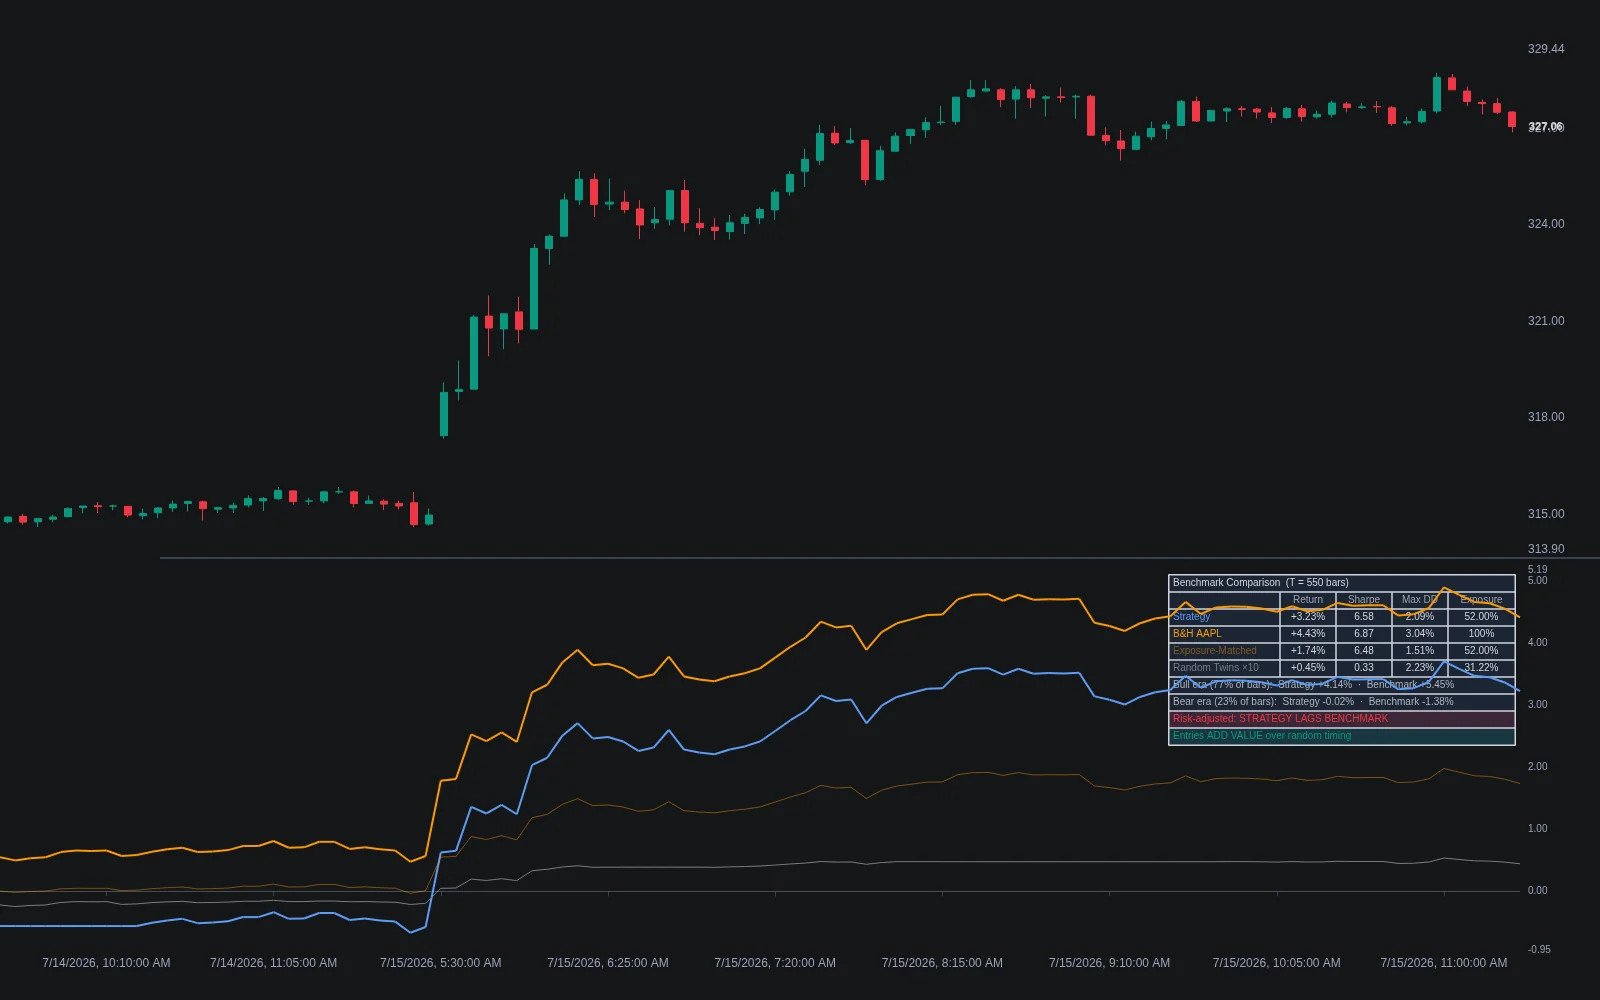
Quant tests the price side. A balance sheet screen chooses which companies to hold; a price rule decides when. Describe the rule to Quant, our coding agent, in plain language, for example buying a screened stock when it closes above its 200-day average and exiting when it closes below, and Quant writes the Pine Script. Open Code to inspect it, then click Run. The Backtest Summary reports net profit, trade count, win rate, max drawdown and profit factor, with commission and slippage set in the strategy's Properties. Comparing max drawdown between a strongly capitalized list and a highly leveraged one is a direct test of whether balance sheet health showed up in price behavior.
The Journal records the outcome. Every plan includes the Journal, which turns broker fills or imported trades into round trips and reports results by symbol, side and hold time over any date range. Tagging positions by the balance sheet profile that admitted them shows, over time, whether the health gauge earned its place in the process. No LuxAlgo tool places orders; the Journal records trades made elsewhere.
FAQs
What is shareholder equity?
The SEC's Beginners' Guide to Financial Statements defines it as the money left if a company sold all its assets and paid all its liabilities, equal to the amount owners invested plus earnings or losses since inception, less dividends. It is the residual claim of the owners.
Is negative shareholder equity always a warning?
No. A deficit from cumulative losses is a solvency warning, especially with negative working capital. A deficit from buybacks and dividends at a company with strong operating cash flow is a capital-allocation choice. The statement of shareholders' equity and the cash flow statement show which case applies.
How is the debt-to-equity ratio calculated?
The SEC guide divides total liabilities by shareholders' equity, both from the balance sheet, and reads a 2 to 1 result as two dollars of debt for every dollar shareholders invested. The guide adds that desirable ratios vary by industry.
Why read return on equity alongside leverage?
Return on equity divides net income by shareholders' equity, so a smaller equity base from debt or buybacks raises the ratio without any improvement in the business. Pairing it with debt-to-equity shows whether the return is earned or engineered.
How do preferred shares affect equity?
Investor.gov explains that preferred stockholders receive dividends before common stockholders and rank ahead of them in a liquidation, after bondholders. Preferred equity is shown separately, and common equity per share is calculated after subtracting it.
How does Quant Charts help assess balance sheet health?
The watchlist Advanced view shows net income, EPS, P/E, dividend and yield with year-over-year growth, sortable and filterable, grouped by sector. Balance sheet captions come from the 10-K on EDGAR. Quant then backtests a price rule on the screened list and the Journal tracks the result.
References
LuxAlgo Resources
- Watchlist Advanced view (LuxAlgo Docs)
- Benchmark Comparison Discipline indicator (LuxAlgo Library)
- Making strategies with Quant, Reading a strategy backtest and Journal (LuxAlgo Docs)
External Resources
- Beginners' Guide to Financial Statements (SEC)
- Stocks (Investor.gov)
- Researching Investments (Investor.gov)
This article is educational and is not a recommendation to buy or sell any security. Ratios are defined as the SEC guide presents them; acceptable values differ by industry and should be compared within a sector.
Read next