Static vs Dynamic Support: Which Works Better?
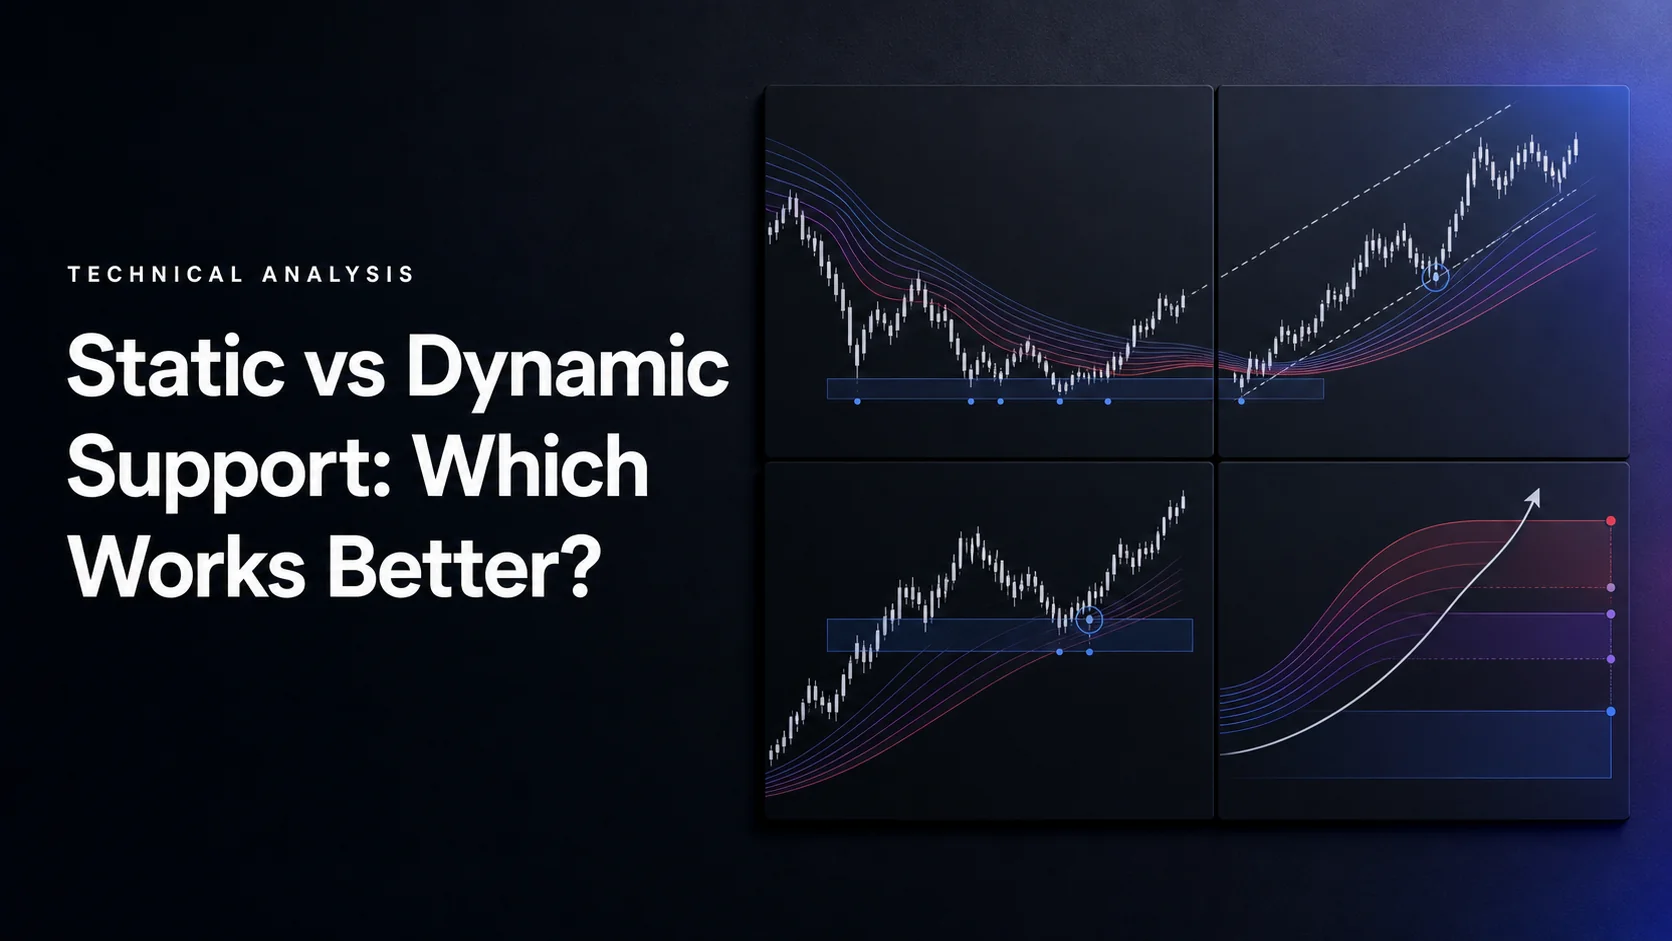
Neither static nor dynamic support is universally better. Static support fixes a price reference until you deliberately replace or invalidate it. Dynamic support recalculates from new data. Either can be used on intraday, daily or weekly charts; the useful choice depends on the setup, calculation and exit rules you can verify.
Static levels help preserve historical context. Moving averages and other dynamic references help describe changing price behavior, but they can lag or move against a position. Combining them creates another hypothesis to test, not an automatic improvement in accuracy. Use native LuxAlgo charts to examine both, and Quant, our coding agent, to help develop supported rules you can inspect and run manually.
What changes, and what stays fixed?
| Feature | Static support | Dynamic support |
|---|---|---|
| Construction | A fixed price or band from a completed reference, such as a prior low. | A recalculated value or band, such as a moving average. |
| Update rule | Changes only when the chosen reference is replaced or the level is invalidated. | Changes according to its formula and sampling interval. |
| Useful role | Historical reaction area, range boundary or possible resistance-to-support retest. | Trend context or a moving reference for pullbacks and exits. |
| Main limitation | An old reaction does not guarantee new demand; anchor choice can be subjective. | Lag, parameter sensitivity and changing values can cause whipsaws or misleading backtests. |
| Timeframe | Available on short and long horizons. | Available on short and long horizons. |
A fixed line does not have a slower calculation speed than an indicator. It has a different update policy. A long moving average can react slowly even though it is dynamic; a previous session low is static during the next session but can be immediately relevant to a day trader.
Build static support from a defined reference
Common references include previous reaction lows, completed session lows, round numbers and a prior resistance area that price has broken above. StockCharts’ support and resistance guide explains both horizontal zones and possible role reversals. A resistance break does not guarantee that the same area will subsequently hold as support.
- Historical lows: record the price, timeframe and the time the low became identifiable. A swing requiring later bars is not available at the original low.
- Repeated reactions: specify a tolerance rather than selecting only visually perfect touches. More historical tests do not guarantee that the next test will hold.
- Fixed-anchor Fibonacci: identify the completed swing endpoints before calculating retracement levels. Changing an endpoint changes the levels, so the reference is no longer fixed.
- Zones: define the boundaries before the trade. A band at 100 ±0.50 means 99.50–100.50; moving its lower edge after a loss changes the strategy.
For an illustrative completed rise from 80 to 120, a 38.2% retracement is 120 − 0.382 × 40 =104.72. A 61.8% retracement is 95.28. Those prices stay fixed while the anchors stay fixed. They identify possible reference areas, not evidence that buyers must appear there. Record an expiry or replacement rule for stale levels.
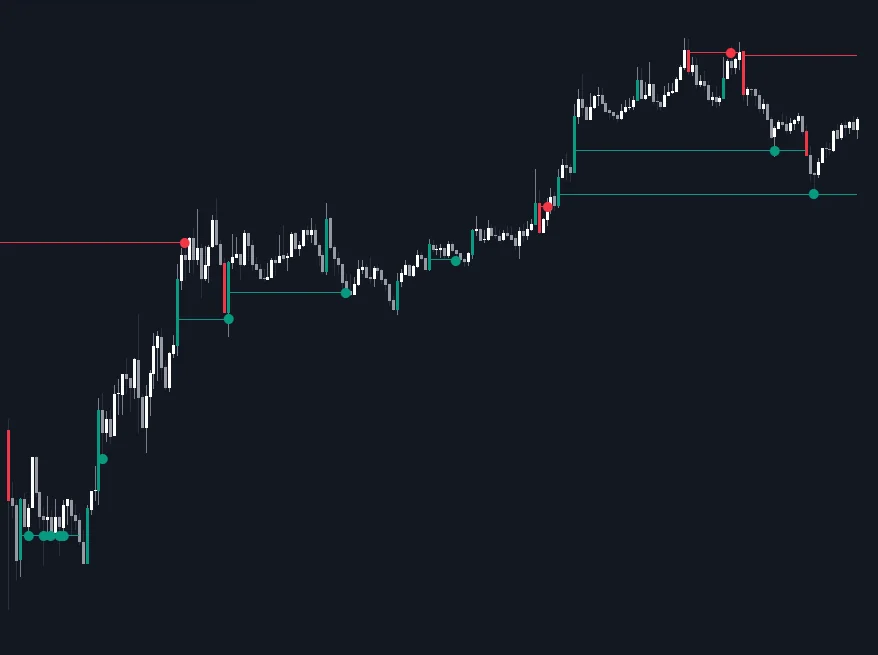
Static levels simplify planning because the reference is stable. Their weakness is not that they cannot be used in trends: a breakout retest is one possible trending-market application. The weakness is assuming that a past reaction, a round number or an old level must still matter without a current trigger and a failure rule.
Understand the dynamic calculation
A dynamic reference follows a formula. It describes price behavior; it does not cause support. Choose the price input, lookback, timeframe and whether decisions use completed bars. An unfinished bar can move an indicator value before it settles.
| Tool | How it changes | Interpretation limit |
|---|---|---|
| Moving average | An SMA rolls its sample; an EMA weights recent prices more heavily. | Both use past and current observations and can lag. A touch is not necessarily a bounce. |
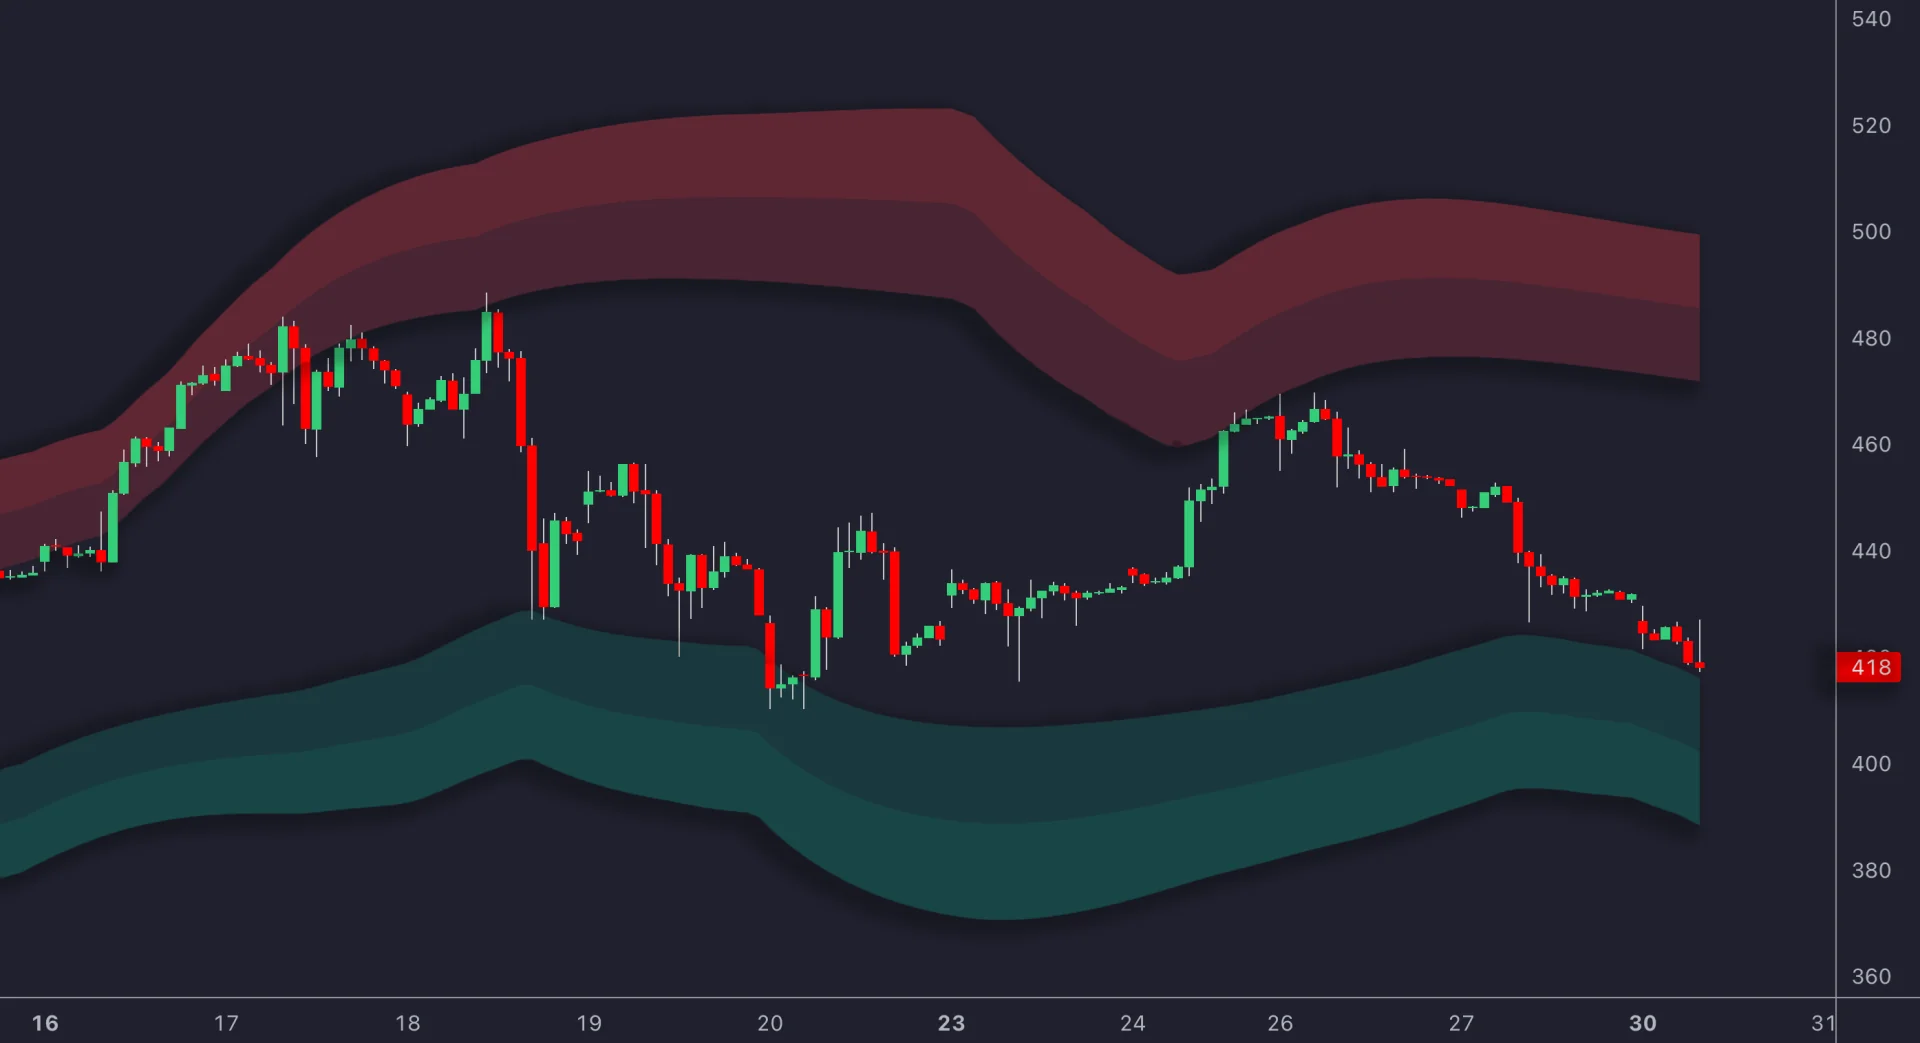
| Bollinger Bands | The center and standard-deviation width update with the sample. | A lower-band touch alone is not a buy signal; price can continue outside a band. |
| Ichimoku Cloud | Its boundaries derive from high-low midpoints and are plotted with displacement. | Forward plotting does not use future prices or prove future support. |
| Trendline | Its projected price changes with time when its anchors are fixed. | Redrawing anchors after a break changes the original rule. |
For a 20-period EMA, the usual multiplier is 2/(20+1), approximately 0.095238. With a previous EMA of 100 and a new close of 102, the updated EMA is 100 +0.095238 ×2 =100.190476. The StockCharts moving-average reference explains weighting, initialization and lag. A 20-period average on a five-minute chart is not a 20-day average.
For a hypothetical Bollinger calculation, a center of 100 and standard deviation of 2 with a multiplier of 2 gives bands at 96 and 104. The lower band moving downward does not make a losing long trade safer. John Bollinger’s rules emphasize that band tags alone are not trading signals; the default settings are starting points, not universal optimums.
With conventional Ichimoku settings, Leading Span A averages the conversion and base lines, and Leading Span B uses the midpoint of a 52-period high-low range. Both are plotted 26 periods forward. Their inputs are already observed data. In a backtest, align the values to when they were calculated rather than treating the visual displacement as advance knowledge.
Match the method to a question, not a trader label
In a range, fixed boundaries may provide a simple reference while a short average repeatedly crosses price. In a persistent trend, a moving reference may remain closer to price while old horizontal levels sit far away. These are plausible uses, not measured superiority claims. A range can break, an average can lag, and volatile conditions can defeat either approach.
Scalpers can use yesterday’s low; position traders can use a weekly moving average. Swing traders can compare both. Select the bar interval and session that match the decision, then evaluate performance under predefined conditions. Do not classify a market as trending only after a successful trend-following trade.
Define confluence and a separate entry trigger
Confluence means the references are near each other under a stated rule. Suppose fixed support is 100 and the previous completed-bar EMA is 100.20. A tolerance of 0.50 satisfies abs(100.20 −100) ≤0.50. An EMA at 101 does not. The tolerance is an illustrative test parameter, not a confidence percentage.
One candidate rule could require a completed bar to trade into 99.50–100.50 and close above 100.50, while the prior completed EMA remains within the confluence tolerance. Make entry eligible at the next available opening price. Cancel if the level has already been invalidated or if a specified number of bars passes without a trigger. A resting limit order at 100 is a different strategy with different fill assumptions.
Using the prior completed EMA for the filter makes the reference known before the signal bar. If you instead use the signal bar’s closing EMA, make that choice explicit and act only after that close. Overlap between two calculations derived from price is not independent proof of buying demand, and it does not justify a tighter stop merely because the chart looks convincing.
Keep position risk and trailing rules explicit
As a separate share-sizing example, an actual entry at 51 and a stop at 49 gives $2 of planned price risk per share. With a $200 risk budget and $20 reserved for estimated costs, floor(($200 − $20)/$2) gives 90 shares, or $4, 590 notional. A target at 55 gives $360 gross reward against $180 planned price risk, or 2R before costs. A gap exit at 46 instead loses $450 before costs.
Recalculate quantity from the actual entry and instrument multiplier. For the same budget, doubling the entry-to-stop distance halves the quantity. Choose the risk budget from account and portfolio constraints, not the number of overlapping indicators. Stops can fill beyond their planned prices.
An EMA can fall, so using its raw value as a long trailing stop can loosen risk. One explicit alternative is new long stop = max(previous stop, candidate stop), with a candidate calculated only after the bar closes and activated afterward. If the previous stop is 49 and the next candidate is 48.80, retain 49; a later candidate of 49.40 raises it to 49.40. Define how you handle an opening gap and a candidate already beyond the tradable price.
A fixed target, partial exit and moving stop produce different payoffs. Test them separately and state what happens when a bar spans both stop and target. Do not use a bar’s final EMA to claim an earlier intrabar fill unless the simulation has valid information for that ordering.
Compare the strategies in native LuxAlgo
Ask Quant to create a supported native strategy with the exact support construction, indicator calculation, tolerance, entry timing, invalidation and exits. Inspect the generated code and run it manually. Check several signals against their historical availability before interpreting the report.
- Compare static-only, dynamic-only and combined versions over the same dates, instrument and costs. Keep entry and exit assumptions comparable so you know what caused the difference.
- Review strategy Inputs and Properties, including capital, order size, commissions, slippage and margin where relevant. Include warm-up history for the EMA.
- Use only completed higher-timeframe values when the rule requires them. Account for swing-confirmation delays and avoid hindsight redrawing.
- Reserve unseen dates for evaluation. Report trade count, expectancy, drawdown and costs rather than selecting the version with the highest in-sample win rate.
- Change a limited set of parameters, then test stability nearby. A narrow best setting can reflect noise. Paper trading can help check execution behavior but does not prove future profitability.
Video: static versus dynamic support
This recorded AltosTrading lesson discusses static and dynamic support and resistance. Use it as conceptual background; historical examples and schedules mentioned in the recording are not current trading instructions.
Frequently asked questions
Is static support only for long-term traders?
No. A previous session low can be a static intraday reference, while a weekly moving average is dynamic. The distinction concerns the update rule, not a mandatory holding period.
Is dynamic support always faster?
No. A long moving average can lag substantially. A fixed level does not have a response speed; it stays unchanged until its replacement or invalidation rule applies.
Do repeated tests make support certain?
No. Repeated reactions provide historical context, but the next test can break. Keep a consistent zone definition and a failure rule.
Are Fibonacci levels static?
They are fixed while their anchor points stay fixed. Replacing a swing endpoint recalculates the levels and must be accounted for in a historical test.
Does confluence justify a bigger position?
Not by itself. Size from the chosen risk budget, actual entry-to-stop distance, costs and instrument multiplier. Overlapping price-based references do not establish independent certainty.
How should I test both methods in LuxAlgo?
Specify the rules, ask Quant for a supported native strategy, inspect the code and run manually. Compare static-only, dynamic-only and combined versions with consistent assumptions and unseen test periods.
References
- StockCharts — Support and Resistance; horizontal levels, zones and role changes.
- StockCharts — Moving Averages; EMA weighting, initialization and lag.
- John Bollinger — Bollinger Band Rules; interpretation and parameter limitations.
- StockCharts — Ichimoku Cloud; calculation and displacement.
- LuxAlgo — Native charts; charting workflow.
- LuxAlgo — Quant strategies and native strategy settings; implementation and testing.
Read next