Stock Price Patterns that Beat Simple Algorithms
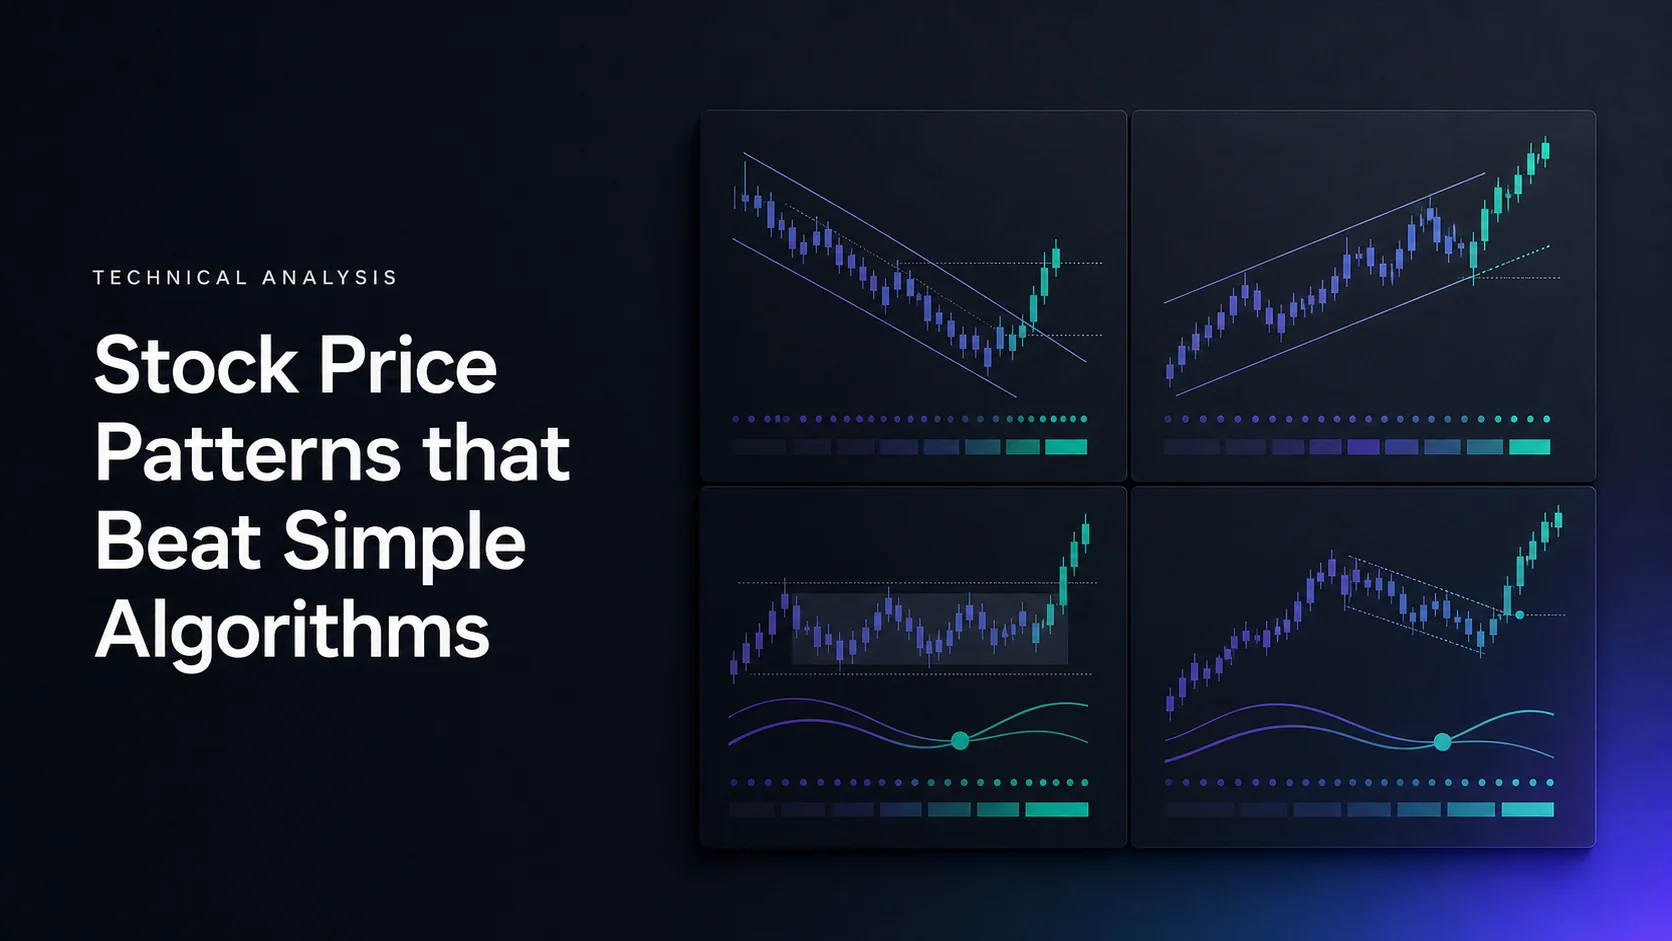
Stock price patterns can provide useful trading hypotheses, but they do not universally beat simple algorithms. An ascending triangle, cup and handle or Gartley can itself be defined algorithmically. The meaningful comparison is between specific strategies tested on the same data with comparable risk and costs.
This guide explains five patterns, where price and volume context may help, and how to evaluate an edge rather than assume one. LuxAlgo’s charting and AI platform supports that process: inspect setups on Quant Charts, then work with Quant, our coding agent, to build and compare explicit rules.
Stock Price Pattern Basics
Patterns organize recurring shapes in price history: converging boundaries, repeated tests of a level, rounded consolidations or proportional swing sequences. Candlestick and bar charts show the underlying open, high, low and close. The shape can summarize context, but its interpretation remains sensitive to the chosen timeframe and turning points.
Research by Andrew Lo, Harry Mamaysky and Jiang Wang used automatic technical-pattern recognition to investigate U.S. stock returns. It found incremental information associated with several technical indicators in its historical sample. That is evidence that patterns can be studied computationally, not proof that every pattern strategy earns superior net returns.
Volume and Price Action Analysis
Volume can help describe participation during a consolidation, breakout or failed move. It is not a truth test that certifies direction. A surge can accompany both a successful breakout and an exhaustion move that reverses.
| Observation | Possible interpretation | What to test |
|---|---|---|
| Price rises with higher volume | Participation increased during the advance | Whether a defined volume filter improves the entry rule |
| Price rises with lower volume | The advance has less reported participation | Whether subsequent returns differ after controlling for context |
| Price falls with higher volume | Selling-related activity increased | Whether the move continues or exhausts |
| Price falls with lower volume | Activity contracted during the decline | Whether support actually holds and a reversal trigger occurs |
For examples involving AAPL, TSLA, NFLX or WFC, use fixed start and end dates, adjusted prices, a consistent session and the relevant volume feed. A selected price move does not demonstrate what a competing algorithm would have earned. Its actual entries, exits and exposure must be reconstructed.
On-Balance Volume and the Accumulation/Distribution line offer different transformations of price and volume. They can become explicit filters, but they do not directly reveal all institutional positions. Likewise, a VIX condition describes a chosen volatility regime; it is not a direct measurement of every trader’s fear or greed.
Five Stock Price Patterns to Test
1. Ascending Triangle
An ascending triangle has a relatively horizontal upper boundary and rising lows below it. In an existing uptrend, it is often studied as a bullish continuation candidate. Specify how many touches qualify, the allowable slope of resistance and when each swing becomes confirmed.
A bullish entry model can require a completed close above resistance, with or without a volume filter. A break below the rising boundary challenges that bullish setup. Adding the triangle’s height to the breakout level gives a conventional projection, not a guaranteed price destination.
2. Descending Triangle
A descending triangle combines relatively horizontal support with lower highs. A bearish continuation model waits for a break below support. A move above the descending boundary is a different outcome that should not be discarded from the historical sample.
For a short strategy, define the trigger, initial stop and target alongside borrowing availability, fees and execution assumptions. Neither the pattern nor a Bollinger Band strategy has a fixed failure rate simply because the market is volatile.
3. Symmetrical Triangle
A symmetrical triangle has lower highs and higher lows within converging boundaries. The slopes need not be mathematically identical. The formation shows compression; its name does not determine the breakout direction.
Choose whether the model permits both directions, follows only the preceding trend or applies a separate regime filter. Define the breakout buffer and expiry before examining the outcome. A brief excursion followed by a return inside the triangle is an important failure case to include.
4. Cup and Handle
A cup and handle is conventionally a bullish continuation setup after an advance: a rounded consolidation followed by a smaller handle near the right side. A handle in the upper part of the cup is a common quality criterion, but the exact depth and duration rules need to be fixed for a test.
A candidate strategy buys a defined break above the handle or rim resistance. A broad range alone does not make this the best pattern for range-bound markets. Measure the actual stop distance and remaining reward, and include cups that fail rather than selecting only clean breakouts.
A double top is a different structure: two peaks around resistance with an intervening trough. Its potential bearish completion occurs at a defined break below that trough. Its name alone does not establish a 73% success rate or superiority to a moving-average strategy.
5. Gartley
The modern Gartley uses five alternating points, X–A–B–C–D. In the common ratio framework, B retraces about 61.8% of XA, C retraces 38.2–88.6% of AB, and D completes near a 78.6% retracement of XA. D remains inside the XA span. The LuxAlgo Gartley guide explains the measurements and related patterns.
CD projections and tolerance conventions vary across implementations. The original two-ratio shortcut is insufficient: validate the B, C and D relationships together and state the exact permitted ranges. Matching the ratios defines a candidate reversal zone, not a high-probability trade by itself.
In the bullish version, a stop beyond X is one invalidation convention; targets and entry confirmation are separate choices. Avoid selecting ideal pivots with hindsight. If the detector needs later bars to confirm a swing, the strategy cannot trade at the earlier pivot as though it already knew the result.
Pattern Analysis vs. Basic Algorithms
What a Fair Comparison Looks Like
A moving-average crossover is a defined rule only after its lengths, price source and execution timing are specified. “MACD,” “RSI,” “Bollinger Bands” and “trend following” are broader labels, not interchangeable benchmark strategies.
| Pattern hypothesis | Possible baseline | Shared assumptions required |
|---|---|---|
| Ascending-triangle breakout | A specified moving-average crossover | Same universe, dates, exposure limits and costs |
| Cup-and-handle breakout | A specified MACD entry/exit model | Same session, entry timing and risk budget |
| Descending-triangle break | A specified Bollinger breakout model | Same shorting access and fill assumptions |
| Symmetrical-triangle break | A specified trend-following rule | Same permitted directions and regime information |
| Gartley reversal | A specified RSI reversal model | Same stop/target convention or clearly reported differences |
This table proposes comparisons; it does not report measured performance. There is no supported universal table of 68% versus 52%, 71% versus 48% or similar results for those labels. An average pattern outcome, a strategy win rate and an annualized portfolio return measure different things.
Where Simple Rules Can Fall Short
A fixed crossover may whipsaw in a range, while a reversal rule may repeatedly lose during a trend. A model using only price may miss information in a separately defined volume or volatility filter. These are testable limitations, not reasons all simple algorithms fail.
Algorithms can incorporate volume, multiple timeframes, nonlinear relationships and regime changes. Pattern trading can also be rigid, overfit or subjective. Complexity increases the number of choices that can be tuned to historical noise; it does not create an automatic advantage.
Market Psychology and Multiple Signals
Descriptions such as accumulation, hesitation and a shakeout can help organize a chart narrative. They are interpretations of observed prices and activity, not proof of participants’ intentions. Translate the relevant observation into a rule wherever possible.
For example, define “volume confirmation” as volume exceeding a specified prior average, and “trend context” as a particular moving-average slope or sequence of confirmed swings. Test each addition separately. Several correlated filters may add little information while sharply reducing the sample.
Testing Pattern Performance
- Define both strategies: include patterns, indicators, entry orders, exits, expiry and sizing.
- Fix the data: record the universe, dates, session, price adjustments and volume source.
- Use realistic execution: include fees, spread, slippage, gaps and unfilled limits.
- Prevent hindsight: respect pivot-confirmation delays and higher-timeframe bar closes.
- Separate development from evaluation: retain an untouched period and record every tested variation.
- Review failures: inspect losing trades and compare the baseline on identical dates.
Watch for survivorship bias when choosing stocks and split adjustments when interpreting historical prices. For example, an NVDA trade using $612 and $734 cannot be assigned to a particular post-split period without reconciling the price basis. The difference between those two prices alone cannot establish what a mean-reversion model earned.
Compare net returns, maximum drawdown, average win and loss, profit factor, turnover, exposure and trade count. Sharpe ratios need consistent return frequency and calculation assumptions. A “consistency score” is useful only if its definition is stated. None of these metrics supports a claim about future returns without considering uncertainty and changing conditions.
Worked Risk Example
Suppose a hypothetical ascending triangle has resistance at $50 and a $45 base. Its $5 height gives a $55 projection. If entry fills at $50.50 and the initial stop is $48, risk is $2.50 per share and potential reward is $4.50, or 1.8R before costs. The chart’s projected height is not the same as the trade’s reward-to-risk ratio.
For a $20,000 account with an illustrative 0.5% risk budget, planned risk is $100. Dividing by $2.50 gives 40 shares, worth $2,020. A stop fill at $48 loses $100 before costs; a gap exit at $47 loses $140. The risk percentage is an example rather than a universal recommendation.
To compare with a crossover model, hold the risk budget and cost assumptions constant or explain any differences. A pattern strategy does not inherently offer 3R while an algorithm offers 2R. Actual entries and exits determine both.
Manual, Automated and Hybrid Review
| Method | Useful role | Limitation |
|---|---|---|
| Manual review | Check whether labeled formations match their definitions | Slow, subjective and vulnerable to hindsight |
| Automated test | Apply explicit rules consistently across a fixed sample | Incorrect code or data can produce misleading precision |
| Hybrid process | Audit sample trades, then test and inspect exceptions | Requires disciplined definitions and review |
There is no reliable universal promise that 10,000 trades can be tested in one or two hours or that a manual reviewer processes a fixed number per day. Runtime depends on the data, rules and platform. Automating a correct process saves repetitive work; it does not remove the need to verify it.
Using LuxAlgo for Pattern Trading
Review Patterns on Quant Charts
Open Quant Charts to compare swings, levels and volume on the chosen market. Use a saved workspace for the pattern and baseline configurations so the context stays consistent. Different feeds and sessions can create different candles and volume readings.
Match the Tool to the Pattern
The Library's pattern tools draw triangles, double tops and bottoms, wedges and other supported formations on a Quant Chart. A tool's documented pattern list should not be expanded into a claim that it detects every cup and handle or harmonic setup.
Harmonic Pattern Detection uses manually placed X–A–B–C–D vertices to classify Gartley, Bat, Butterfly or Crab structures and show measured ratios. It is not the same as an automatic watchlist scanner. Ratio precision changes classification and should be kept consistent.
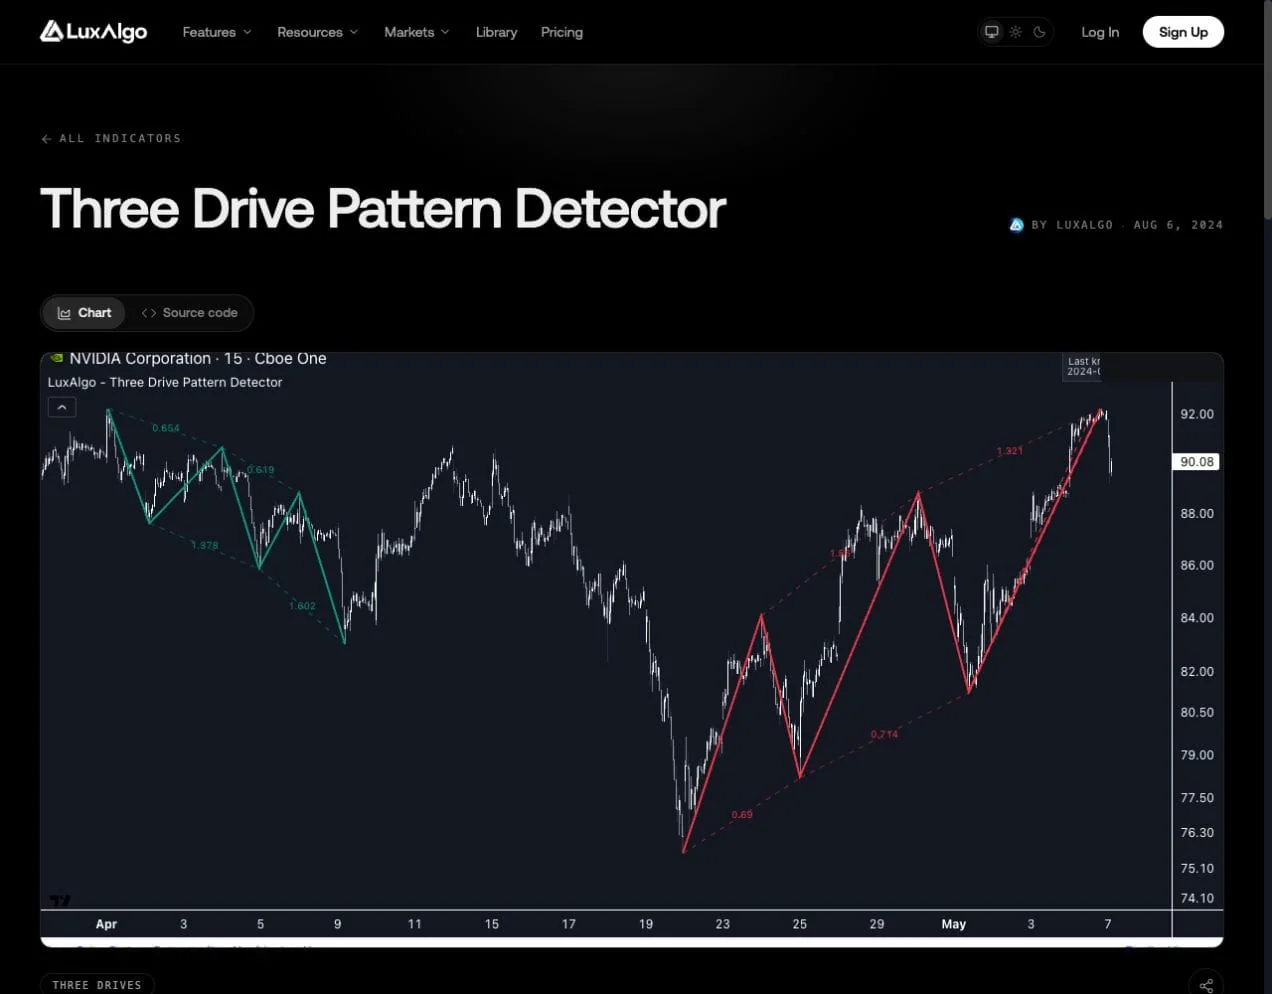
The Three Drive Pattern Detector evaluates multiple swing lengths for its specific harmonic sequence. Its ratio, width-margin and calculated-bars settings change the formations it displays. It does not draw trade exits or provide a general proof of pattern quality.
Detection, Screening and Alerts
Detecting a formation on one chart differs from screening a watchlist. Check the exact screener’s supported features and markets before assuming that a study scans every asset. An alert also needs an explicit event and timing rule; it is not an entry fill or a managed position.
Review current plan access before assuming a feature is included; old subscription prices and broad “everything included” claims should not guide the setup.
Build the Comparison with Quant
Use Quant, our coding agent, to help implement the pattern rule and benchmark. Give both the same data range, initial capital, costs and risk constraints. Include exact definitions for swing confirmation, breakout buffers and failed setups.
Follow Making Strategies with Quant: inspect the generated code and click Run yourself. Then use the native backtest guide to examine fills and summary metrics. Code can run successfully while still containing incorrect logic.
Quant should not be described as automatically validating every pattern or improving returns. Keep the distinction between recognition, a completed backtest and evidence of an out-of-sample edge.
What Would Establish That a Pattern Beats the Baseline?
A credible answer comes from a documented comparison with matching assumptions, realistic costs and enough observations to assess uncertainty. It cannot be inferred from a successful chart, a pattern name or unsupported industry percentages.
Start with one pattern and one simple baseline. Use Quant Charts to inspect the observations and Quant to help implement the rules, then audit the results. Keep the simpler model if the extra complexity does not provide a robust benefit.
FAQs
Does a cup and handle automatically outperform basic algorithms?
No. A cup-and-handle strategy needs precise detection, entry, exit and cost rules. Compare it with a defined baseline on the same data. Its shape or traditional interpretation does not establish superior returns.
How can volume analysis help with price patterns?
It can provide a measurable participation filter, such as volume relative to a prior average. Test whether that filter improves the specific strategy. High volume can accompany both successful and failed moves.
Are patterns and algorithms competing approaches?
They can overlap. Pattern recognition can be implemented algorithmically, and algorithms can incorporate volume, trend and regime information. The useful comparison is between complete strategies.
What should a pattern backtest include?
Include explicit definitions, confirmed pivots, entry and exit timing, sizing, costs, gaps and a fixed dataset. Retain losing examples and evaluate an untouched period after development.
Is a high win rate enough to choose a strategy?
No. Average gains and losses, costs, drawdown, exposure and sample size also matter. A high win rate can coexist with negative expectancy if losses or costs outweigh the gains.
References
LuxAlgo Resources
- Quant Charts
- LuxAlgo Quant
- Making Strategies with Quant
- Native Backtest Guide
- Gartley Concept Guide
- Harmonic Pattern Detection
- Three Drive Pattern Detector
- LuxAlgo Pricing
External Resources
Read next