Stocks Explained: A Beginner’s Guide

A stock represents ownership in a company. Its value can rise as the business grows and investors become willing to pay more for that ownership, but it can also fall. Some companies distribute cash through dividends; others retain earnings to fund operations or expansion. Neither a rising price nor a dividend is guaranteed.
This guide explains how shares trade, what moves prices, how stock categories differ, and how to build a research process. Start by understanding the investment and the loss you could bear, rather than assuming that stocks deliver a predictable annual return.
What Are Stocks?
Investor.gov explains the basic ownership rights associated with stocks. Common shares often include voting rights, although rights vary by share class. Preferred shares generally receive priority over common shares for dividends and liquidation proceeds, but remain below creditors and are not the same as an insured deposit or a guaranteed bond payment.
When a company issues new shares, it can raise money for the business. When you buy existing shares from another investor in the secondary market, your payment generally goes to that seller. Owning a share gives you an economic interest in the company, not personal ownership of a particular office, product, or bank account.
Consider an illustrative purchase of 10 shares at $50 each: an initial $500 investment. If the shares later sell for $55 and you received $10 in cash dividends, the gain is $50 from the price change plus $10 in dividends, or 12% before costs and taxes. If the sale price is $40 instead, the same dividend leaves a $90 loss, or 18%. Dividends do not prevent capital losses.
How Does the Stock Market Work?
This TED-Ed lesson by Oliver Elfenbaum introduces stock ownership and the role of markets. The sections below turn those concepts into practical questions for a first investment.
Stock Market Basics
Stock Exchange Functions
Exchanges establish rules for listed securities and provide systems for trading. The NYSE combines electronic trading with a floor and designated market makers; Nasdaq is electronic. Both list companies from many sectors. A company’s listing venue is not necessarily the only place where its shares can trade.
The regular U.S. equity session runs from 9:30 a.m. to 4:00 p.m. Eastern Time on trading days, subject to holidays and early closes. Check the NYSE calendar and Nasdaq schedule. Extended sessions depend on the venue and broker, and can have different liquidity and order restrictions.
A quote normally shows a bid, the price someone is offering to pay, and an ask, the price someone is offering to accept. The difference is the spread. A market order prioritizes execution without guaranteeing the price; a limit order specifies an acceptable price but may not execute. Review order types before placing an instruction, especially outside regular hours.
Price Movement Factors
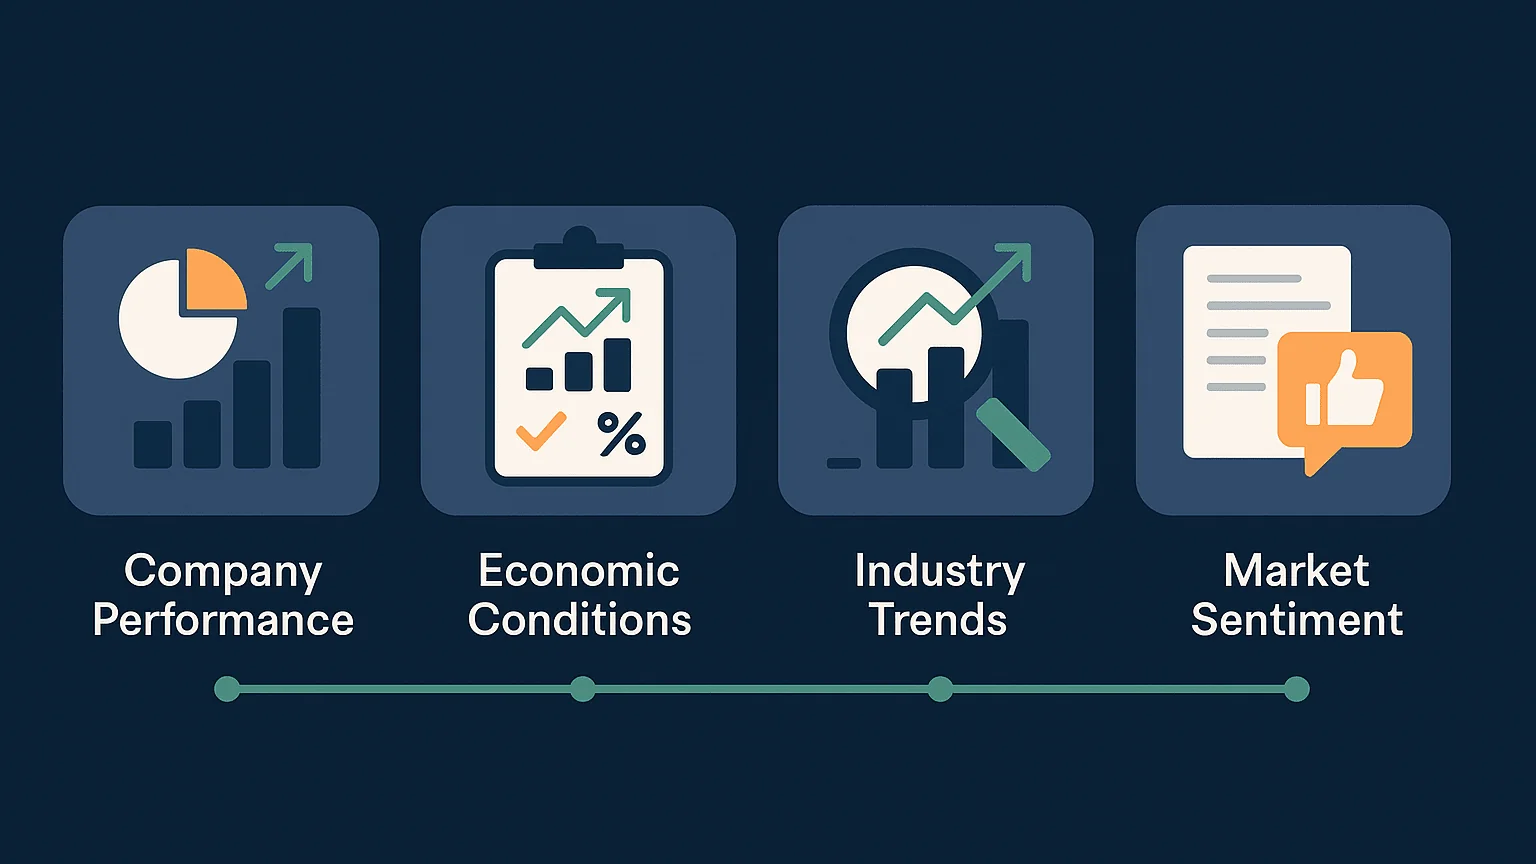
Prices change as buyers and sellers revise the prices and quantities they are willing to trade. Earnings, cash flow, financing needs, new products, competition, interest rates, and investor sentiment can all affect those decisions.
The difference between results and expectations matters. A company can report growing profits yet fall in price if investors expected stronger growth. Another can report a loss and rise if the outcome is better than feared. Separate the underlying business result from the market’s reaction to it.
Short-term price swings can also reflect liquidity or positioning. A strong business is not automatically an attractive investment at any price, and an impressive recent chart does not establish what future earnings will be.
Major Market Indexes
An index tracks a defined group of securities according to published rules. The S&P 500 and Dow Jones Industrial Average illustrate why the methodology matters: the S&P 500 uses float-adjusted market-cap weights, while the Dow uses share-price weights. The modern S&P 500 launched in 1957 and represents 500 leading U.S. companies; it is not simply an automatic list of the 500 largest businesses.
Other familiar regional benchmarks include Japan’s Nikkei 225, the UK’s FTSE 100, Germany’s DAX, and mainland China’s CSI 300. They cover different markets and use different selection rules. Compare a portfolio with a benchmark that resembles its actual holdings and currency exposure.
You cannot buy an index directly. Funds may seek to track one, with fees and differences between fund performance and the benchmark. When comparing historical returns, check the dates, whether dividends are included, the currency, and whether the figure is annualized. A long-run average is not a forecast for the next year.
Stock Categories
Growth and Value Stocks
| Style | What investors are evaluating | What can go wrong |
|---|---|---|
| Growth | Expected expansion in revenue, earnings, or future business opportunities, often at a relatively high valuation. | Growth disappoints or investors become unwilling to pay the same multiple. |
| Value | A price that appears low relative to earnings, assets, cash flow, or comparable businesses. | The low valuation reflects a lasting business problem rather than a temporary discount. |
| Income | The size, sustainability, and growth of cash distributions. | A dividend is cut, or the share-price decline exceeds the income received. |
These categories overlap. A company can grow and still trade at an attractive valuation, or pay dividends while reinvesting in expansion. “Value” does not mean consistently profitable or low volatility, and “growth” does not mean a high nominal share price. Compare valuations with the business’s prospects and risks.
Company Size Categories
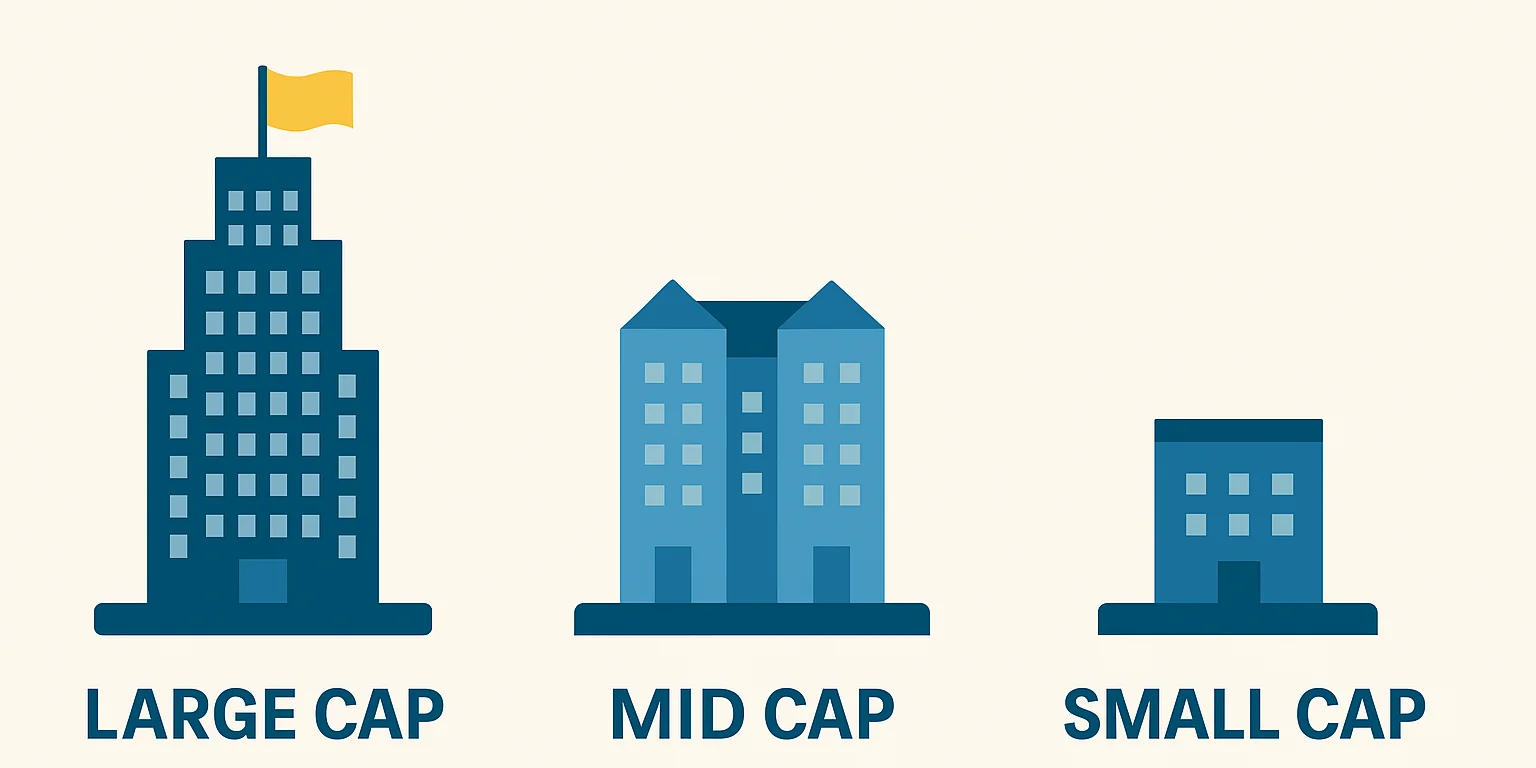
Market capitalization = share price × shares outstanding. For example, 100 million shares at $20 each produce a $2 billion market capitalization. A $10 stock can represent a larger business than a $100 stock if it has sufficiently more shares outstanding.
Thresholds vary by provider and can change. FINRA’s explanatory categories use the following approximate bands:
| Category | Illustrative market-cap band |
|---|---|
| Mega-cap | $200 billion or more |
| Large-cap | $10 billion to $200 billion |
| Mid-cap | $2 billion to $10 billion |
| Small-cap | $250 million to $2 billion |
| Micro-cap | Below $250 million |
Use the classification rules of the fund or research provider when a boundary matters. Size alone does not determine quality, growth potential, or safety. Large businesses can fail, and small companies can face funding and liquidity constraints. Avoid treating past category returns as a fixed ranking of future performance.
U.S. and Global Stocks
International exposure can broaden the businesses and economies represented in a portfolio. It also introduces questions about currencies, reporting standards, taxes, market access, and political conditions. A foreign investment’s local-currency gain can be reduced or reversed by an unfavorable currency move when translated into your home currency.
Check the underlying holdings rather than relying on a domestic or international label alone. A company listed in one country may earn much of its revenue elsewhere, and funds with different names can hold many of the same companies. Geographic diversification does not guarantee that markets will move in opposite directions during a downturn.
First Steps in Stock Investing
Setting Investment Goals
Write down the purpose of the money, when you expect to need it, and how a decline would affect that goal. A near-term house payment and retirement savings decades away create different constraints. Consider both your willingness to see losses and your financial ability to withstand them.
Age alone does not determine an appropriate stock allocation. Income stability, debt, emergency reserves, other assets, and withdrawal needs also matter. A long holding period gives an investment more time, but does not guarantee that a particular stock will recover.
Picking a Broker
Choose a broker by comparing the service you will actually use, not only its advertised commission. Availability and protections depend on your residence, account type, and the legal entity providing the account.
| Check | Questions to ask |
|---|---|
| Eligibility and oversight | Can you open the intended account, and which regulator oversees the provider? |
| Complete cost | What commissions, spreads, currency-conversion, custody, transfer, and other fees apply? |
| Investment access | Are the stocks or funds available? Are fractional shares or recurring purchases supported? |
| Account and order rules | Is it a cash or margin account? Which orders and sessions are supported? |
| Usability and support | Can you understand confirmations, obtain statements, and reach support when needed? |
For U.S. brokers and registered professionals, FINRA BrokerCheck is a starting point for background checks. Registration does not insure a stock against market losses. Read the provider’s current fee schedule and account agreement before funding the account.
Portfolio Balance
Asset allocation and diversification address different questions: how much to hold in stocks, bonds, or cash, and how to spread exposure within those categories. Neither a universal stock/bond split nor a fixed count of 15–20 stocks guarantees a suitable portfolio.
Broad funds can provide exposure to many companies, but narrowly focused funds may still concentrate risk. Review holdings, sector weights, costs, and overlap. Bonds also carry risks, including interest-rate and credit risk; they are not interchangeable with cash.
Rebalancing restores a chosen allocation after it drifts. In a simplified $10,000 portfolio initially split $6,000 stocks and $4,000 bonds, suppose stocks rise to $7,200 while bonds remain $4,000. Stocks now represent about 64.3% of $11,200. Returning to the illustrative 60/40 target means $6,720 stocks and $4,480 bonds—a $480 transfer before taxes and costs. This demonstrates the mechanics, not a recommended allocation.
Regular Investment Plans
Regular contributions can make an investment plan easier to follow. With dollar-cost averaging, a fixed contribution buys more shares at lower prices and fewer at higher prices. For example, $100 invested at $10 buys 10 shares; another $100 at $5 buys 20. The 30 shares cost $200, or about $6.67 each. At a $5 market price, however, they are worth $150, so the position is still down $50.
FINRA discusses the benefits and limitations of this approach. Investing new income regularly differs from deliberately delaying investment of an available lump sum. Holding cash longer can miss gains, and regular purchases do not guarantee profits.
Automatic transfers and dividend reinvestment can support consistency. Check fees, available cash, and tax treatment. Reinvestment buys additional shares; it does not make distributions free money or remove the need to reassess the investment.
Stock Research Methods
Company Analysis
Start with what the company sells, who buys it, how it earns cash, and what could weaken that business. Use current filings, including the financial statements and risk disclosures, rather than relying only on a summary or a promotional claim. SEC EDGAR provides filings for companies that report to the SEC.
| Research area | Useful measures | Interpretation check |
|---|---|---|
| Profitability | Operating margin and return on equity | Compare similar businesses; leverage can affect return on equity. |
| Valuation | Price-to-earnings and PEG ratios | Negative earnings and uncertain growth estimates can make simple comparisons misleading. |
| Financial health | Debt, cash flow, debt-to-equity, and quick ratio | Consider repayment dates, financing needs, and sector-specific balance sheets. |
| Growth | Revenue and earnings-per-share changes | Distinguish recurring business growth from acquisitions, one-off items, or share-count changes. |
Numbers need business context. Management decisions, competition, customer concentration, and financing terms can matter as much as the numerical measures. Compare the valuation with realistic scenarios rather than treating a low multiple as proof of a bargain.
Chart Analysis
Charts summarize price and trading activity. Higher highs and higher lows describe an uptrend; lower highs and lower lows describe a downtrend; a range describes sideways movement. These observations do not guarantee what happens next.
Daily and weekly views can help put shorter-term moves in context. Volume shows activity, but each completed transaction has both a buyer and a seller. Rising volume alone does not identify institutions or prove that a price move will continue. Keep chart observations separate from claims about the company’s value.
A Research Workflow on LuxAlgo
Use LuxAlgo’s charting platform to compare supported symbols and organize your research. Confirm the exact instrument, data source, and history first. The data documentation explains available feeds; venue-specific equity data should not be mistaken for a consolidated view of every U.S. trade.
Open Panels → Watchlist and use Add symbol to build a focused list. Selecting a row loads the symbol on the active chart. The Watchlist makes comparison easier, while company filings remain the source for verifying financial statements and business disclosures.

If you want to test a specific trading rule, use Quant, our coding agent, to help build the strategy. Specify when signals are known, entries, exits, position sizing, and costs. Review the code and run the strategy, then inspect individual trades and performance across different periods. Historical simulation does not guarantee future returns or automatically execute live orders.
Long-term stock ownership does not require coding a strategy. You can use charts and a watchlist simply to support an investment review. For trades you do make, the LuxAlgo Journal supports manual entry, imports, or supported broker connections so you can review outcomes and record why decisions were made.
Next Steps
- Define the goal: State when the money is needed and what loss would disrupt the plan.
- Understand the holding: Distinguish an individual business from a diversified fund and review the main risks and fees.
- Check the account: Verify the broker, account rules, and order mechanics before committing money.
- Practice the process: Use research notes or simulated practice to learn; keep simulated results separate from real execution.
- Review consistently: Reassess contributions, allocation, and the investment thesis as circumstances change.
Stock investing begins with ownership, valuation, and uncertainty. A clear plan, diversified exposure, and regular research can improve the quality of decisions. They cannot turn market returns into a promise, but they help you understand what you own and why you own it.
Read next