Strat Candlestick Patterns: An Innovative Guide
TheStrat is a price-action method developed by Rob Smith. It classifies each candle by its relationship to the previous candle’s full range: inside (1), directional (2 up or 2 down), or outside (3). Traders combine those observations with timeframe continuity, prior highs and lows, and explicit entry and risk rules to study breakouts, continuations and reversals.
LuxAlgo’s charting and AI platform provides a practical way to inspect these patterns on Quant Charts and develop reproducible tests with Quant, our coding agent. Start with the dedicated The Strat Library tool, then separate the pattern you can see from the execution assumptions needed to trade it.
Key Patterns to Know
- Inside bar (1): the current range stays within the prior range, showing contraction.
- Directional bar (2): price breaks one side of the previous range, but not both.
- Outside bar (3): price breaks both sides of the previous range, showing expansion.
- 2-2, 2-1-2 and 3-1-2: sequences describe how those bar types develop. Their direction and surrounding structure determine the setup.
A bar number is not a win probability. An outside bar does not automatically imply reversal, and a directional bar alone does not confirm an enduring trend. Candle-body color and range classification answer different questions.
Main Strat Pattern Types
Inside Bar Patterns
An inside bar compares the entire high-to-low range, including wicks, with the immediately preceding bar. It often provides a compact reference for a later breakout. That narrower range can reduce the distance to a structural stop, but it can also lead to repeated failed breaks.
For a strict research definition, require the current high to be below the previous high and the current low to be above the previous low. Bars with tied highs or lows need a declared convention: some implementations allow equality, while others treat those bars separately. Verify the actual tool or code rather than assuming every inside-bar study handles ties identically. See Inside and Outside Bars for the underlying range comparison.
A 100-day BTC/USDT study on 10-minute candles could count inside bars and examine subsequent returns, but a count is not a trade result. A hypothetical sample with 1,916 inside bars would still require separate entry and exit rules to establish how many trades were executable. Even a reported $27.67 average gross result per Bitcoin would be incomplete without dates, venue, fees and slippage; those numbers alone are not evidence of an edge. A reproducible test should report those inputs, count executable trades separately, and include failed breaks.
Directional and Outside Bars
| Bar type | Range observation | Interpretation limit |
|---|---|---|
| 2 up | Breaks the prior high without breaking the prior low. | An upward range extension can still close below its own open. |
| 2 down | Breaks the prior low without breaking the prior high. | A downward range extension can still close above its own open. |
| 3 outside | Breaks both the previous high and low. | Shows expansion; reversal or continuation depends on context. |
An outside candle closing near its high can support a bullish hypothesis after a decline; one closing near its low can support a bearish hypothesis after an advance. A close in the middle leaves less directional information. None of those observations reveals the exact intrabar order of events from OHLC alone.
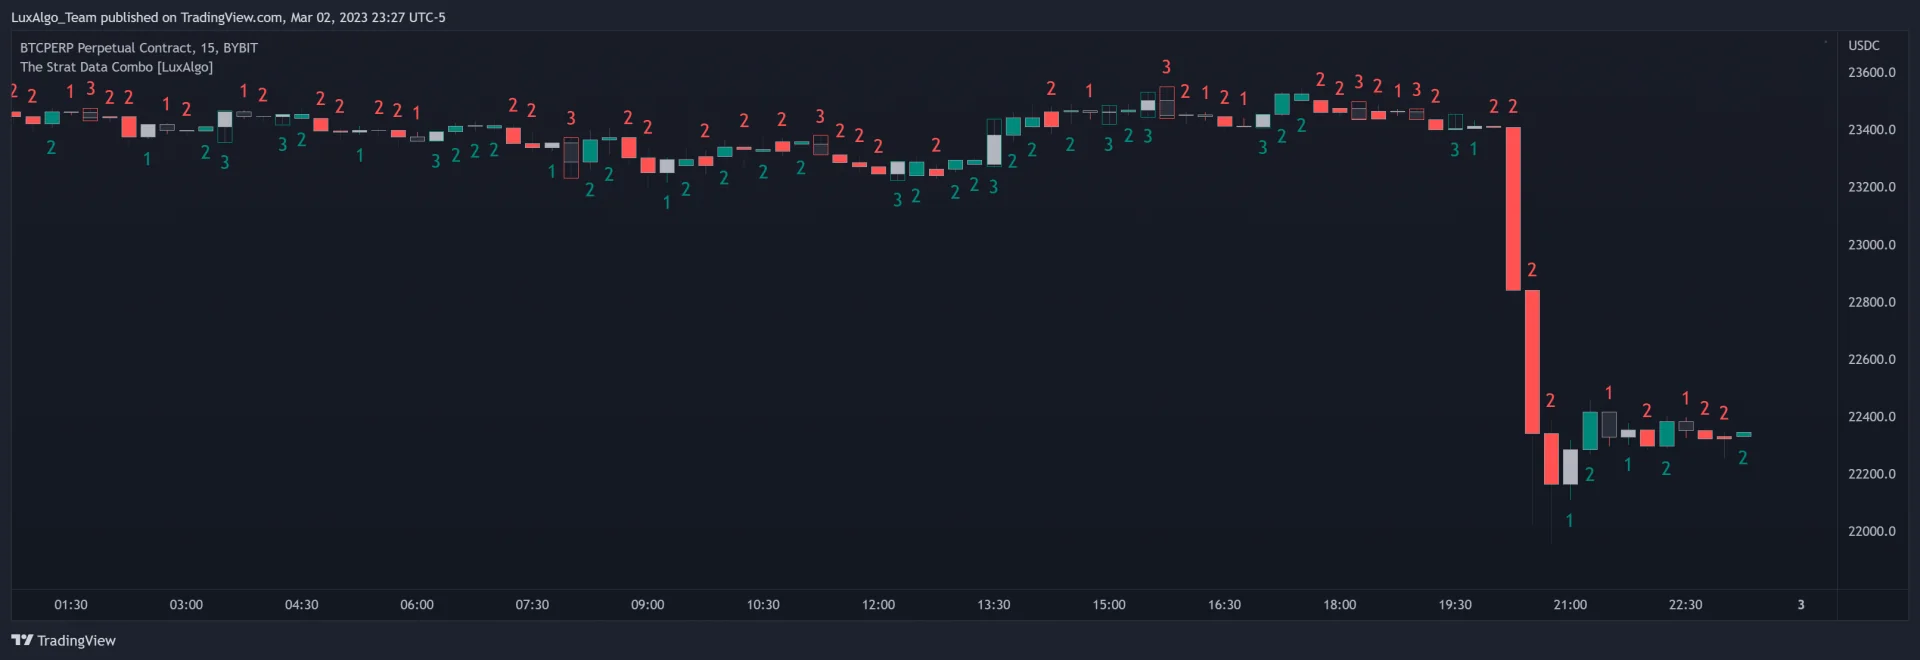
A developing candle may begin as a 1, become a 2 after breaking one boundary, and become a 3 if it later breaks the other. Decide whether your rules act intrabar or wait for completion. The final historical number must not be used as though it was known before the candle finished.
Multi-Bar Pattern Sequences
In the descriptions below, “2 up” and “2 down” identify direction. Hyphens between pattern numbers are human-readable separators, not necessarily the syntax accepted by an indicator’s input field.
| Sequence | Possible setup | Reference to define |
|---|---|---|
| 2-2 | Two consecutive directional bars. Opposite directions can describe a reversal; matching directions can describe continuation. | The second bar’s break, invalidation and pre-existing target. |
| 2-1-2 | Directional bar, inside bar, then directional break. A 2 down → 1 → 2 up is a bullish reversal candidate; 2 up → 1 → 2 up is continuation. | Inside-bar high or low, trigger timing and stop choice. |
| 3-1-2 | Outside bar, inside bar, then directional break. The final direction and prior context determine the interpretation. | Inside-bar boundary, broader outside range and available target space. |
A 2-2 consists of two classified bars, with an earlier reference candle needed to classify the first. It does not require an additional matching two-candle sequence. Likewise, calling every 2-1-2 a reversal obscures the difference between an opposite-direction turn and a same-direction continuation.
Trading with Strat Patterns
Trade Entry and Exit Rules
For an inside-bar setup, mark its high and low before the trigger. A possible long entry is a break above the high; a short entry is a break below the low. A completed close beyond that boundary followed by an entry at the next open is a different rule from an intrabar stop entry. Test each version separately.
For a 2-2 setup, specify which prior boundary the second directional candle must break and when an order becomes eligible. “After confirmation” is incomplete unless confirmation has a measurable definition. Record what happens if the market gaps beyond the intended entry or if both sides trade during one candle.
Choose a stop using the structure that invalidates the setup. An inside-bar boundary, a broader pattern extreme or a lower-timeframe swing may each be reasonable under a stated plan, but they produce different position sizes and outcomes. Select targets from prior highs or lows, or an explicit reward-to-risk rule. A nearby opposing level can leave too little room for the planned trade.
Risk Control Methods
A hypothetical bullish 2 down → 1 → 2 up setup has an inside-bar high of $101 and low of $99. Assume an actual long fill at $101.10 and a stop at $98.90. Planned risk is $2.20 per share. With a $110 risk budget, the position is 50 shares before costs. A target at $105.50 offers $4.40 per share, or 2R.
This arithmetic is a sizing illustration, not an optimal risk allocation. Two percent of account equity is not a universal requirement; choose a budget that accounts for drawdowns, correlated positions and the instrument. Spreads, commissions and slippage reduce results. A stop order can fill beyond its trigger, so a gap to $97 would produce a $205 loss on those 50 shares before costs.
Keep stop-loss and take-profit rules explicit. If using an ATR buffer, define its length and when the value is sampled. Do not widen a stop simply to preserve a failed pattern. A 2R target does not guarantee positive expectancy: win rate, average realized wins and losses, and costs all matter.
Testing Strat Trading Methods
- Specify the pattern: include direction, equality handling, completed or developing bars, and the exact trigger.
- Record the market: symbol, venue, timeframe, session, adjustment settings and sample dates.
- Define execution: entry timing, stop, target, position size, overlapping signals and costs.
- Check timing: use only information available at each decision, including higher-timeframe observations and pivot confirmation.
- Evaluate outcomes: trade count, net expectancy, drawdown, adverse moves and sensitivity to costs across unseen periods.
Test a simple baseline before adding volume or timeframe filters. Record every variation tried; selecting the best combination after many trials can make a weak method appear convincing. Community examples are useful hypotheses, but they do not replace a documented test.
Higher-Level Strat Concepts
Price Range Analysis
Contracting ranges show lower highs and higher lows; expanding ranges show higher highs and lower lows. A broadening formation extends that expansion across multiple swings. Mixed behavior may be transitional, offering no clear directional setup. Mark the actual boundaries rather than treating every outside bar as a complete broadening formation.
Prior highs and lows provide potential magnitude targets, not promises that price will reach them. A narrow inside bar within a wide outside range can produce a clear trigger while still leaving substantial uncertainty about the next move.
Timeframe Coordination
Timeframe continuity compares current price with the opening price of selected higher-timeframe candles. Price above all selected opens gives bullish continuity under that definition; price below all gives bearish continuity. It differs from merely seeing matching 1, 2 or 3 labels. The Bunnywood TheStrat method overview explains this distinction and the relationship between higher-timeframe targets and lower-timeframe triggers.
A daily context chart, four-hour setup chart and one-hour trigger chart are possible choices. There is no mandatory 4–6 ratio between intervals, and those example intervals do not all have that ratio. Select views around the holding period and available liquidity.
Current higher-timeframe price relative to an already-known open can be observed intrabar. Its eventual close cannot be imported into an earlier decision. A backtest must either reconstruct developing higher-timeframe conditions at the time or use previously completed candles. Document which interpretation you use.
Volume and Strat Pattern Links
Volume can describe participation around a break, but it does not validate a pattern automatically. Compare activity with an appropriate baseline, including time of day for intraday markets. Rising price on elevated volume may support an expansion hypothesis; falling price on elevated volume may support selling pressure. Lower activity during an advance can be a reason to examine follow-through, rather than an automatic exit.
For a hypothetical TSLA breakout, compare volume with recent comparable sessions and check whether price holds the broken level. An undated $750 example is difficult to interpret without split-adjustment context. For a hypothetical SPY inverted hammer, the preceding decline, candle shape and later price behavior matter; a red volume column alone does not establish a bearish reversal. Use volume analysis techniques to define a testable filter.
Strat Analysis Software Tools
LuxAlgo The Strat Library Tool
The LuxAlgo The Strat Library page provides a chart preview and an Open on Quant Charts workflow. It includes candle numbering, custom combo searches, Pivot Machine Gun detection and a dashboard. The original open-source TradingView publication documents the indicator’s settings and is a separate platform implementation.
- Candle numbers: show the bar’s relationship to the previous range.
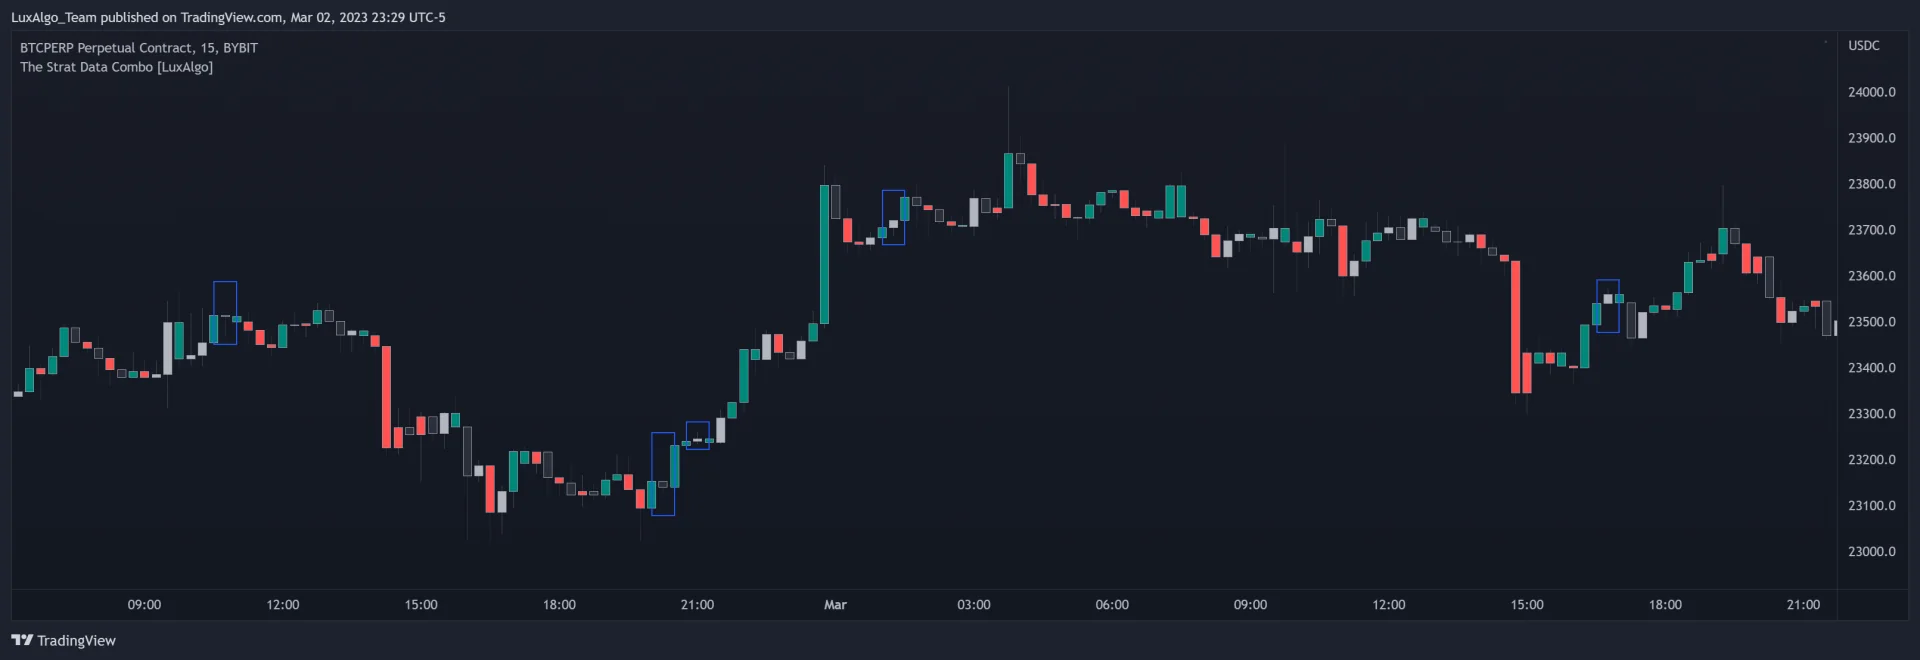
- Custom combos: highlight matching sequences with boxes. In the documented TradingView input,
2-21means 2, −2, 1; the minus sign indicates a downward directional bar. Do not insert spaces or extra separators. - Pivot combos: summarize patterns around identified pivots using lookback and scan settings. They are deduced retrospectively, not available in real time at the pivot.
- PMG: detect a move breaking successive prior highs or lows, subject to minimum sequence and minimum break settings.
- Dashboard: displays number distributions, combo frequencies and multi-timeframe numbers. Frequency percentages are not strategy win rates.
Researching Patterns with Quant
Use Quant Charts to compare the selected context and trigger intervals. The supplied custom-timeframe demonstration shows how to configure a chart interval; choosing an interval does not establish timeframe continuity or improve a pattern by itself.
Ask Quant, our coding agent, to turn a precise definition into a study:
Classify completed candles using their full ranges. Use strict inequalities and flag equal-boundary cases separately. Mark 2 down → 1 → 2 up sequences. Measure the next five-bar close return from the signal close without assuming a fill at that close. Separate observations by current price relative to the known daily open, and report counts and average returns for both groups.
Inspect the generated code and run it manually. Verify a small candle sample by hand before introducing orders. Follow Making Strategies with Quant when adding entry timing, costs, sizing and stop rules. A descriptive return study and an executable strategy backtest answer different questions.
Tools, Alerts and Access
The Library’s market-structure tools can provide surrounding context, but they are not a dedicated TheStrat detector. Use the specific The Strat tool for its documented numbering and combo features.
Configure any supported alerts for the exact candle number, combo or PMG condition and verify whether they evaluate during a candle or at its close. An alert is a notification, not proof of an order fill or an automatically profitable trade. Check the selected platform’s available settings rather than assuming identical behavior across implementations.
The original TradingView indicator is published as free and open source. Consult current LuxAlgo pricing and access details for broader platform features. Confirm that the selected plan and platform provide the specific tools your workflow needs.
Learn How I Swing Trade Using TheStrat (Masterclass)
Putting the Method into Practice
Begin by labeling a short candle sequence manually. Add the LuxAlgo tool and compare its output, including ties and developing bars. Mark the context, trigger, invalidation and target before assessing results. Then research one variation at a time with a record of failures as well as successful examples.
TheStrat’s value is a consistent vocabulary for price behavior. Multi-timeframe analysis, volume and software can organize that behavior, but their usefulness depends on definitions, timing and measured results.
Frequently Asked Questions
What do 1, 2 and 3 mean in TheStrat?
They classify the current range relative to the previous candle: inside, directional on one side, or outside on both sides. Direction and candle-body color are separate observations.
Is every 2-1-2 a reversal?
No. Opposite directions around the inside bar can describe a reversal, while matching directions can describe continuation. State the directions explicitly.
Does an outside bar guarantee reversal?
No. It shows a break of both prior range boundaries. Context, close location and subsequent behavior determine the interpretation.
What is timeframe continuity?
It compares current price with the opening prices of selected timeframes. It differs from checking whether candle-number labels match.
Are pivot-combo percentages win rates?
No. The dashboard summarizes observed pattern frequencies. Pivot combos use later confirmation and cannot be treated as signals known at the original pivot.
Can Quant test a Strat setup?
Yes. Specify classification, timing, equality handling and outcomes. Inspect the generated code and run it manually before adding execution, sizing and costs.
References
LuxAlgo Resources
- LuxAlgo Quant
- Making Strategies with Quant
- The Strat Library Tool
- LuxAlgo The Strat: Original TradingView Publication
- Inside and Outside Bars: Signal Insights for Trades
- Stop-Loss and Take-Profit: Setting Your Limits
- Volume Analysis Techniques
- LuxAlgo Pricing
External Resources
Read next