Supply and Demand Zones: Identifying Critical Areas for Trading Success
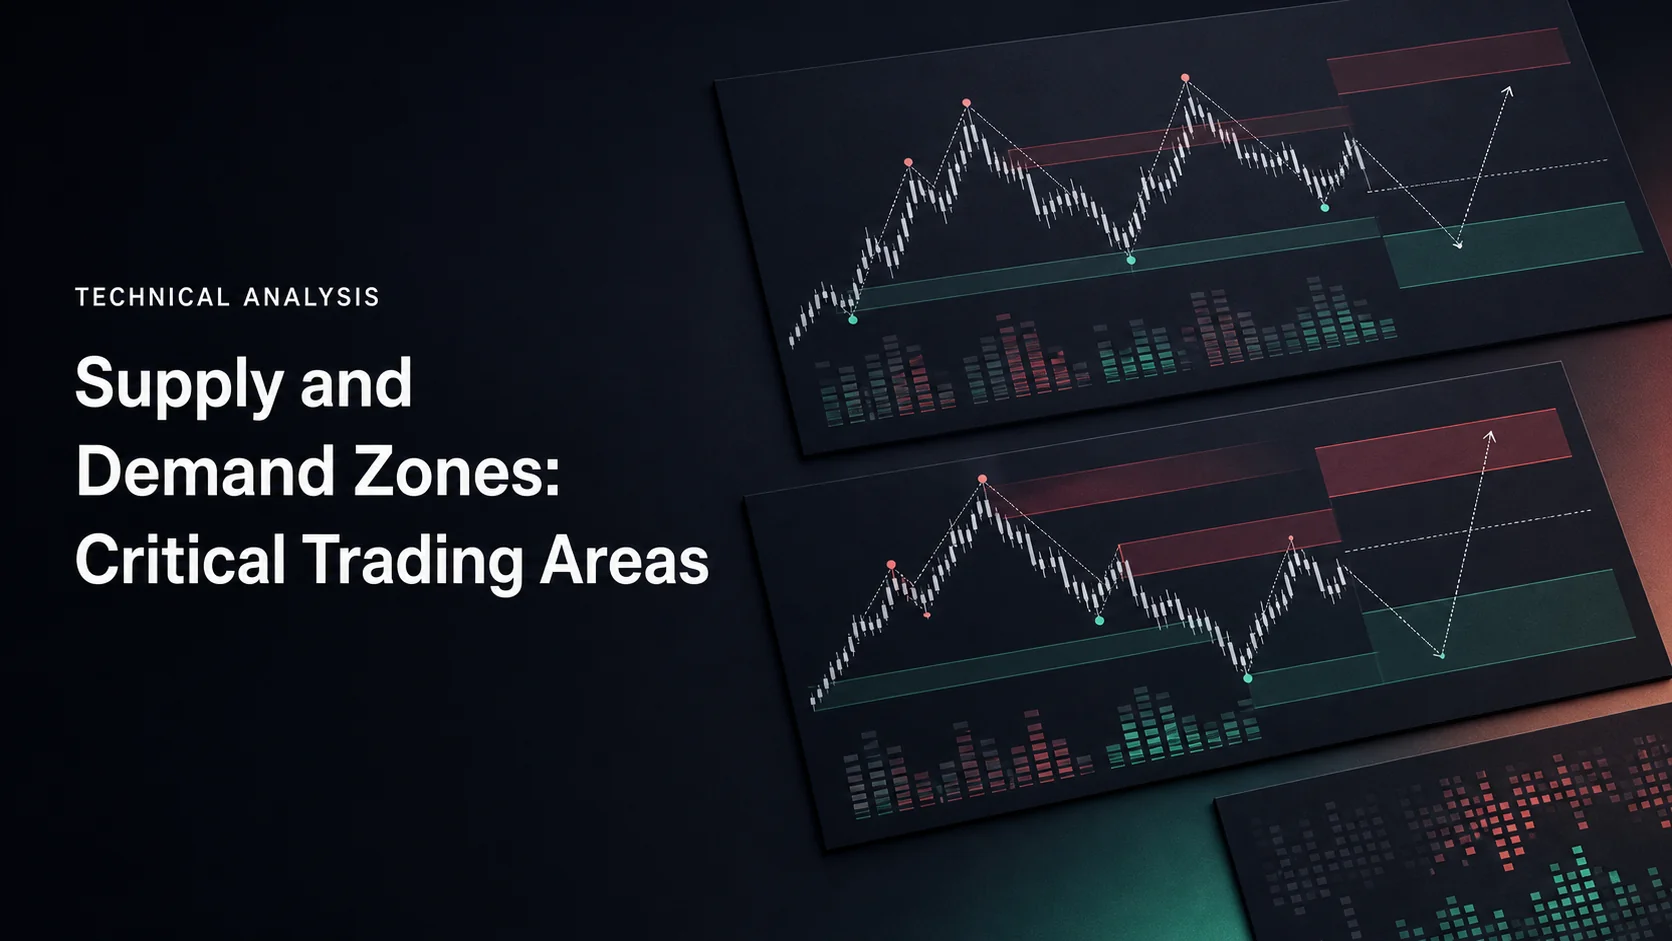
Supply and demand zones are price areas traders mark around a base that preceded a decisive move. A rally away from a base suggests a potential demand area; a decline suggests a potential supply area. The useful question is how price behaves on a later return, under entry and exit rules you can define before the outcome is known.
A candle chart does not reveal who placed the orders, how many unfilled orders remain, or whether an institution will defend a price. Treat zones as hypotheses about future reactions. In LuxAlgo, you can map them on native charts, compare timeframes, and use Quant to turn an explicit definition into code for testing.
- Identify: locate the base and the completed move away from it.
- Define: record the boundaries, recognition time, and conditions that cancel the setup.
- Evaluate: compare price reactions and available volume with the surrounding market.
- Test: include failed zones, realistic fills, costs, and a later period that did not guide your choices.
Finding Supply and Demand Zones
Price Patterns: RBD, DBR, RBR, and DBD
Rally-Base-Drop (RBD) and Drop-Base-Rally (DBR) describe a reversal around a base. Rally-Base-Rally (RBR) and Drop-Base-Drop (DBD) describe a pause followed by continuation. These are descriptive pattern families, not proof of a particular participant’s accumulation or distribution. FXOpen’s pattern guide illustrates the four sequences; their predictive usefulness still depends on the trading rules and sample.
| Pattern | Observed sequence | Candidate area |
|---|---|---|
| RBD | Price rises, consolidates, then drops away | Supply near the base; watch a later return from below. |
| DBR | Price falls, consolidates, then rallies away | Demand near the base; watch a later return from above. |
| RBR | A rally pauses at a base, then resumes upward | Demand within a continuing upward move. |
| DBD | A decline pauses at a base, then resumes downward | Supply within a continuing downward move. |
Draw Boundaries Consistently
Choose a rule for the base before reviewing its later retests. For example, use the lowest low and highest high of the selected base candles. A body-only rule produces different boundaries; either convention needs consistent application. The edge nearest the returning price is often called the proximal edge, and the farthest edge the distal edge.
Suppose a hypothetical base spans $99.40–$100.00 and price subsequently rallies away. A return from above reaches the proximal edge at $100.00 first; the distal edge is $99.40. The zone is $0.60 wide. Those boundaries alone do not specify an entry, an executable stop price, or a guaranteed bounce.
A zone inferred from the departure becomes available only after your departure condition has occurred. Drawing it back over the base does not mean you could have traded it there in real time. Record the recognition bar separately from the first base bar, and do the same for any swing confirmation required by an indicator.
Evaluate Width, Freshness, and Departure
There is no universal rule that a zone must span 1–3% of price. Width depends on the base, instrument, timeframe, and boundary convention. Average True Range (ATR) can express that width relative to recent volatility: a $0.60 zone with ATR of $1.20 is 0.5 ATR wide. ATR provides context; it does not tell you that the zone will hold.
You can compare compact versus wide bases, stronger versus weaker departures, and first versus later retests. Define each category in advance. A fresh zone is simply one not yet revisited under your definition; neither freshness nor repeated touches proves the quantity of resting orders. Avoid narrowing a zone after seeing the winning entry.
Map Zones on Native LuxAlgo Charts
Start with Quant Charts, LuxAlgo’s native charting platform. Keep the symbol, data source, session, and timezone consistent while comparing a broader chart with an entry chart. Daily, four-hour, and one-hour charts are one possible arrangement, not a required combination or three independent confirmations.
Use the drawing tools to mark the base boundaries and annotate when the zone became available. Magnet can snap anchors to candle OHLC values. Lock completed markup in the Object tree to reduce accidental movement. Sync drawings on all charts copies the same markup across a multi-chart layout; a copied zone is not a separately discovered zone.
For a reproducible comparison, keep the higher-timeframe zone fixed as you examine the smaller chart. Do not use a daily candle’s final high, low, or close before that candle has finished. Record whether a lower-timeframe setup is inside the broader zone, near its edge, or unrelated to it.
Volume Analysis for Evaluating Zones
Volume describes recorded activity, not the identities or intentions of traders. A large move can occur with limited liquidity, and high volume can accompany either a successful reaction or a failed zone. Compare like-for-like data: venue-specific exchange volume and a forex feed’s tick activity are not interchangeable measurements of global trading.
- High volume at formation: shows greater recorded activity in that sample; check whether price actually departed and whether the definition was available then.
- Declining volume in the base: may reflect quieter trading; it does not establish hidden accumulation or distribution.
- Volume expansion on a break: describes participation in the break, which can still fail. Test whether requiring it improves results after costs.
- Relative volume: compare against an appropriate baseline, including time of day for intraday work; an unusual reading is not a calibrated success probability.
Volume Profile can help locate where recorded volume traded at price. OBV accumulates volume according to the direction of price changes, while VWAP relates price to volume over its calculation period. They answer different questions and can add context, but combining them does not establish that a zone is institutional or guarantee a reversal.
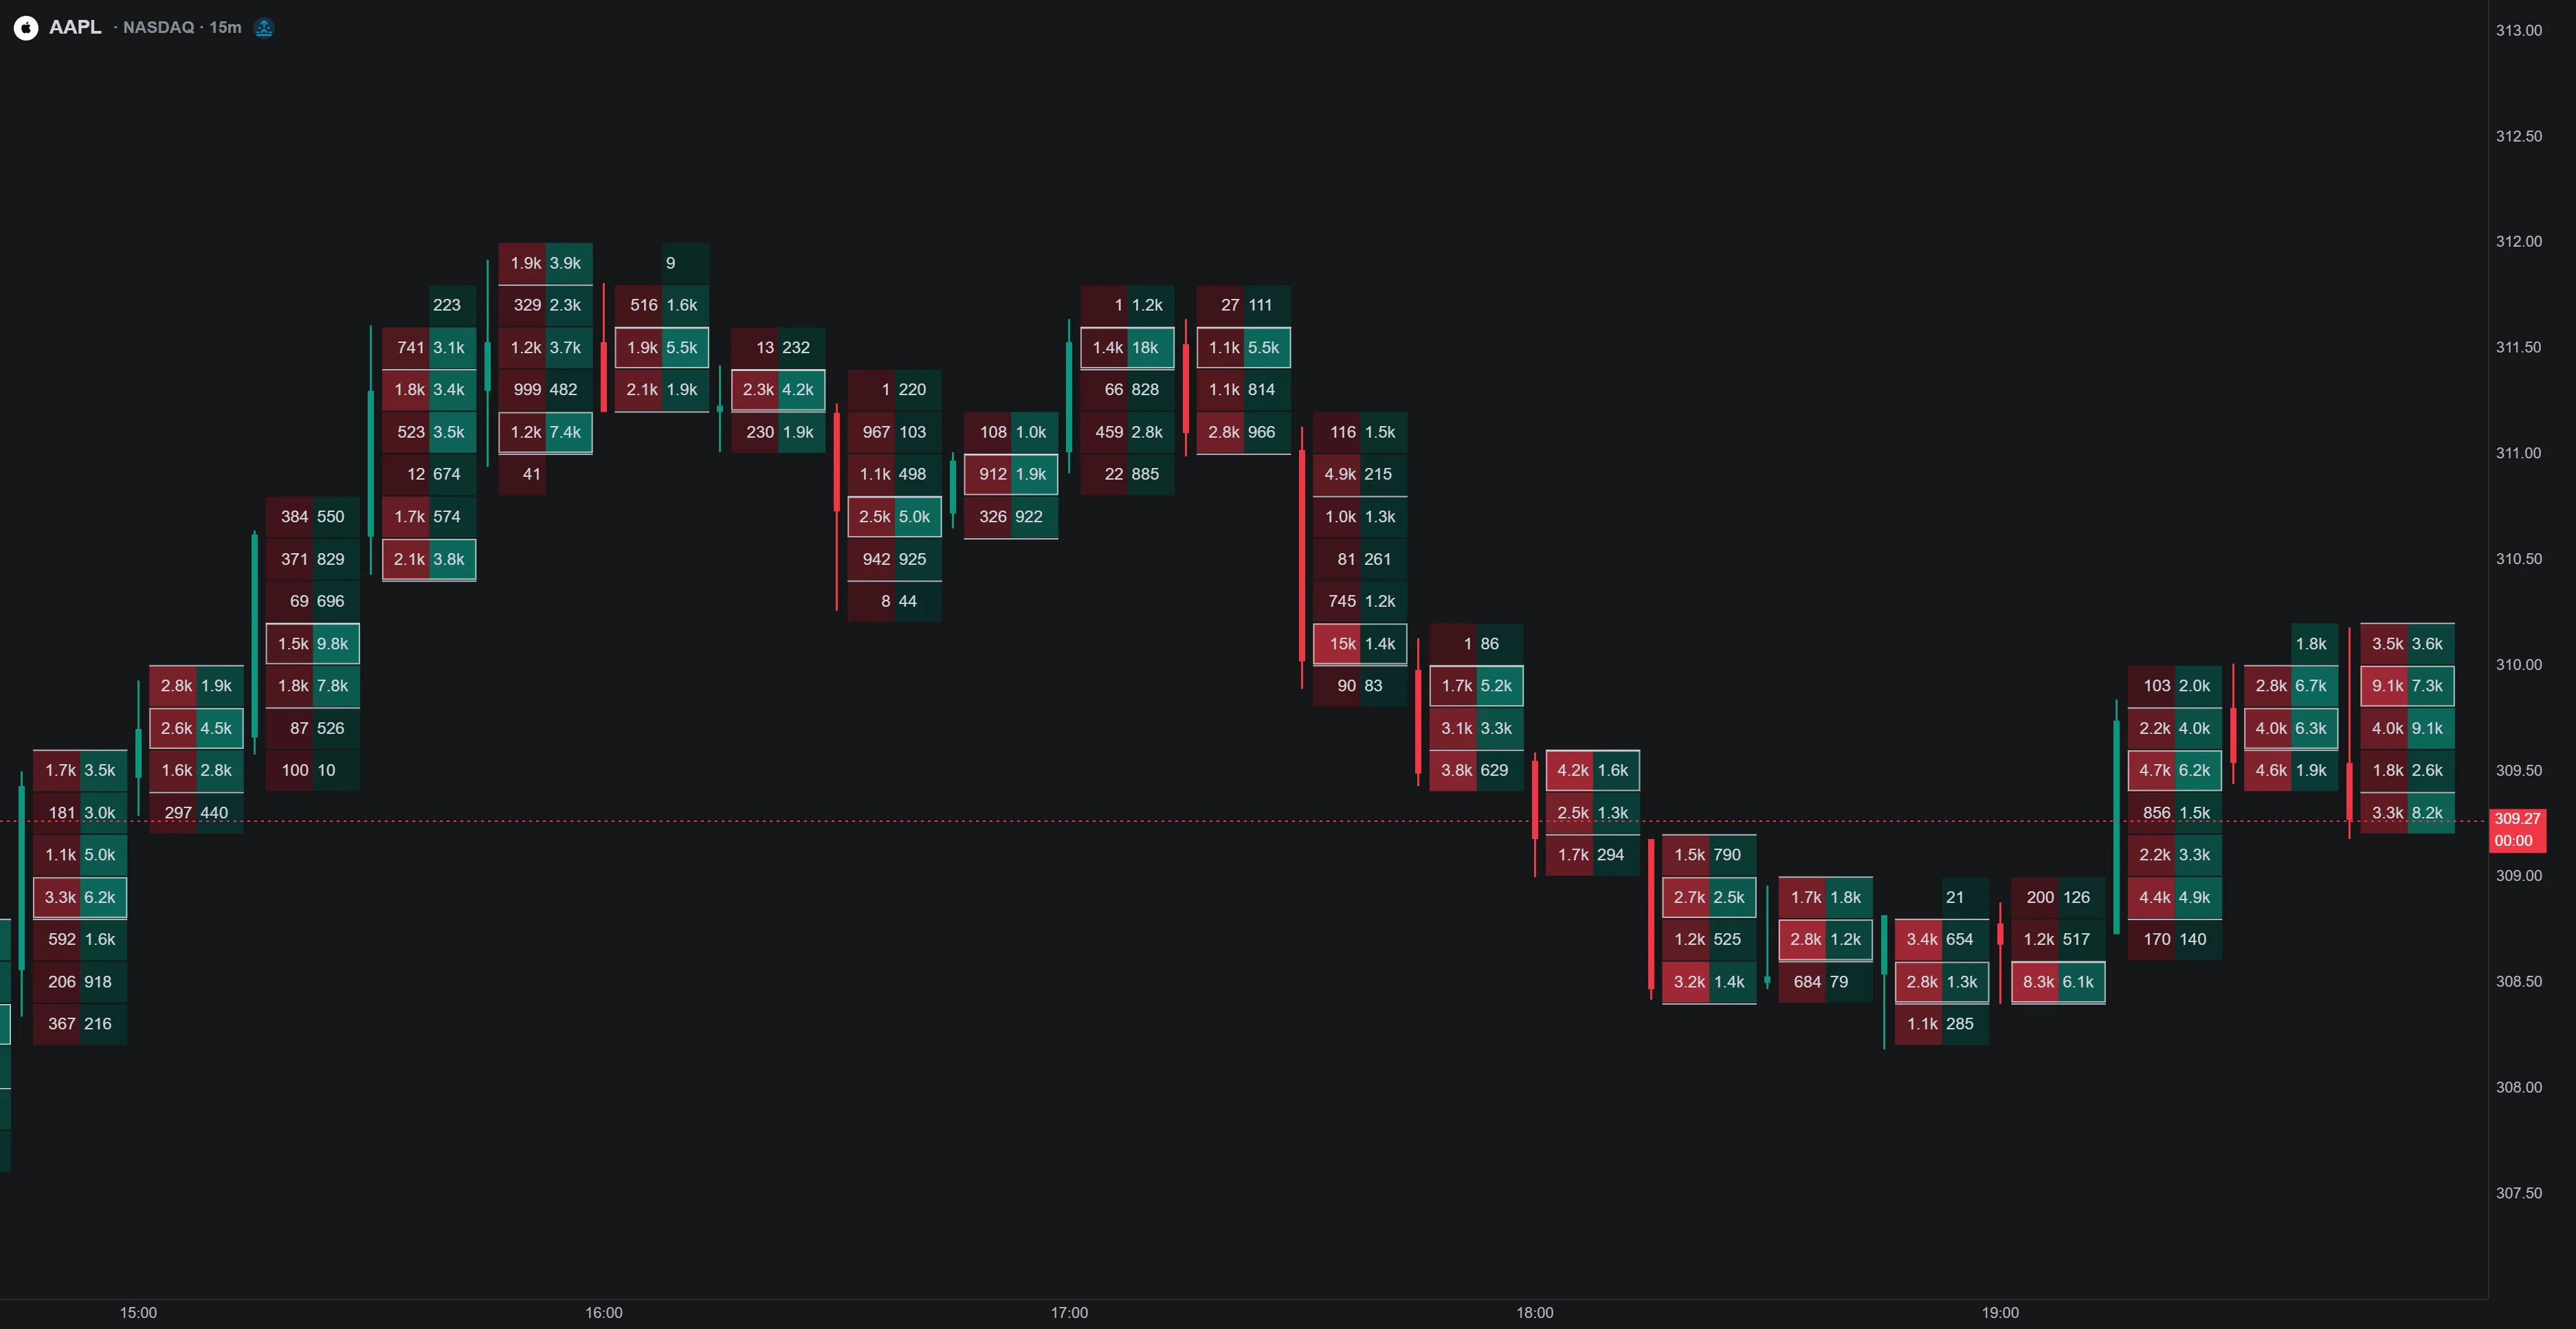
Where supported data is available, native footprint charts let you examine executed activity at price inside candles. LuxAlgo’s documented footprint data uses minute-level aggregation; it is not a live order book or a view of all pending orders. Row grouping and the selected feed affect what you see. Use the price response alongside the activity, rather than treating a large number as an automatic entry.
Supply and Demand Zones vs Support and Resistance
Both approaches mark potential reaction areas. Supply-and-demand methods typically emphasize the base before a departure, while support-and-resistance methods often emphasize previous turning points, ranges, or other reference levels. Support and resistance can also be drawn as zones; the distinction is not simply wide bands versus exact prices.
| Question | Supply-and-demand approach | Support-and-resistance approach |
|---|---|---|
| What selects the area? | A defined base and subsequent departure. | Prior reactions, range boundaries, or another stated reference. |
| How wide is it? | Depends on the base and boundary rule. | Can use single levels or bands with a stated tolerance. |
| Is it more reliable? | Requires evidence for the complete strategy. | Requires the same evidence; either can break or reverse. |
| How is it traded? | Touch, rejection, or break-and-retest rules can be tested. | Those entry styles can also be applied here. |
Neither method is automatically best for volatile or range-bound markets. A wider zone may increase the distance to a planned stop, which changes position size. Scaling in adds exposure; several entries within one zone must share a total risk budget rather than each receiving an unrelated allowance.
Trading with Supply and Demand Zones
Reversal Trades and Failed Breaks
A touch entry acts when price first reaches the zone. A rejection entry waits for a specified reaction, such as a completed candle closing back above the demand area. Waiting changes both the information available and the entry price; compare the methods on the same sample instead of assuming either is superior.
A bear-trap scenario dips below demand and returns above a defined boundary; a bull-trap scenario pushes above supply and falls back below it. Specify whether the return must happen on the same candle or within a fixed number of candles. A proposed stop beyond the failed break’s extreme should be evaluated against volatility, spread, slippage, and the total loss budget. The chart shape does not prove someone deliberately set a trap.
Candlestick reversal patterns and Fibonacci levels can be optional filters. Define their parameters and their timing, then compare results with and without them. Several labels derived from the same price movement may describe overlapping information rather than independent evidence.
Continuation and Break-and-Retest Trades
RBR and DBD describe continuation at formation. Separately, a zone may break and later be tested from the other side: former supply may act as support, or former demand as resistance. Neither role reversal is assured. Define a completed close beyond the boundary, a maximum wait for the retest, and the reaction needed to enter. If the retest never happens, record no trade under that rule.
The next opposing zone can be a candidate target, provided it was identifiable before the trade. Check whether the distance offers enough potential reward relative to the stop and costs. A continuation label does not automatically produce a better reward-to-risk outcome than a reversal setup.
A Worked Risk Example
Using the hypothetical $99.40–$100.00 demand area, suppose a rejection rule produces an entry at $100.20, with a planned stop at $99.20 and a target at $102.20. The planned price risk is $1.00 per share and the gross potential reward is $2.00 per share, or 2R. With a $100 planned price-risk budget, that permits 100 shares before allowing for costs and execution risk.
If total round-trip costs were $10 for that position, a full target fill would yield $190 net and a stop fill exactly at the planned price would lose $110. That is about 1.73 net reward for each dollar of modeled loss, not 2. A gap or worse stop fill can increase the loss. Reduce size or change the setup if the total modeled loss exceeds the chosen budget; do not widen the stop after entry merely to keep the zone narrative intact.
LuxAlgo Zone Indicators: Know What Each Tool Measures
Supply and Demand Anchored
The Supply and Demand Anchored indicator estimates areas from the volume inside a user-selected start and end window. Its Threshold % controls the required volume share, Resolution controls the bin count, and Intra-bar TF controls the intrabar data timeframe. Moving either anchor recalculates the areas. This is a different definition from automatically detecting every RBD or DBR base.
The library page provides an Open on Quant Charts option. Keep a record of both anchor times and settings when comparing outcomes. An end anchor chosen after a later price move introduces future information into an earlier signal; freeze the available window for any historical test.
Test Clear Rules with Quant
Use Quant, our coding agent to build a research strategy from an explicit specification. Define the number and range of base candles, the departure threshold, the earliest recognition time, the allowed retests, entry order, stop, target, and expiry. If your discretionary markings cannot yet be expressed consistently, clarify them before requesting a backtest.
Inspect the generated code for those rules and any future-data or pivot-timing assumptions, then run manually in the native strategy workflow. Check individual trades against the chart. Include costs and realistic order assumptions, retain failed zones, and reserve a later period that did not guide the settings. Altering settings requires another run; a visually convincing zone map is not a performance result.
Journal the zone boundaries, recognition time, entry reason, execution, and outcome, including skipped setups and failures. Compare a simple baseline with each added volume or timeframe filter. Review net expectancy, drawdown, sample size, and sensitivity to nearby settings.
Master Supply & Demand Trading
The retained JeaFx tutorial illustrates supply-and-demand analysis with chart examples. Treat it as one educator’s approach; its examples and claims do not establish that a particular setup will work. Use the timing, data, and testing distinctions above when translating a visual explanation into your own rules.
Frequently Asked Questions
How do you identify a trading zone?
Locate a base before a completed move away, choose consistent boundaries, and record when the departure made the zone recognizable. Then define how a later return would trigger or cancel a trade.
Are supply and demand zones better than support and resistance?
Neither is universally more reliable. Both can mark reaction areas, and support and resistance can also be bands. Compare complete entry, exit, and risk rules on the same data after costs.
Does high volume prove an institutional zone?
No. Volume records activity within the coverage of the data source. It does not identify traders, reveal all pending orders, or establish that a later retest will succeed.
How wide should a supply or demand zone be?
Use a stated base and boundary convention. Compare its width with volatility and execution costs rather than imposing a universal percentage of price, and size the position around the planned loss.
Can Quant test supply and demand strategies?
Quant can help code an explicit zone definition and trading rules. Inspect the generated code and recognition timing, run manually, and verify individual trades, costs, and later-period results. A discretionary drawing alone is not a reproducible strategy.
Read next