The Best Trading Indicator Settings & Timeframes
The best indicator settings and timeframe depend on the decision you want to make, the data available and the costs of acting on it. There is no universal period or chart interval that establishes a profitable strategy. Start with a trading horizon and a clear rule, then test whether the settings support that rule across more than one sample.
A useful choice balances detail, responsiveness and stability. Shorter intervals can reveal movements hidden inside a larger bar, while longer intervals summarize them. Likewise, a more responsive indicator may react earlier but also respond to fluctuations that do not develop into a sustained move.
Choose a Timeframe for the Decision
A time-based chart groups observations into intervals. The appropriate interval depends on what the strategy needs to observe and how often you can realistically make or review decisions. A process intended to react within minutes needs different information from one reviewed after the daily close.
Separate the chart interval from the intended holding period. A trader can inspect an intraday chart while researching a longer position, but the extra detail should have a purpose. Conversely, a daily bar cannot show every movement that occurred inside the day.
| Research purpose | Possible information to examine | Question to resolve |
|---|---|---|
| Longer-horizon context | Daily or weekly observations | Does the summary retain the variation relevant to the thesis? |
| Intraday timing | A defined intraday interval | Can the decision be observed and acted on at the assumed time? |
| Multiple horizons | A higher interval for context and a lower one for a defined trigger | Was the higher-timeframe information actually available at entry? |
| Strategy comparison | The same rule tested separately across selected intervals | Are costs, history and timing comparable? |
These are ways to organize an experiment, not recommended intervals for every trader. Consider market hours, liquidity, your availability and the consequences of missing a decision. A higher timeframe is not automatically safe, and a lower timeframe is not automatically unsuitable.
Similar-Looking Charts Do Not Prove the Same Opportunity
Charts at different scales can display visually similar rises, declines and consolidations. That observation does not prove exact statistical self-similarity or that a rule transfers unchanged between intervals. Aggregation changes the information visible in each bar, and the trading costs do not necessarily scale with the pattern.
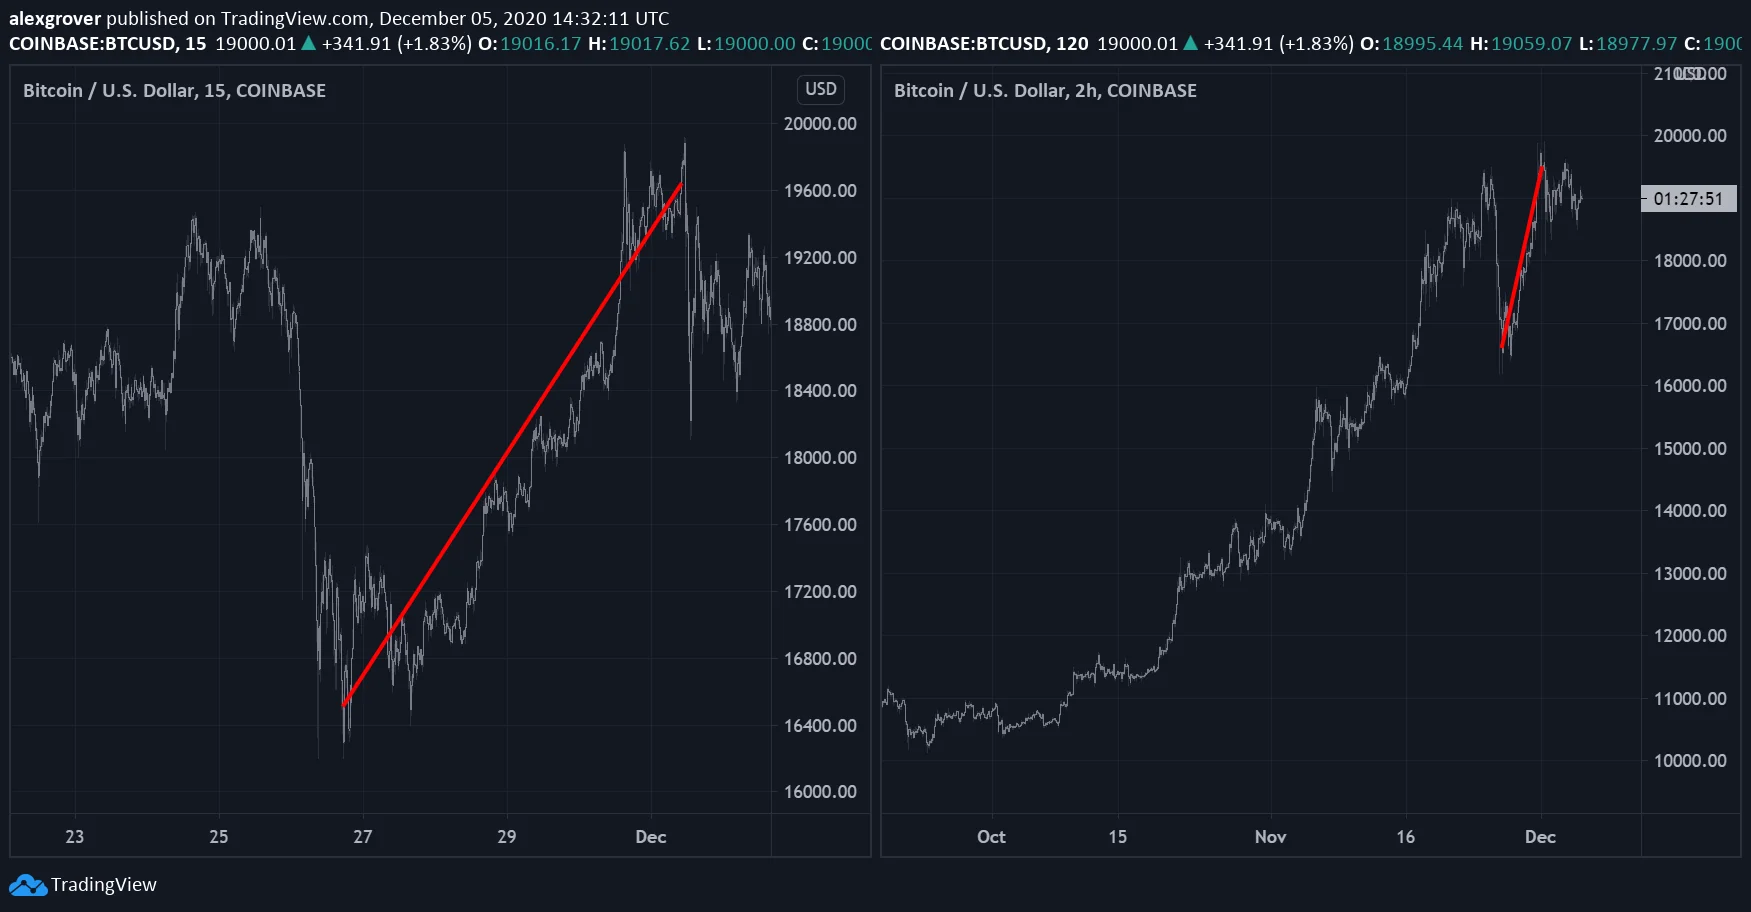
The same movement can be a major part of a short chart and a smaller part of a longer view. Use the broader view to understand context if that helps the rule, while keeping the lower-view trigger explicit. Avoid selecting whichever view makes a completed trade look most obvious.
A Fixed Number of Bars Is Not a Fixed Time Horizon
An indicator period usually counts observations. Changing the chart interval while keeping that period unchanged changes the span of data summarized. A 20-bar calculation on five-minute bars covers 100 minutes of bar intervals; on hourly bars it covers 20 hours of bar intervals. Session breaks and missing bars can make elapsed calendar time longer.
| Setting | Nominal span of bar intervals | What changes |
|---|---|---|
| 20 bars on a 5-minute chart | 100 minutes | Shorter observation span |
| 20 bars on a 1-hour chart | 20 hours | Longer observation span despite the same period number |
| 100 bars on a 1-minute chart | 100 minutes | Similar nominal span to 20 five-minute bars, but different sampling |
Even matching the nominal span does not make the calculations identical. One hundred one-minute closes and twenty five-minute closes sample different observations. The outputs, crossings and decisions can differ. Compare the actual rules and results rather than assuming a conversion of period length guarantees equivalence.
Account for Costs and Decision Frequency
A lower interval can create more opportunities for a rule to trigger, but more trades also mean more exposure to spread, fees and slippage. The relevant issue is the realized gain or loss relative to those costs, not the interval label alone.
For a hypothetical trade with a $0.20 gross gain per share and $0.06 of total per-share trading costs, the net gain is $0.14. Costs consume 30% of that gross gain. With the same $0.06 cost and a $1 gross gain, the proportion is 6%. These are arithmetic examples, not predictions about either timeframe.
Also test losing trades and adverse fills. A rule that looks precise on a chart may assume execution at a price that was not available after the signal became known. More granular data can improve some checks, but it does not remove execution uncertainty.
Use Higher-Timeframe Confirmation Consistently
Multi-timeframe analysis combines information from more than one interval. A rule might use a completed higher-timeframe trend measure and a lower-timeframe entry condition. Define both conditions before testing and state whether the higher-timeframe bar must be closed.
For example, during an unfinished hourly bar, its close is still changing. A lower-timeframe decision made during that hour cannot know the eventual hourly close. If the test uses that final value early, it introduces information that was unavailable at the decision time.
TradingView’s repainting documentation explains how unconfirmed values can differ from their historical, completed counterparts. Waiting for confirmation changes timing; it is not valid to claim the later confirmation while keeping an earlier entry price. Pine implementation details belong to the TradingView workflow, while the information-timing question also matters when evaluating other systems.
Understand What the Indicator Setting Controls
Settings can alter a calculation’s lookback, smoothing, threshold or display. Identify which kind of change you are making. A visual preference is different from a parameter that changes entries, and a longer lookback does not have the same effect in every formula.
For many smoothing tools, a slower response can reduce sensitivity to short fluctuations while delaying reactions to a sustained change. A faster response can detect changes sooner but produce more reversals in a choppy sample. Test that tradeoff within the complete strategy instead of searching for a setting that eliminates both delay and false signals.
Specify the price input, calculation method and required history as well as the period. Two indicators sharing the number 20 need not measure the same thing. A simple moving average, an exponential average and an oscillator can respond differently to identical data.
Optimize a Defined Strategy, Then Challenge the Result
Optimization searches among alternatives under a chosen objective. A grid search evaluates a defined set of combinations; a genetic algorithm searches through candidate combinations using an evolutionary procedure. Either method can locate strong historical results without establishing that those results will persist.
Write down the entry, exit, sizing and cost assumptions before comparing settings. Keep the search range and selection objective in the record. Changing several parts of the strategy while attributing the result only to the indicator makes the comparison difficult to interpret.
- Use an initial sample to develop the idea and choose candidate settings.
- Compare nearby settings to see whether the result is isolated or broadly similar.
- Evaluate the selected rule on a later period not used for selection.
- Inspect individual trades, drawdowns and sensitivity to costs.
- Record how many alternatives were tried and preserve unsuccessful results.
- If the rule is revised after seeing the later sample, treat that sample as part of development rather than untouched evidence.
Changing market conditions does not make optimization inherently useless. It changes what the result can support. A backtest describes performance under its data and assumptions; it does not establish an eternal optimum. Repeatedly adapting to the latest result can itself become another form of fitting noise.
Walk-forward evaluation can examine a defined process of selecting settings on one period and applying them to a subsequent period. The selection schedule, windows and costs still need to be specified. Avoid changing those rules after seeing which arrangement produces the most attractive combined result.
Dominant-Cycle Settings Are Estimates, Not a Market Clock
Some adaptive methods estimate a prominent cycle in recent data and use that estimate to influence an indicator setting. This is a hypothesis about how the tool should respond, not proof that the market follows a stable repeating period.
The estimate depends on the measurement method, the history and the data’s noise. A different sample can identify a different apparent cycle, and a trend or abrupt change can complicate interpretation. A filter tuned to an estimated period also has its own response and timing characteristics.
A band-pass filter emphasizes a range of frequencies, but not every adaptive indicator is a band-pass filter and not every indicator should use the same cycle estimate. Compare the particular adaptive implementation with a fixed-setting baseline under the same decision rules. Check what happens when the estimate changes quickly or becomes unreliable.
Run the Comparison in LuxAlgo’s Native Charts
Start with a narrow question in LuxAlgo’s native charts: which of a few justified settings better supports a defined rule on a particular symbol and interval? Keep the hypothesis, test dates and settings in the research record so the comparison can be repeated.
Ask Quant, our coding agent to help express a supported strategy hypothesis. Inspect the generated code and run it manually. Review strategy settings, costs and individual trades before selecting a result. Changing a timeframe or symbol changes the experiment and requires another run.
Check native data coverage and available history. The documented US-equity source is Cboe EDGX rather than a consolidated all-venue feed. An indicator needs enough observations to initialize, and comparisons across feeds or sessions can differ even when settings match.
A defensible setting is one whose purpose and limitations you can explain. Choose the horizon first, preserve realistic information timing, compare a small set of justified alternatives and examine results beyond the selection sample. The strongest historical number is a starting point for scrutiny, not a universal answer.
Frequently Asked Questions
What is the best timeframe for trading?
It depends on the decision horizon, market, costs and ability to act on the rule. Define those requirements and test the selected interval rather than assuming one timeframe works best for everyone.
Does keeping the same indicator period preserve the same lookback?
No. A period counts observations. Twenty five-minute bars and twenty hourly bars cover different spans, and even equal nominal spans can use different sampled prices.
Does a higher timeframe remove trading risk?
No. It changes the information summarized and often the decision frequency. Position exposure, gaps, execution costs and the strategy’s assumptions still matter.
Are optimized or adaptive settings guaranteed to outperform fixed settings?
No. They depend on the implementation, selection process and data. Compare them with a defined baseline, realistic costs and a later period that was not used to choose the rule.
How can LuxAlgo help compare settings?
Use native charts and Quant to express a supported strategy hypothesis. Inspect generated code and run it manually, review costs and individual trades, and rerun the comparison when changing symbols or timeframes.
Read next