The Best Timeframe for Trading (Actual Truth)

There is no universally best timeframe for trading. Choose an interval that fits your strategy, the instrument’s trading conditions and the time you can reliably devote to decisions. Then test the rules and costs on that interval rather than assuming a daily chart is safer or a one-minute chart offers more opportunity.
A chart timeframe describes how price data is grouped into bars. It is not the same as your intended holding period: a trade entered from a 15-minute chart may last several bars or extend into another session, depending on its rules.
Use Timeframes for Defined Jobs
Top-down analysis starts with a broader view, such as a daily or four-hour chart, then examines a shorter interval for a more specific decision. It can help you notice a larger trend or a nearby price area before acting on a short-term move. It does not guarantee a better result, and a well-defined strategy does not have to use multiple timeframes.
Give each view a job. For example, use the daily chart to identify context and the 15-minute chart to apply an entry rule. Decide in advance whether a higher-timeframe condition is a required filter, a reason to reduce exposure or simply background information. Adding more charts without decision rules can create contradictory signals and hindsight explanations.
A Historical Example: A Rally Inside a Broader Decline
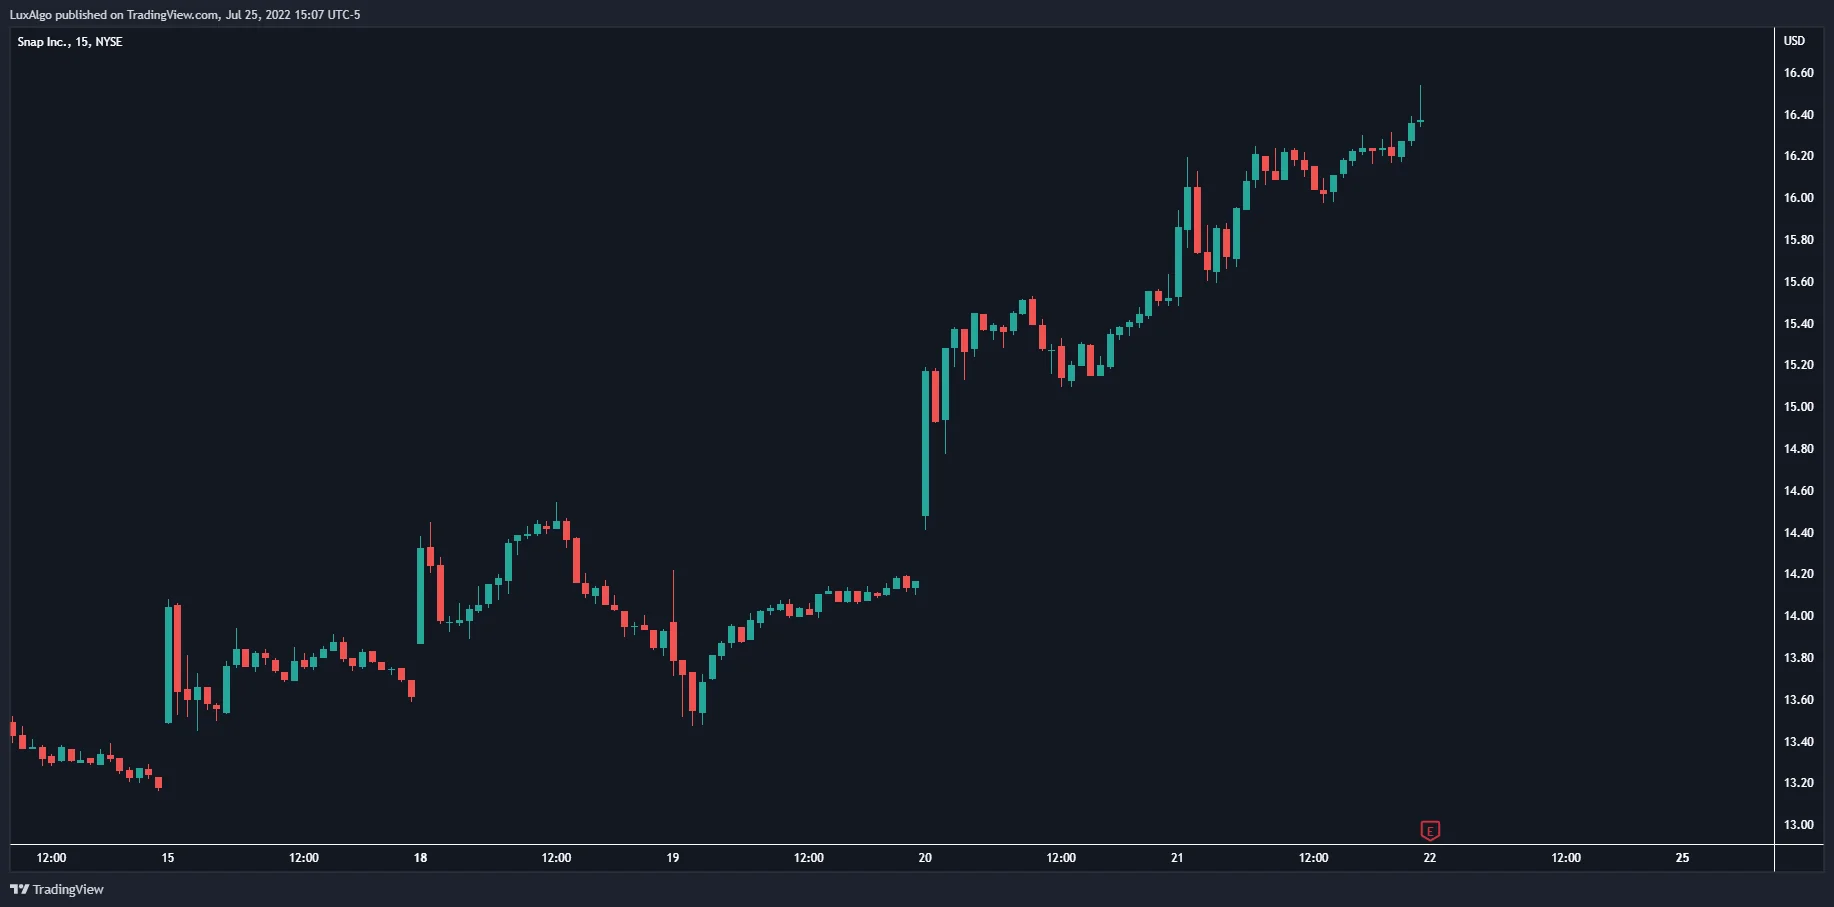
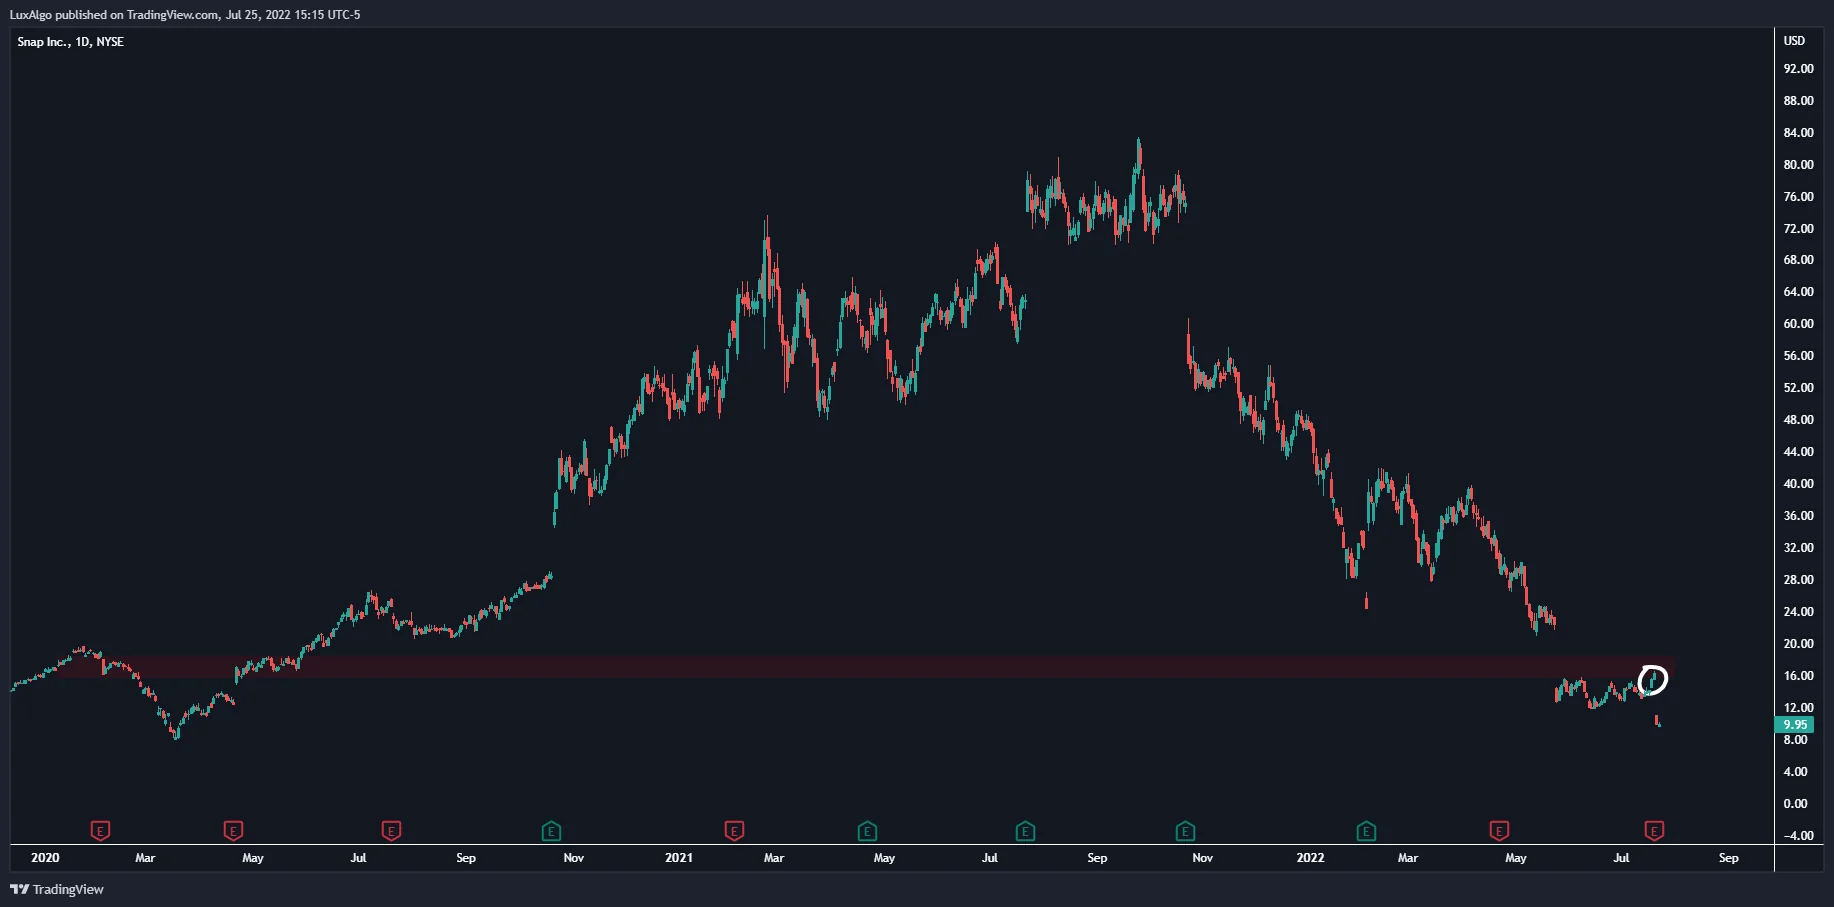
The three original TradingView screenshots below show Snap in July 2022. They are historical educational examples, not current LuxAlgo interface screenshots or a live trade recommendation. The first shows a rising sequence on a 15-minute chart; the daily view shows that move in the context of a much larger decline.
The daily chart marks a price area that the original article treated as potential resistance. A level can help frame a scenario, but its significance must be assessed using information available at the time. A marked line does not establish that price must reverse there.
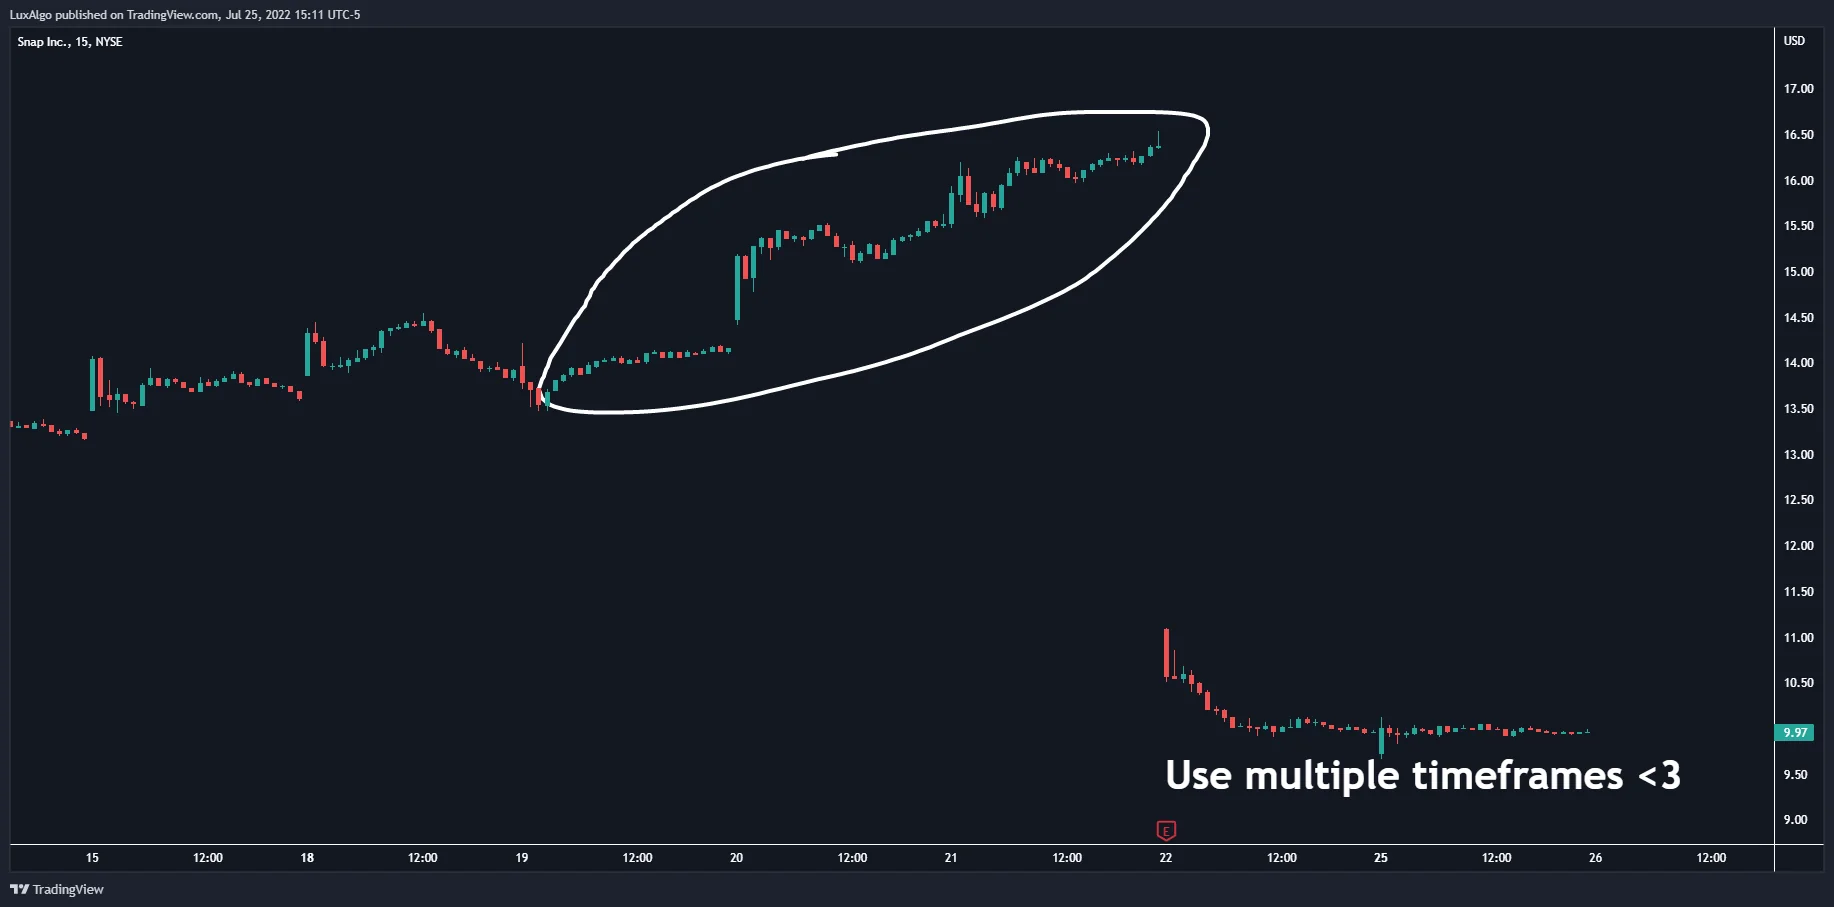
The final screenshot shows a later gap down. This selected sequence illustrates why broader context and overnight exposure deserve attention. It does not show that resistance caused the gap, that a trader could have predicted it from these charts, or that adding a daily filter reliably improves a strategy. Establish the event context and test many cases before drawing a general conclusion.
Match the Interval to Your Routine
| Candidate approach | Possible chart roles | What to test |
|---|---|---|
| Intraday research | Hourly context with a 5- or 15-minute decision chart | Decision frequency, spreads, slippage and session boundaries |
| Swing research | Daily context with an hourly or four-hour decision chart | Overnight exposure, event risk and review schedule |
| Longer-term research | Weekly context with a daily decision chart | Holding-period risk, portfolio exposure and infrequent decisions |
These combinations are starting hypotheses, not recommended settings or success rankings. A person who can check charts only after work may be unable to follow a frequent intraday rule. Conversely, using a higher timeframe does not eliminate the need to monitor open orders and account exposure.
Keep the symbol, data provider and session consistent when comparing views. A chart using regular-session data can differ from one including extended hours. The same instrument label on different feeds does not guarantee identical candles, volume or historical coverage.
Why Shorter Timeframes Need Careful Cost Checks
Short intervals can produce more decision points and make execution costs large relative to the move being targeted. Liquidity depends on the instrument, venue and time of day; a one-minute chart does not itself cause poor liquidity. Higher timeframes are not automatically less stressful, and neither interval choice nor a high win rate establishes profitability.
For a simplified illustration, 10 winning trades averaging $12 produce $120, while 10 losing trades averaging $8 lose $80. That is $40 before costs. If each of the 20 completed trades costs $3 in total, the result becomes a $20 loss. The point is to evaluate net outcomes, not to pursue more trades merely because more bars are available.
Overtrading means taking decisions outside a justified process, not simply trading below a particular interval. Define valid setups, costs, exposure limits and stopping conditions. A slower chart can encourage a more manageable routine, but it does not automatically create discipline or a profitable edge.
Avoid Future Information in Multi-Timeframe Tests
At a 15-minute decision point, the current daily candle may still be forming. Its eventual close, high or low is not yet known. A historical test that uses the finished daily value before it was available can overstate what the strategy could have done.
For a rule based on confirmed daily information, specify the most recent completed daily bar and when that value becomes available to the shorter-interval rule. If a rule deliberately uses an evolving higher-timeframe value, test that behavior explicitly. TradingView’s repainting documentation explains why unconfirmed values and historical behavior can differ in Pine scripts.
Changing the chart interval also changes the meaning of bar-based inputs. Twenty bars on a 15-minute chart represent five hours of bar duration; twenty daily bars represent twenty trading bars on the daily chart. Neither necessarily equals the same elapsed calendar period across sessions and closures. Decide whether you are comparing a fixed bar count or a fixed time horizon.
Test the Choice in LuxAlgo
Start on LuxAlgo’s native charts with a clear symbol, provider, session and timeframe. Ask Quant, our coding agent to implement or explain your rule, inspect the generated code and run it manually. Confirm which information is available at each decision point, especially if the script combines intervals.
Use native strategy settings to define capital, order size, commission and slippage. Use standard candles for realistic price-based testing rather than treating averaged Heikin Ashi prices as executable fills. Save the baseline before changing the interval or parameters.
- Compare a small set of intervals selected for a reason, keeping the evaluation period and cost assumptions explicit.
- Inspect trades, drawdown, trade duration and net outcomes; do not select a timeframe by win rate alone.
- Check a later period that did not determine the settings, and review whether results depend on a few trades.
- Confirm that the routine fits your availability before considering live use.
The workspace demonstration below shows how to keep related chart experiments organized. It does not establish that a strategy is profitable or configure a live order connection.
Frequently Asked Questions
What is the best timeframe for trading?
There is no universal choice. Select an interval that fits the rule, instrument, costs and availability, then test it with realistic assumptions.
Must every strategy use multiple timeframes?
No. Broader context can be useful, but an additional timeframe should have a defined role. Test whether it improves the process rather than adding it automatically.
Are one-minute charts inherently unhealthy?
No. Short intervals can demand frequent decisions and make costs significant relative to the target move. Suitability depends on the actual strategy, market and trader’s routine.
Can a daily resistance level predict a gap?
A marked level can frame a scenario, but it does not establish the cause or timing of a later gap. A selected historical chart sequence is not proof of predictive reliability.
What should I check in a multi-timeframe backtest?
Check when each value becomes available, whether higher-timeframe bars are confirmed, and how costs, sessions, sizing and bar-based inputs affect the comparison.
Read next