Top 5 Single-Candle Continuation Patterns for Trading
Marubozu, spinning top, doji, long-legged doji, and high-wave candles can all appear inside an ongoing trend. However, they are not five automatic continuation signals. Marubozu describes directional movement within a candle; the other four mainly describe indecision. A continuation strategy needs a trend definition, a later trigger, and explicit risk rules.
This guide keeps the five shapes separate from the trade decision. Use LuxAlgo's native charts to inspect them and Quant, our coding agent, to turn precise conditions into a strategy you can review and test.
Quick comparison
| Candle | Defining shape | What it does not establish |
|---|---|---|
| Marubozu | A body occupying nearly or completely the high-low range. | That momentum will continue after the candle closes. |
| Spinning top | A small body with shadows on both sides. | Whether the pause resolves upward or downward. |
| Doji | Open and close at almost the same price. | A directional entry without surrounding context. |
| Long-legged doji | A doji with long upper and lower shadows. | That a large range makes the next move more predictable. |
| High-wave candle | A small body with unusually long shadows on both sides. | That the existing trend remains intact. |
The StockCharts introduction to candlesticks distinguishes candle anatomy from interpretation and describes doji as neutral on their own. “Single-candle” refers to the shape's bar count, not necessarily the number of bars required to confirm a trade.
1. Marubozu: directional movement within the candle
A strict bullish marubozu opens at its low and closes at its high; a bearish one opens at its high and closes at its low. Real-world detectors may allow small wicks. Specify that tolerance and, if you require a large candle, define size relative to recent ranges.
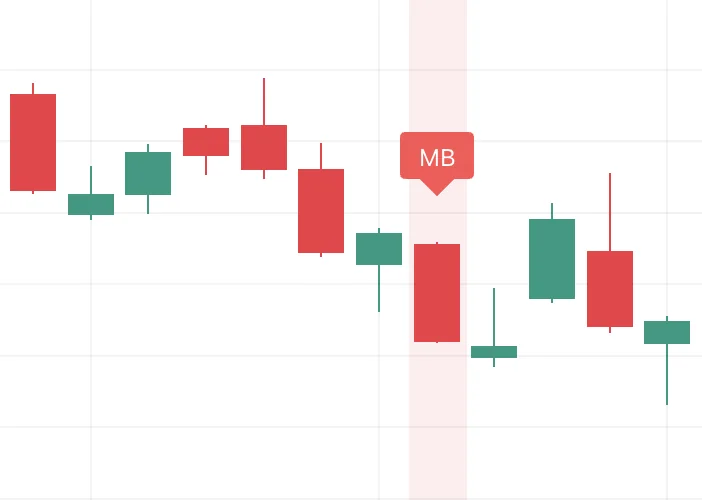
For continuation research, require the candle's direction to agree with a trend rule established before the entry. Test a next-bar entry separately from a later breakout entry. A large directional candle can leave little room to a nearby level, so evaluate the actual entry-to-stop distance rather than chasing the body because it looks strong.
2. Spinning top: indecision within a trend
A spinning top has a small real body and shadows above and below it. The shadows need not be exactly equal. The limited open-to-close change does not mean the market was quiet; price may have traveled substantially in both directions.
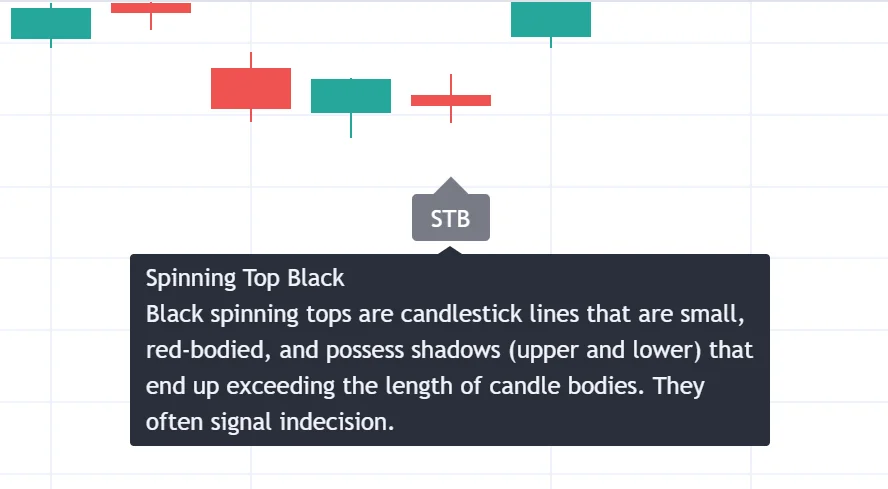
A continuation hypothesis could require a close above its high during an uptrend, or below its low during a downtrend. That is a proposed trigger to evaluate, not a property inherent in the spinning top. Repeated small bodies in a range may offer little additional information.
3. Doji: little net movement from open to close
A doji has a negligible real body, while wick lengths can vary. A detector must translate “negligible” into a numerical rule. The instrument's tick size and the candle's total range matter, especially when the entire candle is very small.
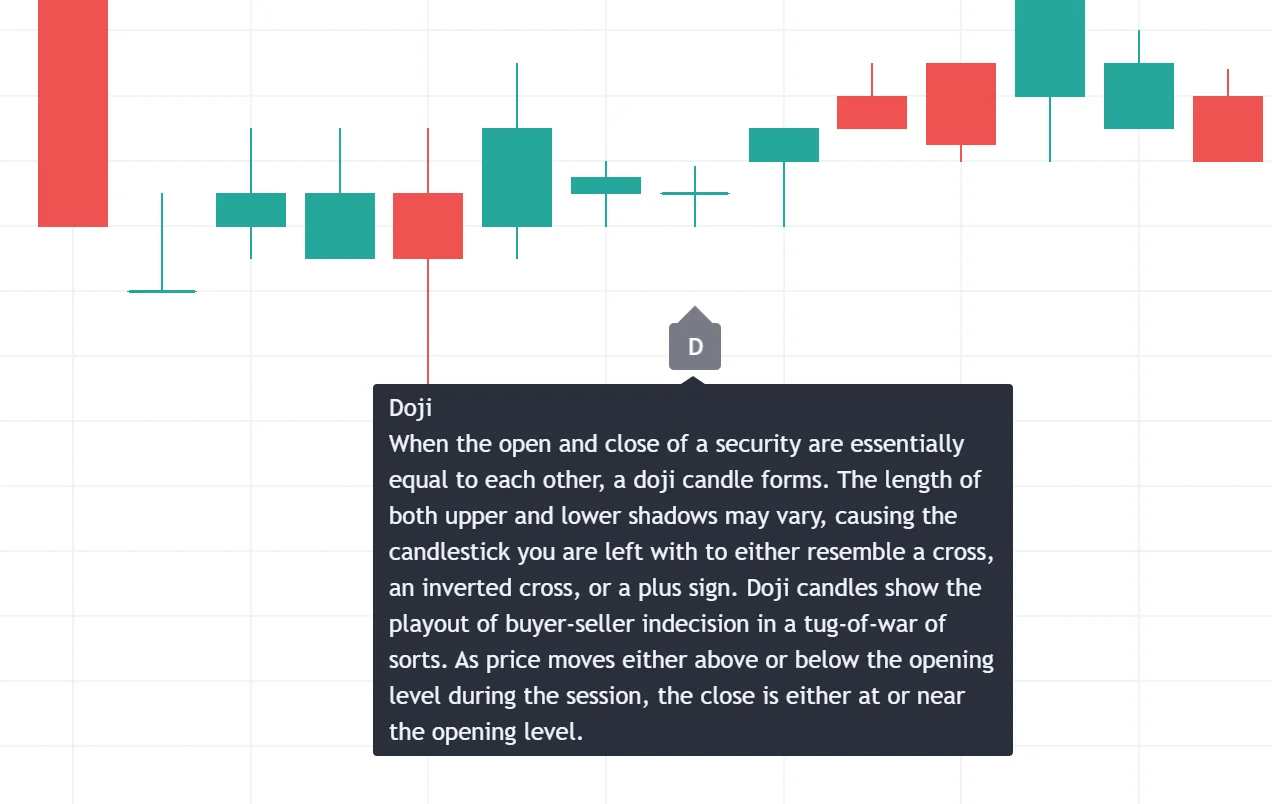
One research definition is a body no larger than 10% of a positive high-low range. This is an illustrative threshold, not a universal standard. Handle zero-range candles separately to avoid dividing by zero, and exclude them from a range-breakout test unless the strategy explicitly covers them.
Waiting for a subsequent close beyond the doji's range creates a confirmation rule. If the signal uses that close, an entry earlier in the same candle would introduce information unavailable at the time.
4. Long-legged doji: a wide excursion with little net change
A long-legged doji adds substantial upper and lower shadows to a near-zero body. It shows that the interval reached well beyond the opening area before closing near it. Define “long” relative to recent bars rather than relying only on a visual impression.
A continuation test can use its high and low as a bracket. For example, evaluate an upward close beyond the high only when the preselected trend filter remains bullish. Cancel the candidate if the opposite boundary fails first or its allowed confirmation window expires.
A wider candle often means a larger entry-to-stop distance. Reduce quantity if necessary to keep the same planned loss budget. Do not tighten the stop arbitrarily inside the candle just to obtain a more attractive reward-to-risk number.
5. High-wave candle: two-sided volatility
A high-wave candle has a small body with unusually long shadows on both sides. Its overlap with spinning tops and long-legged doji is a classification issue: the labels describe related shapes, not three independent confirmations.
Thresholds such as a body below 20% of range, each shadow at least twice the body, or range above a recent average are possible implementation choices. They are not universal proof of a high-wave candle or of continuation. A detector also needs rules for very small bodies and overlapping labels.
High volume can add context, but it does not choose the direction of the next move. Around news or thin trading conditions, the candle may chiefly reflect unstable prices. Evaluate continuation and reversal outcomes separately instead of assuming the earlier trend survived.
Make the candle rules measurable
For open O, high H, low L, and close C, define range = H − L, body = |C − O|, upper shadow = H − max(O, C), and lower shadow = min(O, C) − L. These quantities let you specify a detector consistently across charts.
For example, O = 100, H = 103, L = 97, and C = 100.20 gives range 6, body 0.20, upper shadow 2.80, and lower shadow 3. The body is 3.33% of range. It passes the illustrative 10% doji threshold, but calling its legs unusually long requires a comparison with recent candles.
If the same bar qualifies as both doji and high wave, decide whether to assign one priority label or retain both labels while counting a single trading event. Counting duplicate signals as independent trades can mislead a performance comparison.
A testable continuation example
The following is a research specification for a daily long-only doji setup, not a performance claim:
- Trend: On the candidate's close, price is above its 50-day EMA and that EMA is above its value five completed bars earlier.
- Shape: The candidate has a positive range and body no greater than 10% of range.
- Confirmation: During the next three completed candles, wait for the first close above the candidate high while the same trend rule holds. Cancel if any candle trades below the candidate low first; if confirmation and invalidation occur within the same candle, reject that candidate.
- Entry: Enter only when flat at the next opening execution after confirmation. Do not create additional candidates while a candidate or position is active.
- Risk and exit: Set the initial stop one tick below the candidate low and a target two times the actual entry-to-stop distance above entry. Specify costs, maximum holding time, and test-end handling before running the test.
If the candidate high is 103 and low is 97, a later close at 103.20 could confirm. With a next-open fill at 103.50 and a 0.01 tick, the stop is 96.99 and planned risk is 6.51 per share. A 130.20 loss budget permits 20 shares before costs, with 2,070 of capital exposure. A 2R target is 116.52. These figures describe the hypothetical fill, not a promise that either exit will execute at its intended price.
Allow for commission and adverse execution within the budget. If the opening price is unsuitable, skip or resize according to a predetermined policy. Stops can execute worse than their trigger during a gap, and a historical candle touching both stop and target needs a stated fill-model assumption.
Use LuxAlgo to inspect and test the rules
Start on native charts with the intended symbol, interval, and session. Add the indicators needed for the trend rule, then inspect several matching and nonmatching candles. A visible historical label is only useful for a backtest if its detection time is known.
Ask Quant to implement the exact detector and strategy rules. Review the code, configure simulation costs and sizing, and inspect individual trades. Confirm that candle-close conditions cannot create earlier entries. Test later periods using the same frozen specification before revising it.
The Candlestick Structure indicator is a related tool for trend-aligned candlestick research. Its documented sixteen formations include multi-candle patterns; it should not be described as a universal detector for the five shapes in this article. Its alignment percentage measures agreement with a selected trend method, not the probability that a trade will win.
On supported markets, footprint analysis adds executed-volume context by price. Confirm data coverage for the symbol and session. Candle geometry, executed-volume imbalance, and resting orders are different information; none supplies a guaranteed continuation signal.
Keep TradingView toolkit features and legacy strategy-alert workflows distinct from native Quant strategies. A script, chart label, and executable broker order are different outputs. Use the documented capabilities of the specific tool rather than assuming every pattern has automatic alerts or a reliability score.
Review the complete strategy
- Compare a baseline: Test the trend rule with and without the candle filter using matching dates and cost assumptions.
- Inspect failures: Include invalidated candidates, missed breakouts, and rejected signals, not just attractive historical examples.
- Check the trade distribution: Review net results, trade count, drawdown, average win and loss, holding time, and exposure.
- Avoid future information: Use completed higher-timeframe values and record when retrospective labels actually became available.
- Separate variations: Different body thresholds, confirmation windows, and exit rules are different experiments. Record the search history.
A clear candle definition makes a strategy reproducible. Whether that strategy adds value remains a question for a realistic test, not something the pattern's name can answer.
FAQs
What is the trend continuation candle pattern?
A continuation setup seeks movement in the direction of an existing trend after a pause or confirming event. A single candle can supply a shape or reference range, but doji, spinning tops, and high-wave candles are neutral by themselves. Define the trend, confirmation, entry, and exits, then evaluate the complete strategy rather than assuming the candle guarantees continuation.
Read next