Top 7 Bearish Reversal Patterns Explained
Bearish reversal candlestick patterns describe price formations that can warn of weakening upward momentum. They do not prove that a downtrend has started. First establish an advance to reverse, identify the completed pattern, then evaluate a clearly defined entry or exit rule with realistic risk and execution assumptions.
The seven patterns below differ in their body, wick and gap requirements. Native LuxAlgo charts and the Library can help you inspect those structures; Quant, our coding agent, can help turn precise rules into a strategy you review and run manually. A pattern label is a research starting point, not a trade instruction.
The Seven Patterns at a Glance
| Pattern | Candles | Defining feature | Common mistake |
|---|---|---|---|
| Bearish engulfing | 2 | A bearish real body surrounds the preceding bullish real body | Requiring both wicks to be engulfed |
| Dark cloud cover | 2 | A bearish candle opens higher and closes below the prior bullish body midpoint | Using the high–low midpoint instead of the body midpoint |
| Evening star | 3 | Bullish candle, small elevated body, then bearish penetration into the first body | Treating the middle candle alone as a completed pattern |
| Shooting star | 1 | Small body near the low with a long upper wick after an advance | Calling every long red candle a shooting star |
| Bearish harami | 2 | Small real body contained in the previous larger body after an advance | Confusing body containment with an inside bar |
| Three black crows | 3 | Substantial bearish bodies with progressively lower closes | Labeling any three red candles as crows |
| Bearish abandoned baby | 3 | Bullish candle, isolated doji with full gaps, then bearish candle | Starting with a bearish candle or ignoring wick overlap |
A candle’s real body spans its open and close; its full range spans its low and high. Green/white commonly means close above open, and red/black means close below open, but chart colors are configurable. Use the prices rather than color names when implementing a rule. The StockCharts bearish-pattern guide discusses the classic structures and their dependence on an existing advance.
1. Bearish Engulfing
After an advance, a bullish candle is followed by a bearish candle whose real body contains the first candle’s real body. Under a strict version, the second open is above the first close and the second close is below the first open. Some implementations allow equality at an edge; choose the convention before comparing detections.
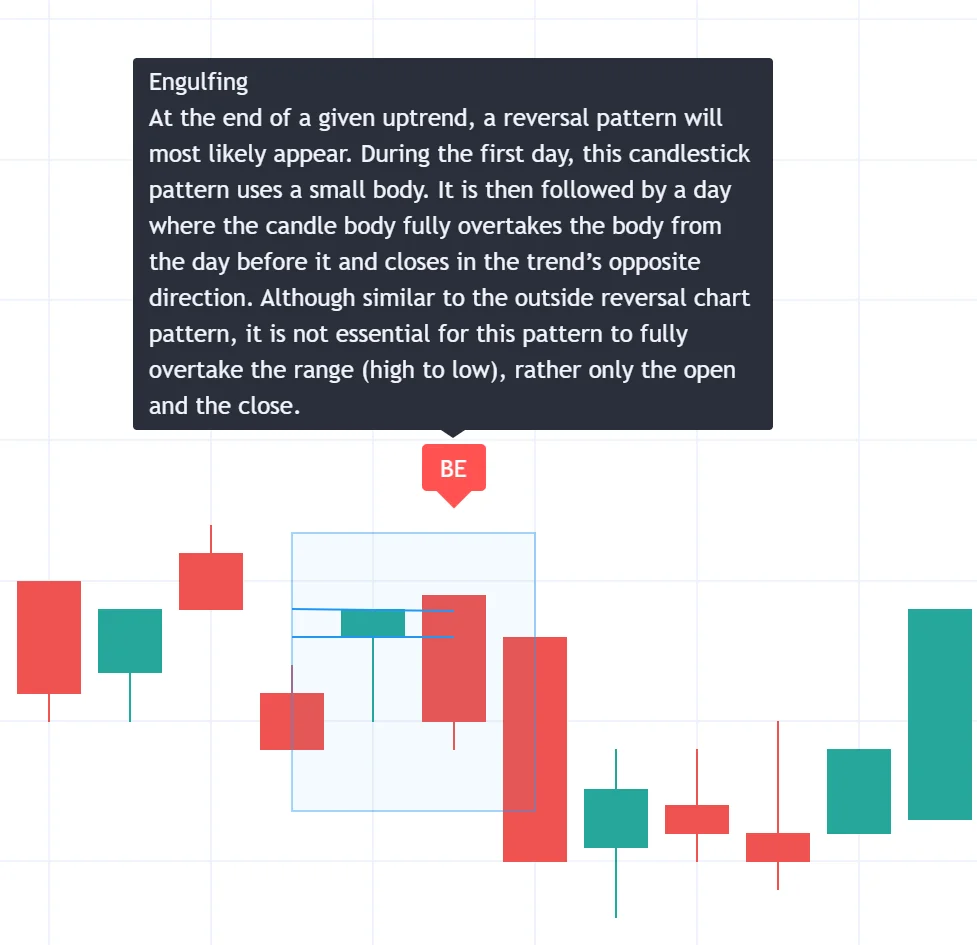
Example: candle one opens at 100 and closes at 104; candle two opens at 105 and closes at 99. The second body engulfs the first. Its high does not have to exceed the first high, nor its low the first low. Engulfing the entire high–low range is a different condition.
Possible follow-through rules include a later close below the pattern low or a break of previously identified support. These are additional filters, not parts of body engulfment. Waiting can avoid some failed setups but also produce a later entry. High volume describes increased participation; it does not guarantee that sellers will continue to push price lower.
2. Dark Cloud Cover
A bullish candle is followed by a bearish candle that opens higher and closes below the midpoint of the first candle’s real body, while remaining above its open in the usual distinction from engulfing. Classic descriptions differ on the gap: StockCharts uses an open above the previous close; a stricter version requires an open above the previous high. State which definition your scanner uses.
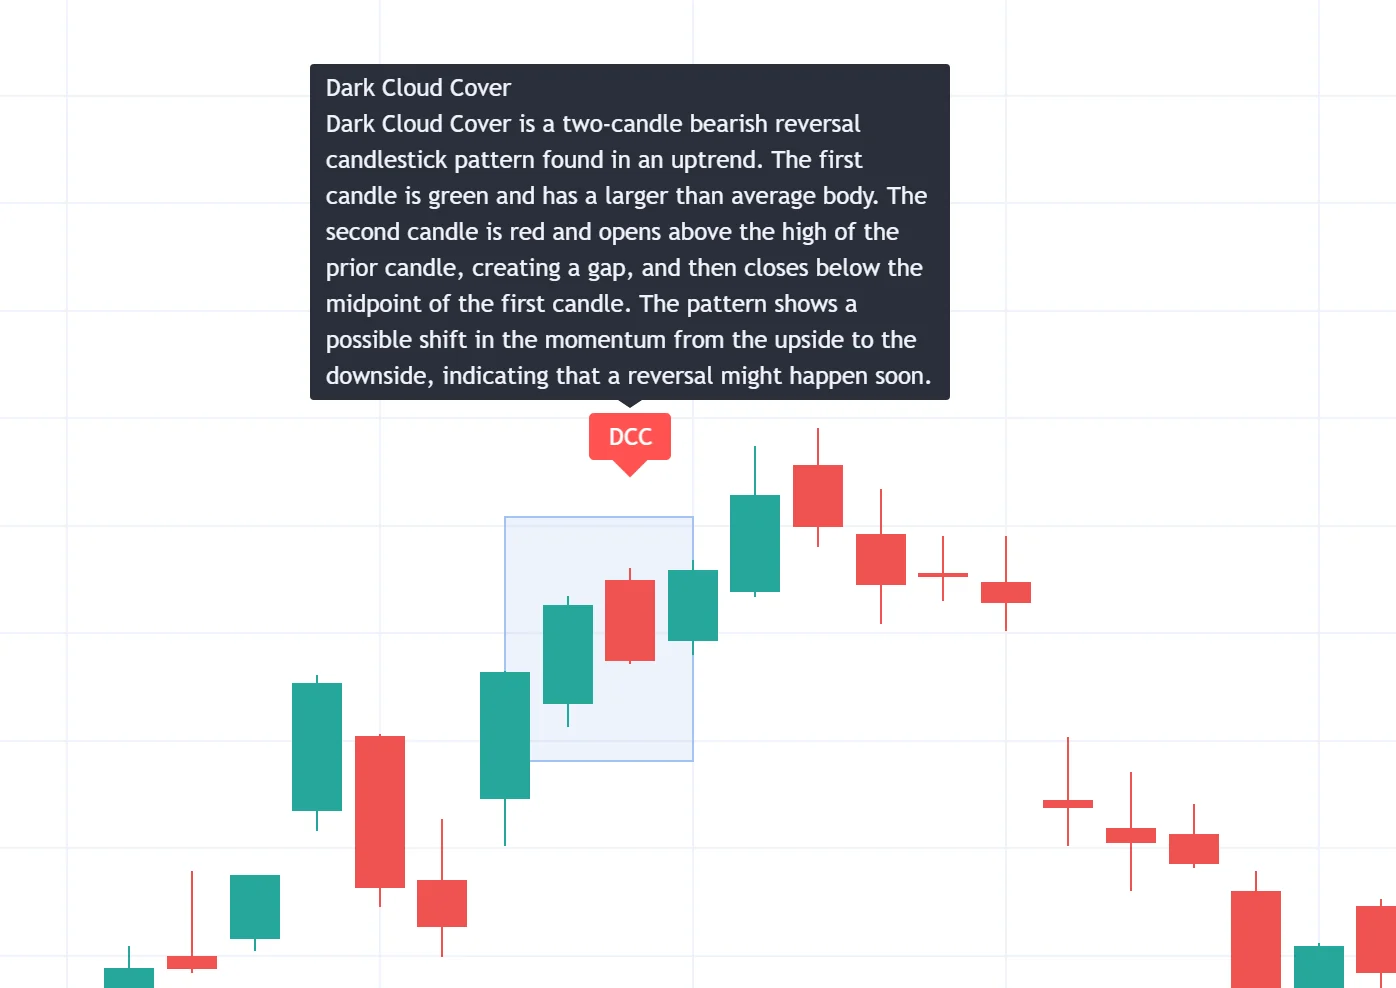
Example: a first candle opens at 100, closes at 110 and reaches a high of 112. Its body midpoint is 105. A second candle opening at 113 and closing at 104 satisfies the stricter opening condition and penetrates beyond the midpoint. A close at 106 would not meet the below-midpoint rule; a close below 100 would also engulf the first body.
Location near a level identified before the pattern can provide context, but there is no universal reliability ranking that makes dark cloud cover superior to other formations. A later support break, momentum change or volume filter should be assessed as a separate testable condition.
3. Evening Star
An evening star develops over three candles: a substantial bullish body, a small body in an elevated position, and a bearish body that returns into the first candle’s body. A common rule requires the third close below the first body’s midpoint. The middle body may be bullish, bearish or a doji; a doji version is often called an evening doji star.
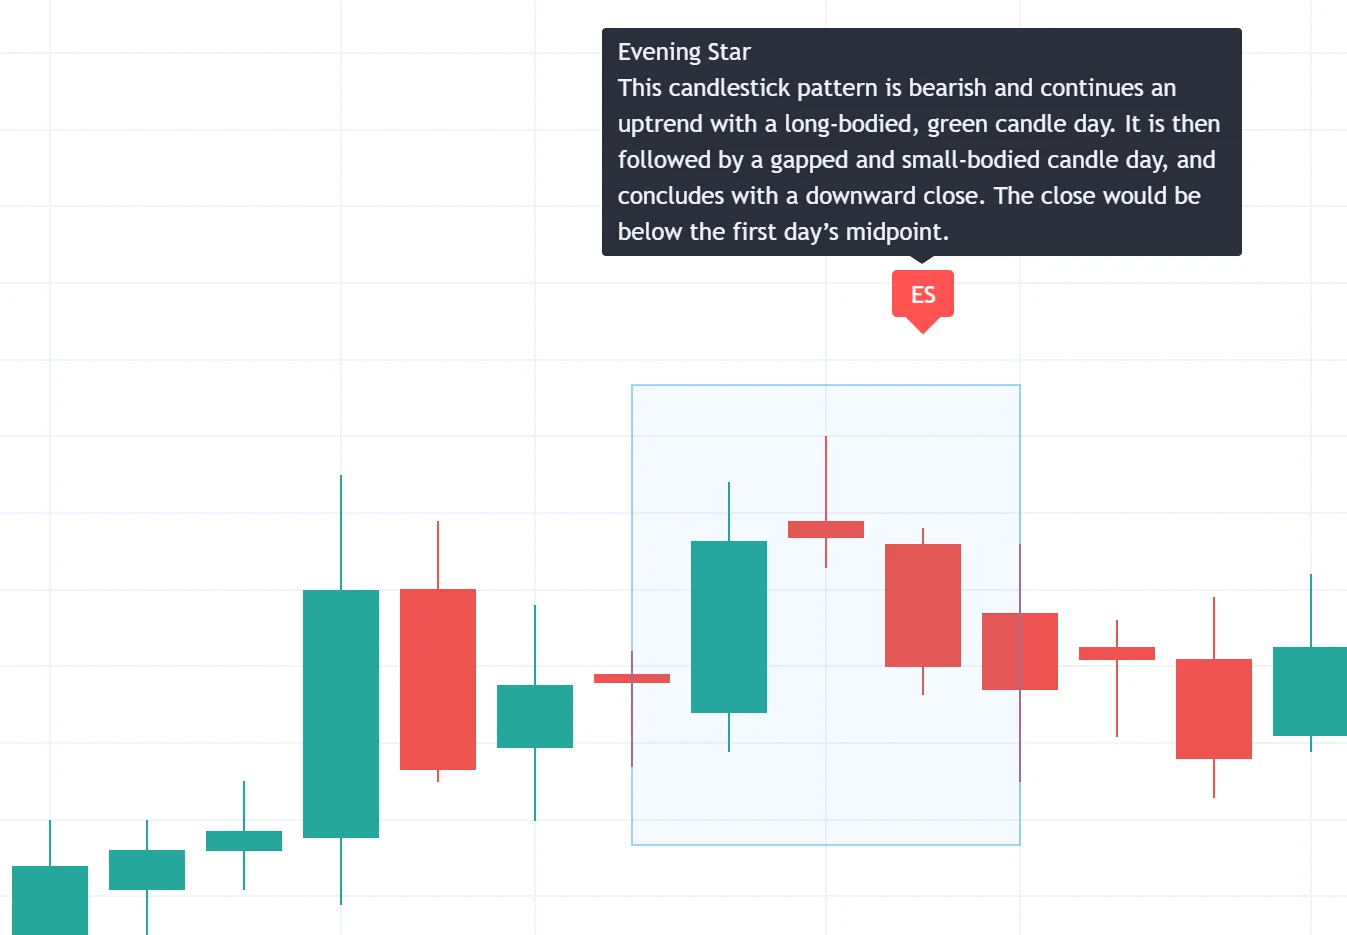
Traditional gap conditions concern the middle body’s separation from the first. A full wick-to-wick gap on both sides of a doji is the more restrictive abandoned-baby structure discussed below. In markets where adjacent bars usually open near the previous close, relaxed evening-star definitions may find different events from strict session-gap definitions.
The third candle completes the pattern, so an additional gap after it is not mandatory. If your strategy waits for another lower close, that creates a later decision point. Never record an entry on the first or second candle using knowledge of the third candle’s eventual close.
4. Shooting Star
A shooting star has a small real body toward the bottom of its range, a long upper wick and little or no lower wick after a price advance. A frequently used proportion is an upper wick at least twice the body length. Either body color can qualify. Define “small” and “little” numerically when testing, and handle a zero-length body explicitly.
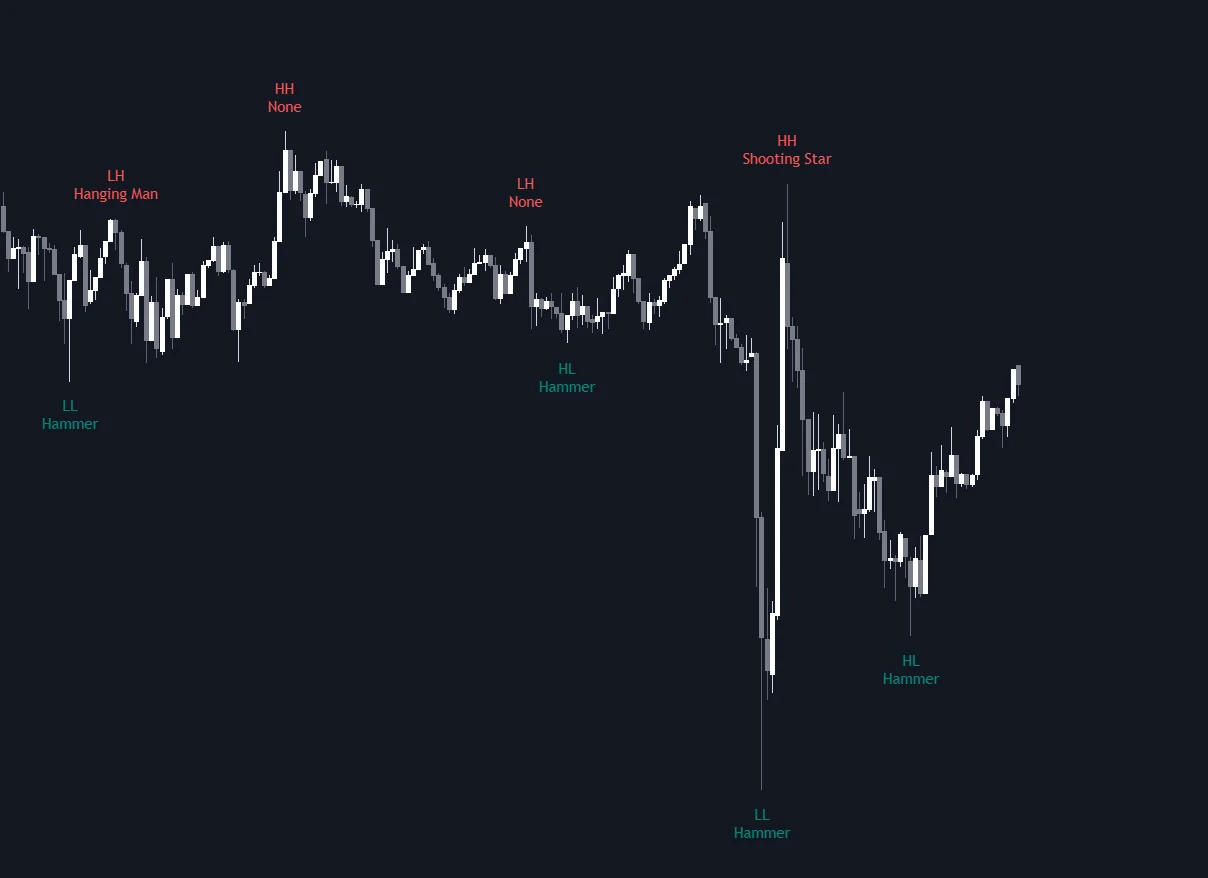
Example: open 108, close 109, high 113 and low 107.8 give a body of 1, an upper wick of 4 and a lower wick of 0.2. The proportions fit an illustrative shooting-star rule, but the preceding trend still determines its context. The same general shape after a decline is usually discussed as an inverted hammer.
The upper wick shows that the close did not retain the bar’s highest traded prices. OHLC data alone does not reveal the exact sequence of every intrabar move. A subsequent lower close or break beneath the candle can be a chosen trigger, but “within 1–3 days” is not a universal requirement across all timeframes.
5. Bearish Harami
A harami places a small real body inside the preceding larger real body. After an advance it can warn of a pause or possible bearish turn. A large bullish candle followed by a small bearish candle is a common illustration, but broader classic descriptions allow other color combinations. The prior trend and the containment rule matter more than insisting on one color pair.
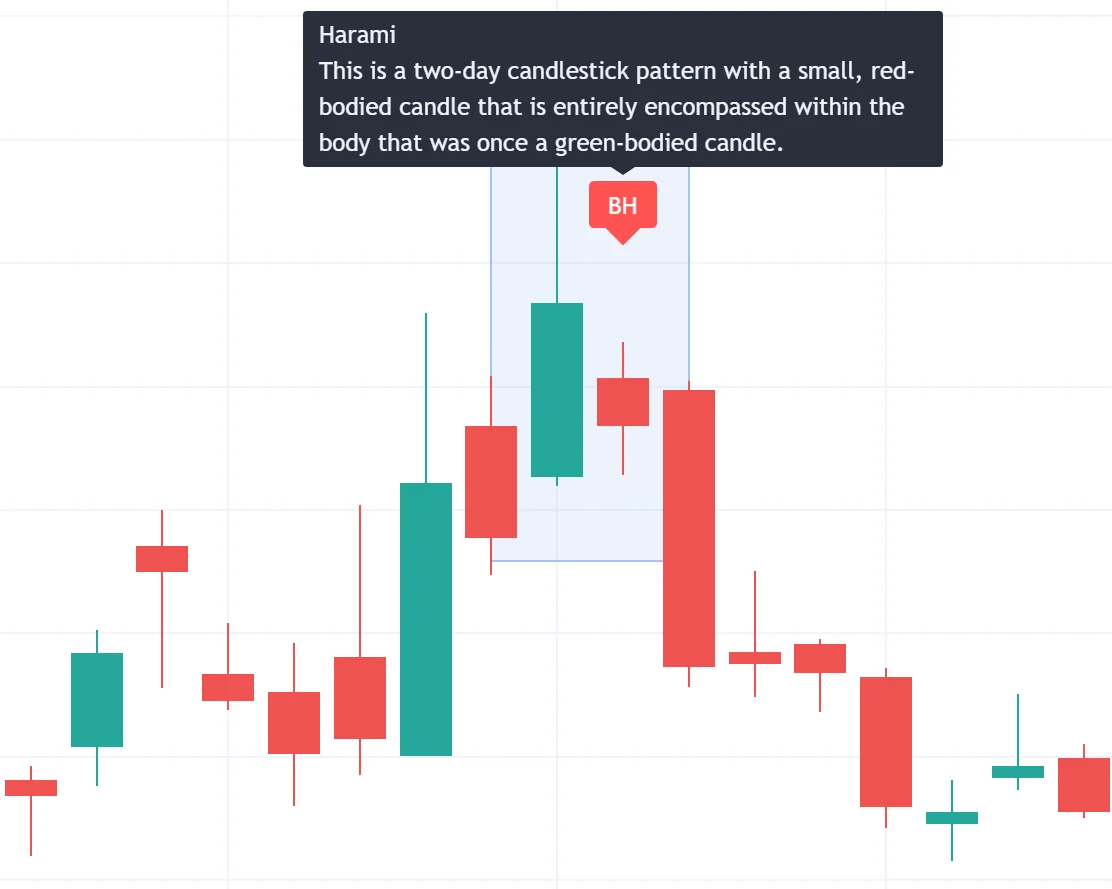
Example: the first candle opens at 100 and closes at 110; the next opens at 108 and closes at 106. Its body is contained between 100 and 110. Its wicks need not both remain inside the first body. An inside bar instead compares the candles’ complete high–low ranges.
Containment can also represent consolidation before the advance resumes. A higher-volume second bar is not a defining requirement and does not turn indecision into certain selling pressure. Evaluate a specified support break or exit rule rather than treating every harami as a short entry.
6. Three Black Crows
Three black crows consist of three substantial bearish candles with successively lower closes and closes near their lows. The second and third generally open inside the preceding real body. Small lower wicks help distinguish sustained bearish bodies from candles that recovered strongly from their lows. The StockCharts pattern dictionary summarizes the conventional structure.
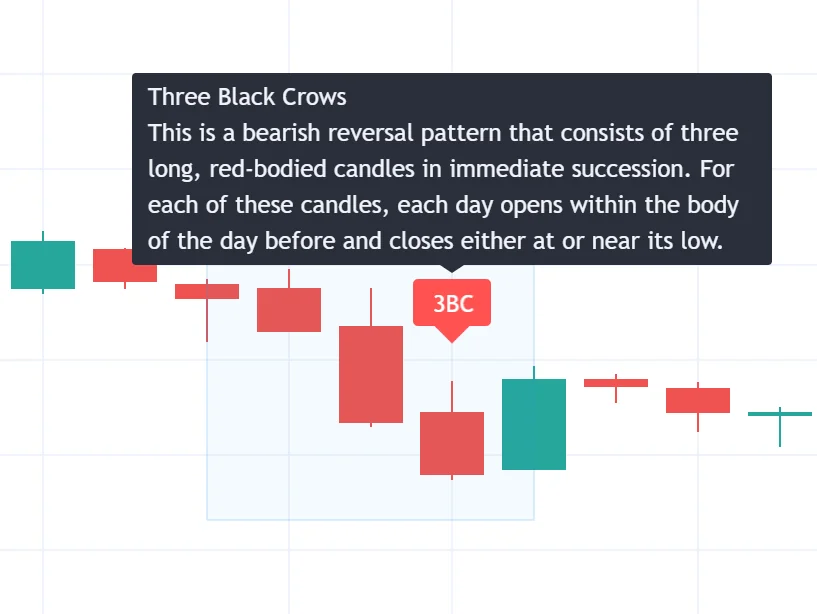
To classify the formation as a reversal, assess the advance before the three-candle sequence. The same bearish candles within an existing decline can describe continued weakness instead. Not every sequence of three lower closes qualifies: specify body size relative to recent bars, opening location and maximum lower-wick size.
By the third close, a substantial decline may already have occurred. Chasing that move can leave little room before support or create a wide stop distance. Rising volume across all three bars may be a research filter, but it is not an indispensable condition or proof that the pattern is more profitable than a one-candle formation.
7. Bearish Abandoned Baby
The bearish abandoned baby begins with a bullish candle after an advance, followed by a doji that is isolated above the surrounding candles, and then a bearish candle below the doji. Under the strict interpretation, the doji’s low is above both the first candle’s high and the third candle’s high. The complete ranges, including wicks, do not overlap the doji.
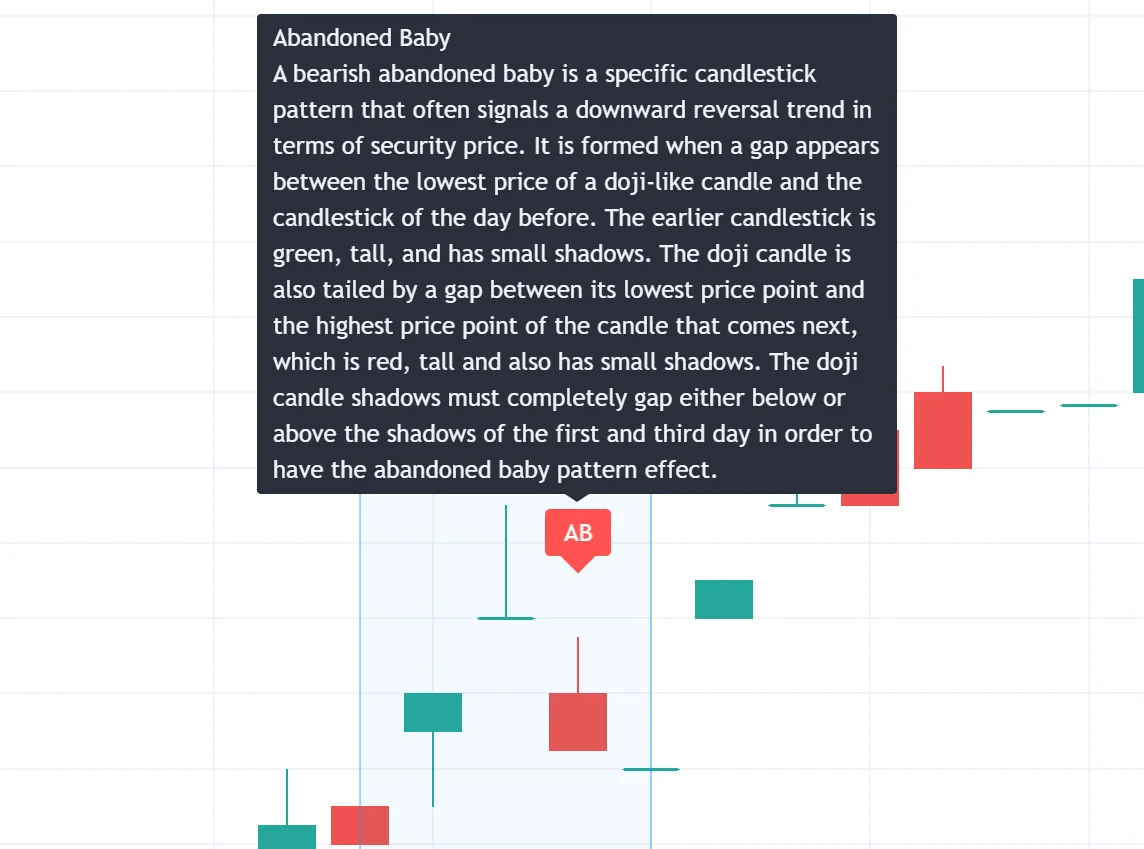
A small bullish body is not automatically a doji: define the acceptable open–close difference relative to range or tick size. A final close below the first candle’s low is not essential to the basic pattern. The third candle’s bearish move and separation from the doji distinguish this from an unfinished pause at the top.
| Candle | Open | High | Low | Close | Check |
|---|---|---|---|---|---|
| First: bullish | 100 | 111 | 99 | 110 | Advance ends with a bullish body |
| Second: doji | 114 | 115 | 113 | 114 | Low 113 is above first high 111 |
| Third: bearish | 110 | 112 | 103 | 104 | High 112 is below doji low 113 |
Here the doji is isolated by a 2-point gap above the first high and a 1-point gap above the third high. The third close at 104 is below the first body midpoint of 105 but still above the first low of 99. This shows why requiring a close below that low would impose an extra rule.
Strict full-range gaps are unusual on uninterrupted intraday series. Changing the session template or using a relaxed gap definition can change detections. Keep those choices fixed and label a modified pattern honestly rather than silently treating it as the classic abandoned baby.
How to Use Bearish Reversal Patterns Effectively
Define the Trend and Location First
Use information available before the setup: for example, a chosen moving-average rule or already confirmed higher highs and higher lows. No particular 20-, 50- or 200-bar average is mandatory. If your swing method needs future bars to confirm a pivot, respect that delay in a backtest. Resistance should be marked before evaluating the outcome, not selected afterward because price happened to turn there.
Separate the Pattern From Additional Evidence
Volume measures participation in matched trades, not a literal excess of sellers over buyers. Compare like sessions and data sources; exchange-specific volume need not represent the whole market, and some markets provide tick volume rather than centralized traded volume. An above-average-volume filter is an additional condition to test.
RSI, MACD and moving averages can describe momentum or trend, but all overlap with price information. Agreement is not independent proof. RSI can remain elevated during a strong advance. If you use a momentum crossover, specify its completed-bar timing instead of adding a vague instruction to “confirm with indicators.”
| Decision | Define before testing | Why it matters |
|---|---|---|
| Detection | Body/wick thresholds, gap convention and prior-trend rule | Different implementations find different candles |
| Trigger | Pattern close, later support break or other exact condition | A later trigger cannot be backdated |
| Expiry | How many bars a pending setup remains valid | Old signals should not stay active indefinitely |
| Risk | Position size, stop, target and gap assumptions | A pattern is not a complete trade plan |
| Evaluation | Costs, sample period, trade count and later-period check | A selected chart does not establish an edge |
Use Native LuxAlgo Charts and Quant
Open your LuxAlgo workspace and select the active chart. Use ordinary candles to inspect actual open, high, low and close values; transformed candles can change pattern geometry. From Indicators, choose Basic studies such as RSI or MACD, or browse the built-in LuxAlgo Library. The native indicator guide covers searching, settings, favorites and templates.
The current Reversal Candlestick Structure study lists sixteen supported formations and applies a stochastic-based context filter. Its listed bearish patterns include engulfing, evening star, shooting star, harami and three black crows. Dark cloud cover and abandoned baby are not listed among its supported patterns; do not assume one study detects all seven examples in this article.
Inspect the study’s pattern toggles, Trend Length, Threshold and Warmup Length. Its Reversal % dashboard is a detection-related measure, not a strategy win rate after entries, exits and costs. Some supported formations, such as rising and falling three methods, are conventionally continuation patterns; a study’s name does not change that distinction.
For a custom test, describe your exact geometry, preceding-trend rule, trigger, exit and risk constraints to Quant, our coding agent. Inspect the generated code and run manually. Making strategies with Quant explains that workflow; the strategy viewer helps review simulated results and individual trades. Include commission and slippage, and inspect several detections against the chart before trusting a summary.
Manage Risk Without a Universal Stop Percentage
A bearish pattern can prompt review of an existing long position; it does not require opening a short. If testing a short strategy, account for applicable borrow availability, borrowing costs and the possibility of losses exceeding the initial position value. A stop order cannot guarantee execution at its trigger price.
Illustrative sizing: an assumed short entry at 100 and stop at 103 imply 3 per share of price risk. With a 100 risk budget and 10 estimated total costs, 30 shares use that modeled budget: 30 × 3 + 10 = 100. If the position instead exits at 105 after a price gap, the modeled loss is 160 with the same costs. Borrowing costs would add to the total if not already included.
A stop fixed 1–2% above every pattern high ignores instrument volatility, tick size, setup width and execution conditions. Choose the invalidation rule first, calculate the distance to the assumed fill, then size the position. Check whether nearby support leaves sufficient room for your exit plan. Skip a setup when its risk assumptions do not fit the plan.
Compare the pattern-only rule with any added volume or momentum filters using the same data and costs. Review trade count, drawdown and sensitivity, then test a later period that was not used to choose parameters. None of the seven labels supplies a universal success probability or guarantees a continuing decline.
FAQs
Which bearish reversal pattern is most reliable?
There is no universal ranking. Results depend on the definition, market, timeframe, entry and exit rules, costs and sample period. Evaluate an explicit strategy rather than treating a pattern name as a success probability.
Does bearish engulfing require engulfing the wicks?
No. The conventional requirement concerns the real bodies between open and close. Engulfing the full high–low range is a separate, stricter condition.
Is the shooting star always a red candle?
No. A small body with a long upper wick can be bullish or bearish. Its proportions and position after an advance matter; a large red follow-through candle is not the shooting star itself.
How is an abandoned baby different from an evening star?
A strict bearish abandoned baby has a middle doji fully separated from both neighboring candle ranges by gaps. An evening star has a small middle body and less restrictive separation; it does not require the same full-range doji gaps.
Must every pattern be confirmed within three days?
No. Confirmation timing is a strategy choice expressed in the chart’s bars. Some three-candle patterns already include a bearish third candle. Any additional trigger and expiry should be defined before testing.
Can LuxAlgo test these pattern rules?
Native charts and Library studies support visual research. For a custom strategy, describe precise pattern and trade rules to Quant, inspect the generated code and run manually. Check the supported patterns of each study rather than assuming one indicator detects all seven.
Read next