Top Tools for Momentum Screening in TradingView
Momentum screening narrows a list of symbols to candidates that meet defined price-strength conditions. MOM, RSI, moving averages and MACD describe different aspects of that strength. LuxAlgo’s Library adds composite oscillators on a Quant Chart. None has a universal accuracy ranking, and displaying an indicator on one chart does not automatically scan an entire market.
Start by defining the universe, timeframe and condition you want to investigate. In native LuxAlgo charts, you can review candidates with standard indicators and use Quant to develop explicit research rules. If you use TradingView to scan symbols, distinguish its standard asset screeners from Pine Screener and from indicators displayed on Supercharts.
Choose the Tool for the Screening Question
| Tool | Question it can help answer | Main limitation |
|---|---|---|
| Momentum (MOM) | Is price above or below its value N bars ago? | Raw values use price units, so they are unsuitable for direct ranking across differently priced assets. |
| Relative Strength Index (RSI) | How strong are recent gains relative to losses? | High or low readings can persist; thresholds are not automatic reversal signals. |
| SMA, EMA and WMA | Where is price relative to a smoothed trend? | All use historical data; smoothing can delay recognition of a change. |
| Library oscillators | How do a configured oscillator, signal line and divergence components describe the chart? | A chart interpretation is not a verified market-wide scan or a performance advantage. |
| MACD | How do a faster and slower average differ, and how is that difference changing? | Whipsaws occur; raw values are not normalized for cross-symbol ranking. |
Choose complementary questions rather than adding indicators until a chart looks convincing. RSI, MOM, moving averages and MACD all derive from price. Their agreement can reflect overlapping calculations, not independent evidence that a trade will succeed.
Review Candidates in Native LuxAlgo Charts
Open LuxAlgo charts, select the active chart, and open Indicators. The native indicator guide lists RSI, MACD and moving averages in Basic, alongside a separate LuxAlgo Library section. Configure the source and length, then save a template if you want the same setup for later reviews.
Use Quant, our coding agent to express a custom momentum study or a complete strategy. For example, request a completed-bar condition combining a 20-period percentage price change, RSI and a trend filter. Specify actual OHLC inputs, the timeframe and how each condition is evaluated. Inspect the generated code and run the strategy manually, following the Quant strategy workflow.
Keep the research steps separate: a chart study describes a symbol, a screener searches a defined universe, and a strategy adds entry, exit, sizing and cost assumptions. An alert condition or notification is not an executed order or a verified profitable strategy.
1. Momentum Indicator (MOM)
A common MOM calculation is current close minus the close N bars earlier. A positive value means price is higher than that earlier close; a negative value means it is lower. Crossing zero changes that comparison. It does not prove the market has started a durable new trend.
Example: a close of 110 compared with 100 twenty bars earlier gives MOM = 10. Another asset rising from 1,000 to 1,010 also has MOM = 10, but the percentage gains are 10% and 1%. For cross-symbol ranking, consider a percentage measure such as ROC = 100 × (current close ÷ earlier close − 1), with matching lookbacks and data treatment.
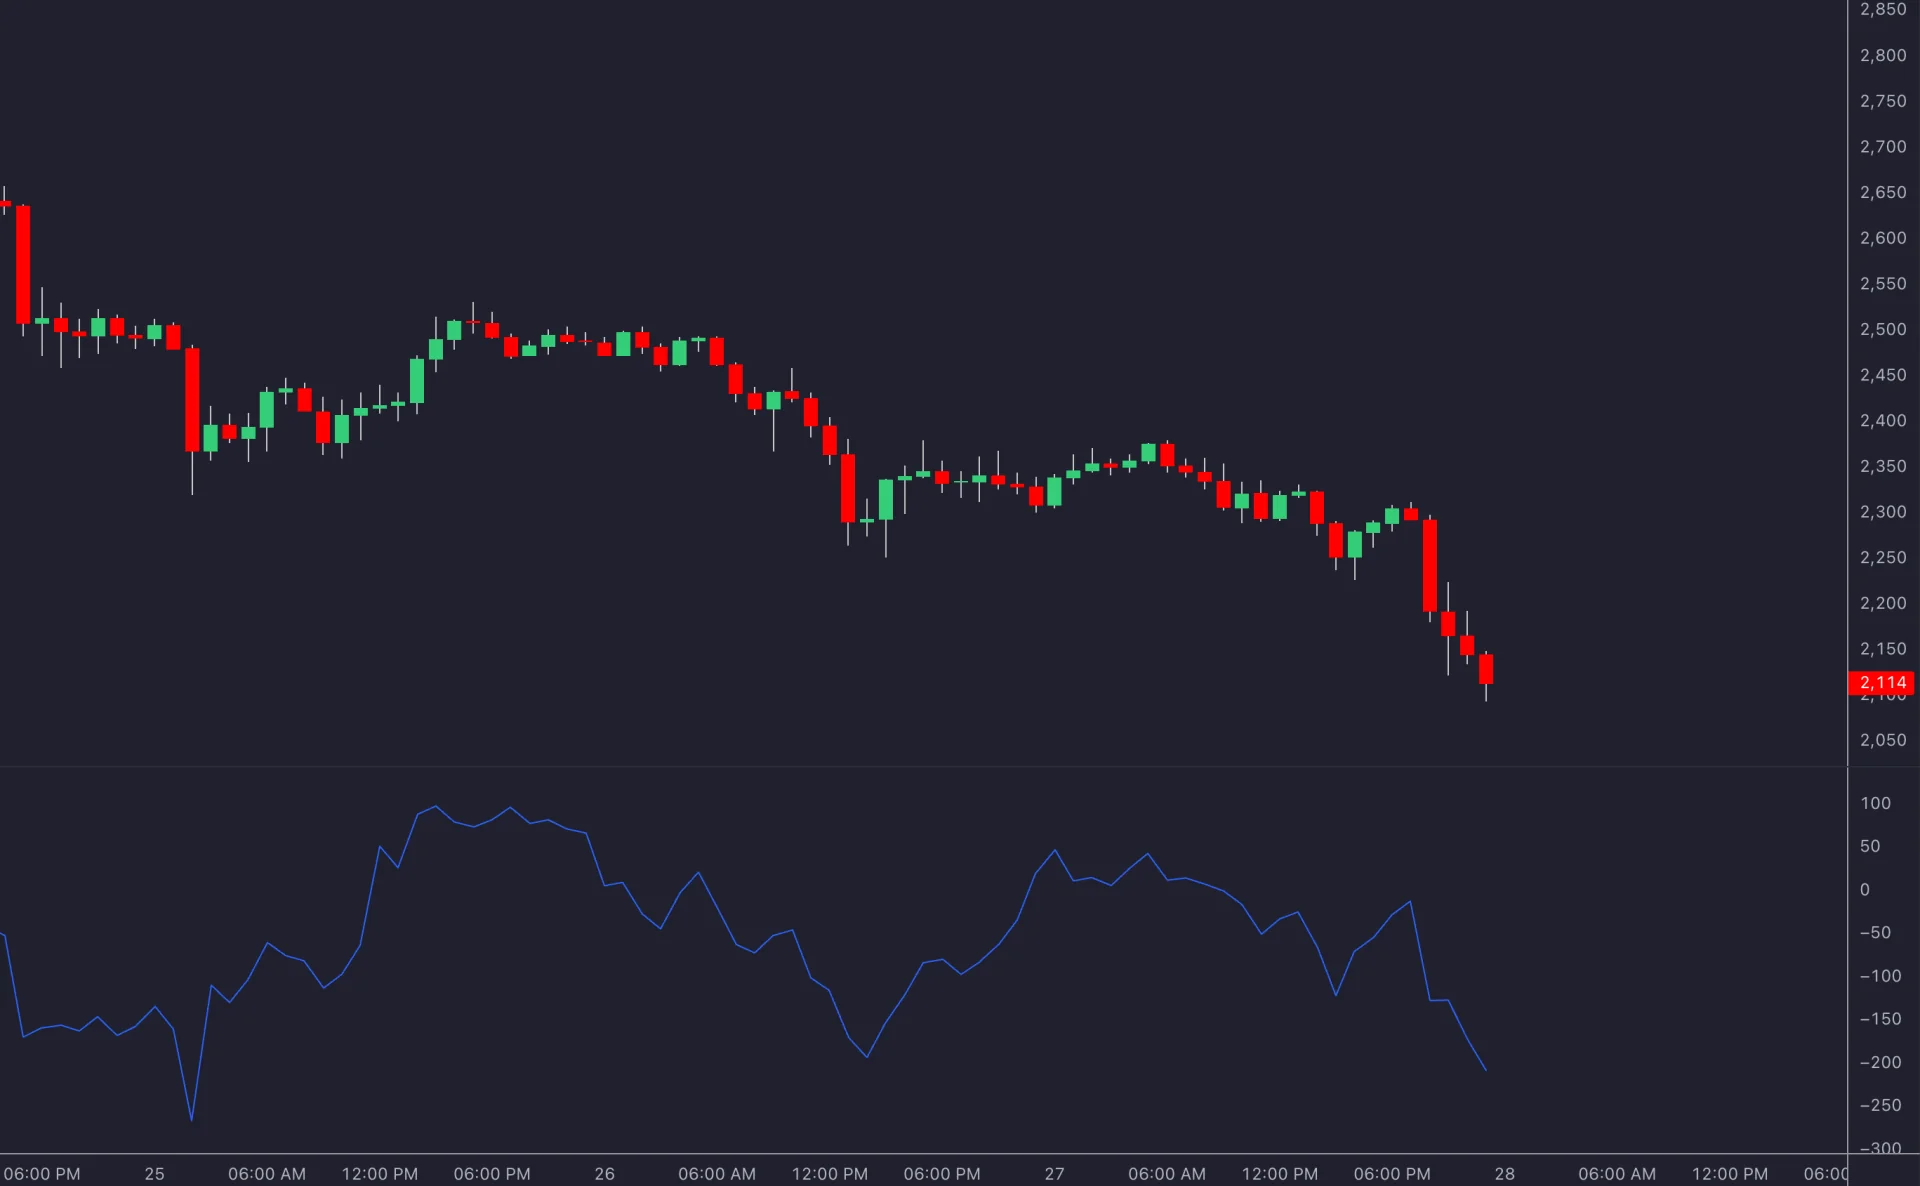
For a screen, define whether you want MOM above zero now, a fresh cross above zero on the latest completed bar, or a rising MOM value. These are different conditions. A shorter lookback reacts to a smaller slice of history and can generate more changes; a longer one may remain positive after a short-term decline.
Do not assume every standard screener exposes a custom MOM length. Use the available technical field when it matches your specification, or check whether a compatible Pine indicator can express the required calculation. Verify actual plot values on a few charts before trusting the filtered list.
2. Relative Strength Index (RSI)
RSI compares smoothed recent gains with smoothed recent losses on a 0–100 scale. The familiar calculation is 100 − 100 ÷ (1 + RS), where RS is average gain divided by average loss. Implementations commonly use Wilder’s smoothing; the lookback, source and initialization still matter when comparing values.
Readings above 70 or below 30 are conventional descriptions of elevated or depressed momentum, not compulsory sell or buy instructions. A continuation screen might deliberately look for RSI above 50, while a mean-reversion study might investigate a cross back above 30. State which hypothesis you are testing.
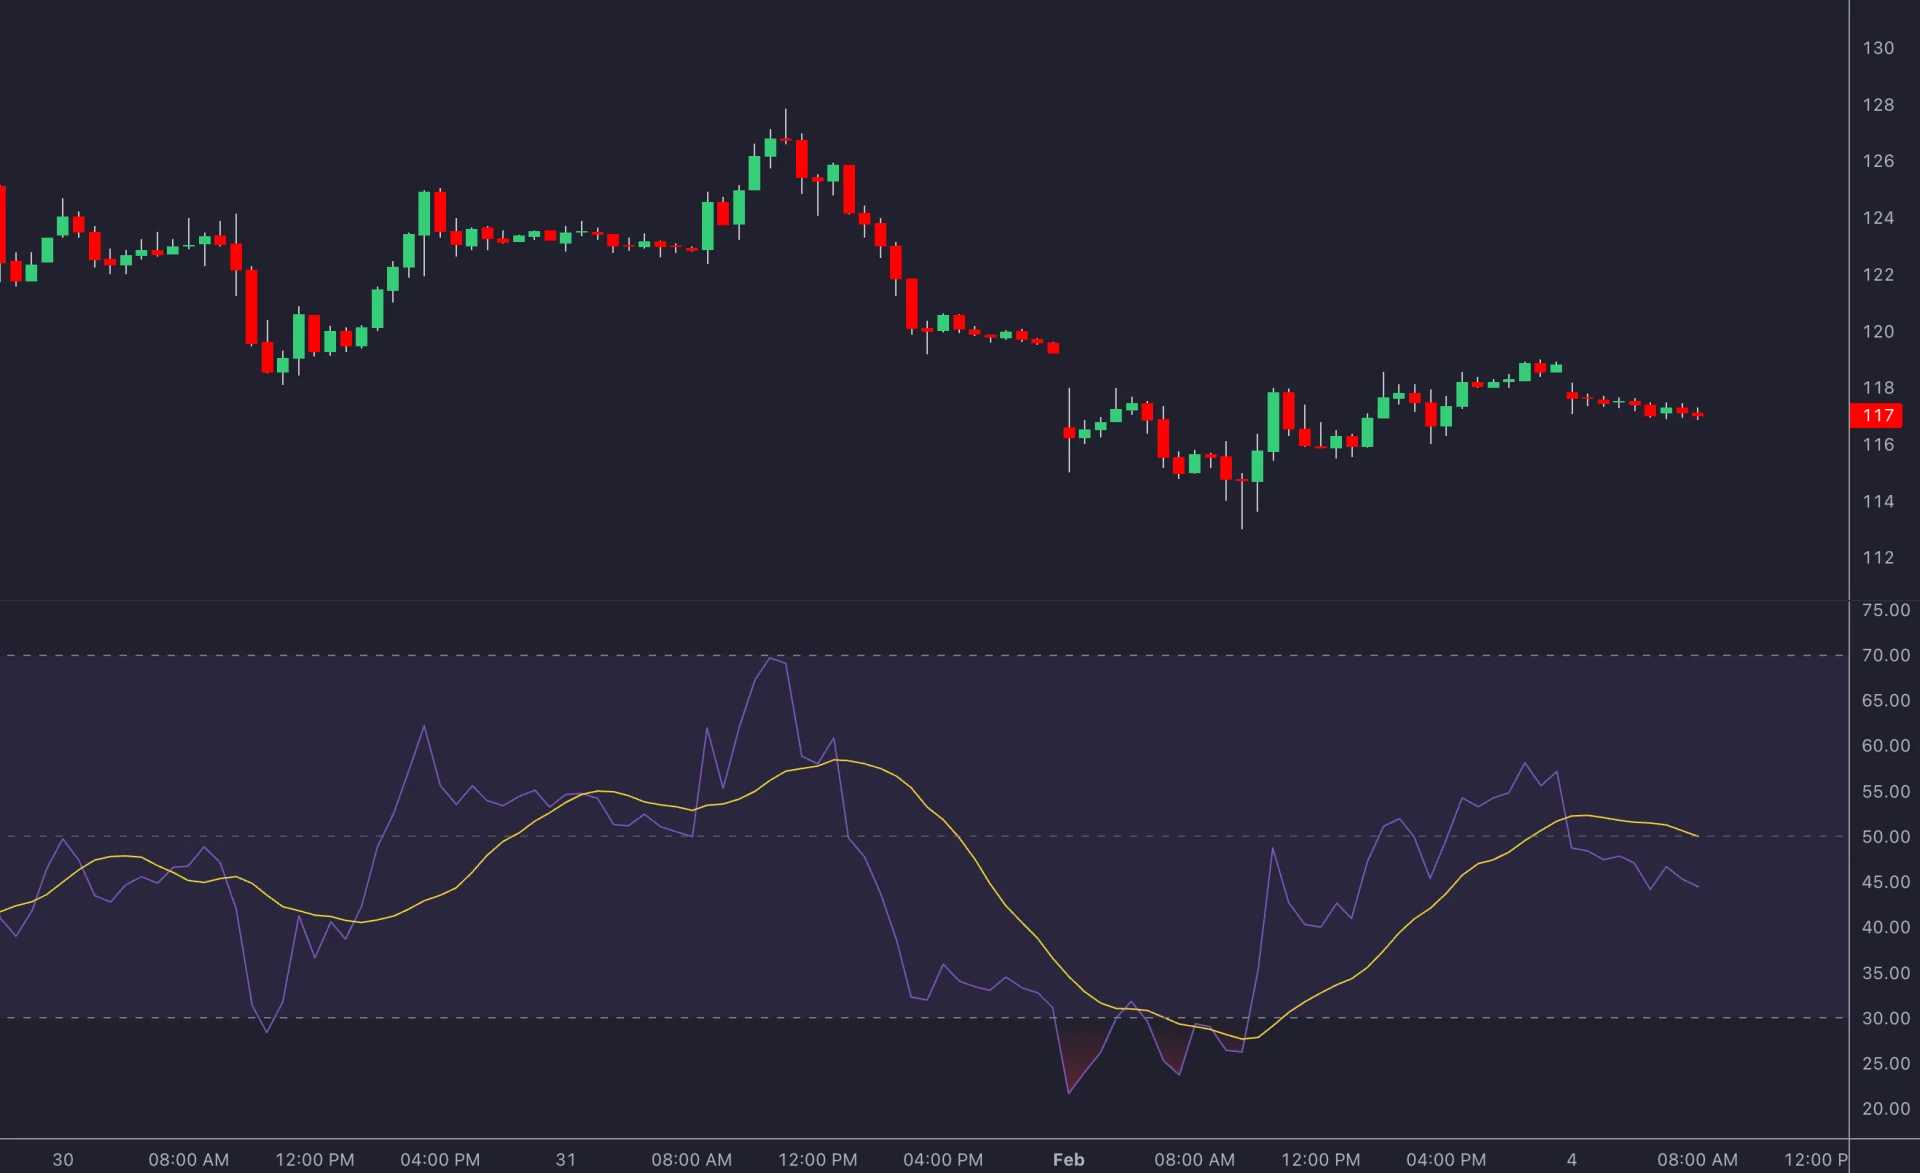
Divergence compares specified price and oscillator points. If those points need subsequent bars to become identifiable, record the actual detection time rather than assigning the signal to an earlier extreme. Higher-timeframe checks also need completed values when your rule requires a confirmed bar.
3. Moving Averages: SMA, EMA and WMA
SMA gives equal weight to the observations in its window. EMA assigns more weight to recent observations through recursive smoothing, while a conventional WMA uses linearly increasing weights toward the newest observation. They smooth the same underlying price series in different ways; none removes uncertainty.
Useful screen conditions include actual close above a chosen average, a rising average, or a faster average above a slower one. The widely discussed golden cross uses a 50-day average crossing above a 200-day average; a death cross reverses that relationship. “Above” is a continuing state, while “crossed above today” is an event that also requires the prior relationship.
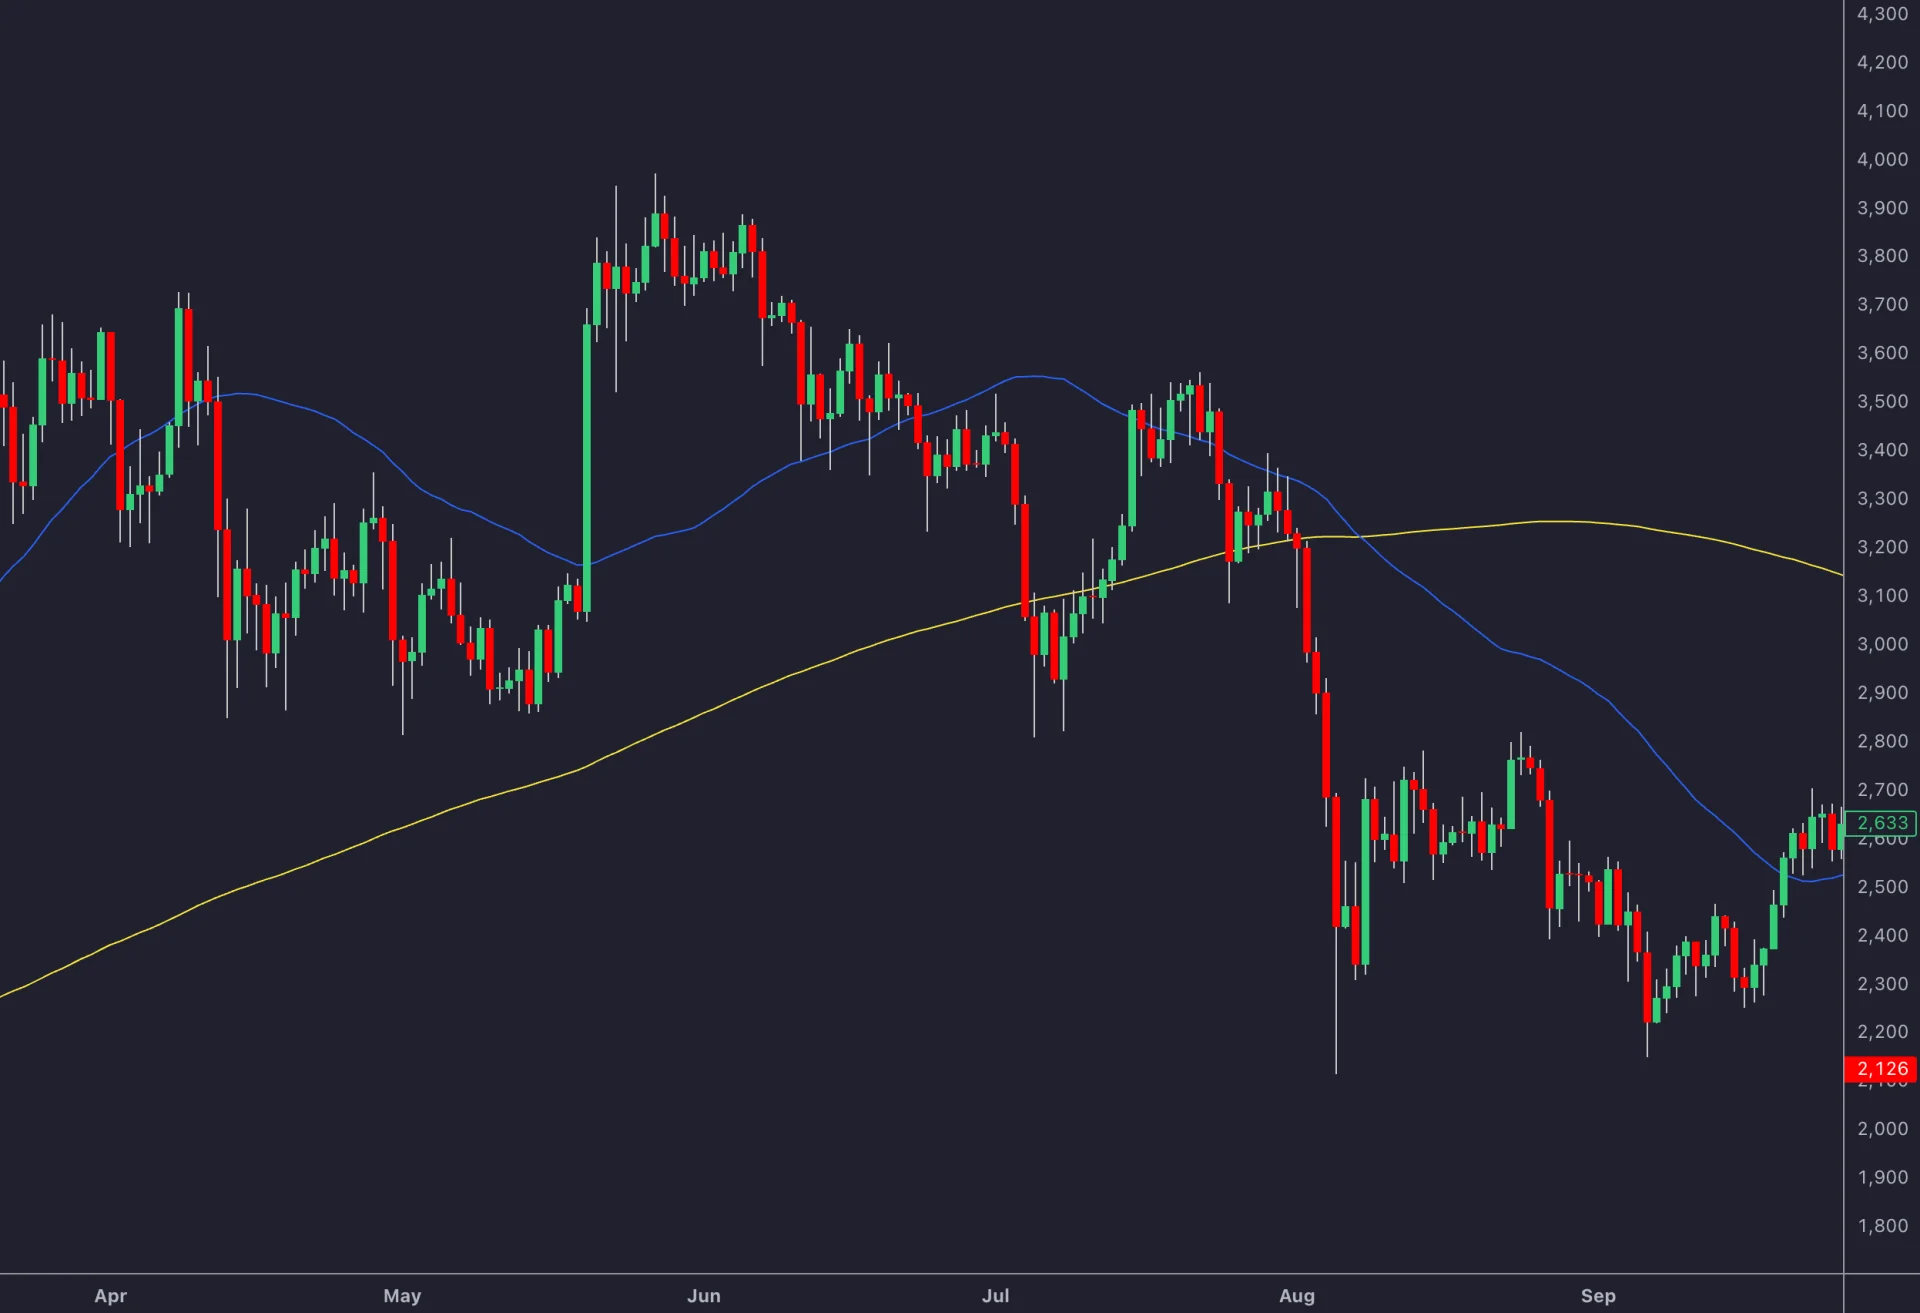
A 10- or 20-period average covers a shorter window than a 50- or 200-period average on the same chart. It is a day-based measure only on a daily series. Match the source, trading session and interval in the chart and screener, and do not combine daily and intraday settings without stating why.
4. Library Oscillators for Momentum Analysis
The Library’s momentum tools add normalized oscillators, signal lines, turning points and divergence detection on a Quant Chart. A longer length smooths an oscillator; a signal-line cross marks a turning point, which describes configured oscillator behavior, not an established probability of a profitable reversal. Adding RSI can repeat some of the same price information.
Divergence lines on the price chart are placed retrospectively; their historical endpoints are not proof that the signal was available at those earlier bars. Treat these tools as chart analysis rather than a market-wide scan. To cover more symbols, scan any market with Library tools on a Quant Chart and record which condition qualified each result.
5. MACD: Line, Signal and Histogram
With the familiar 12, 26 and 9 settings, MACD is the 12-period EMA minus the 26-period EMA. The signal line is a 9-period EMA of MACD. The histogram is MACD minus its signal line. A positive histogram therefore means MACD is above its signal line, even when both remain below zero.
Example: if MACD is −2 and its signal line is −3, the histogram is +1. That is not the same as the faster price EMA being above the slower price EMA: MACD itself would need to be positive for that relationship. Distinguish a histogram cross, a MACD/signal cross and a MACD zero-line cross in your screen.
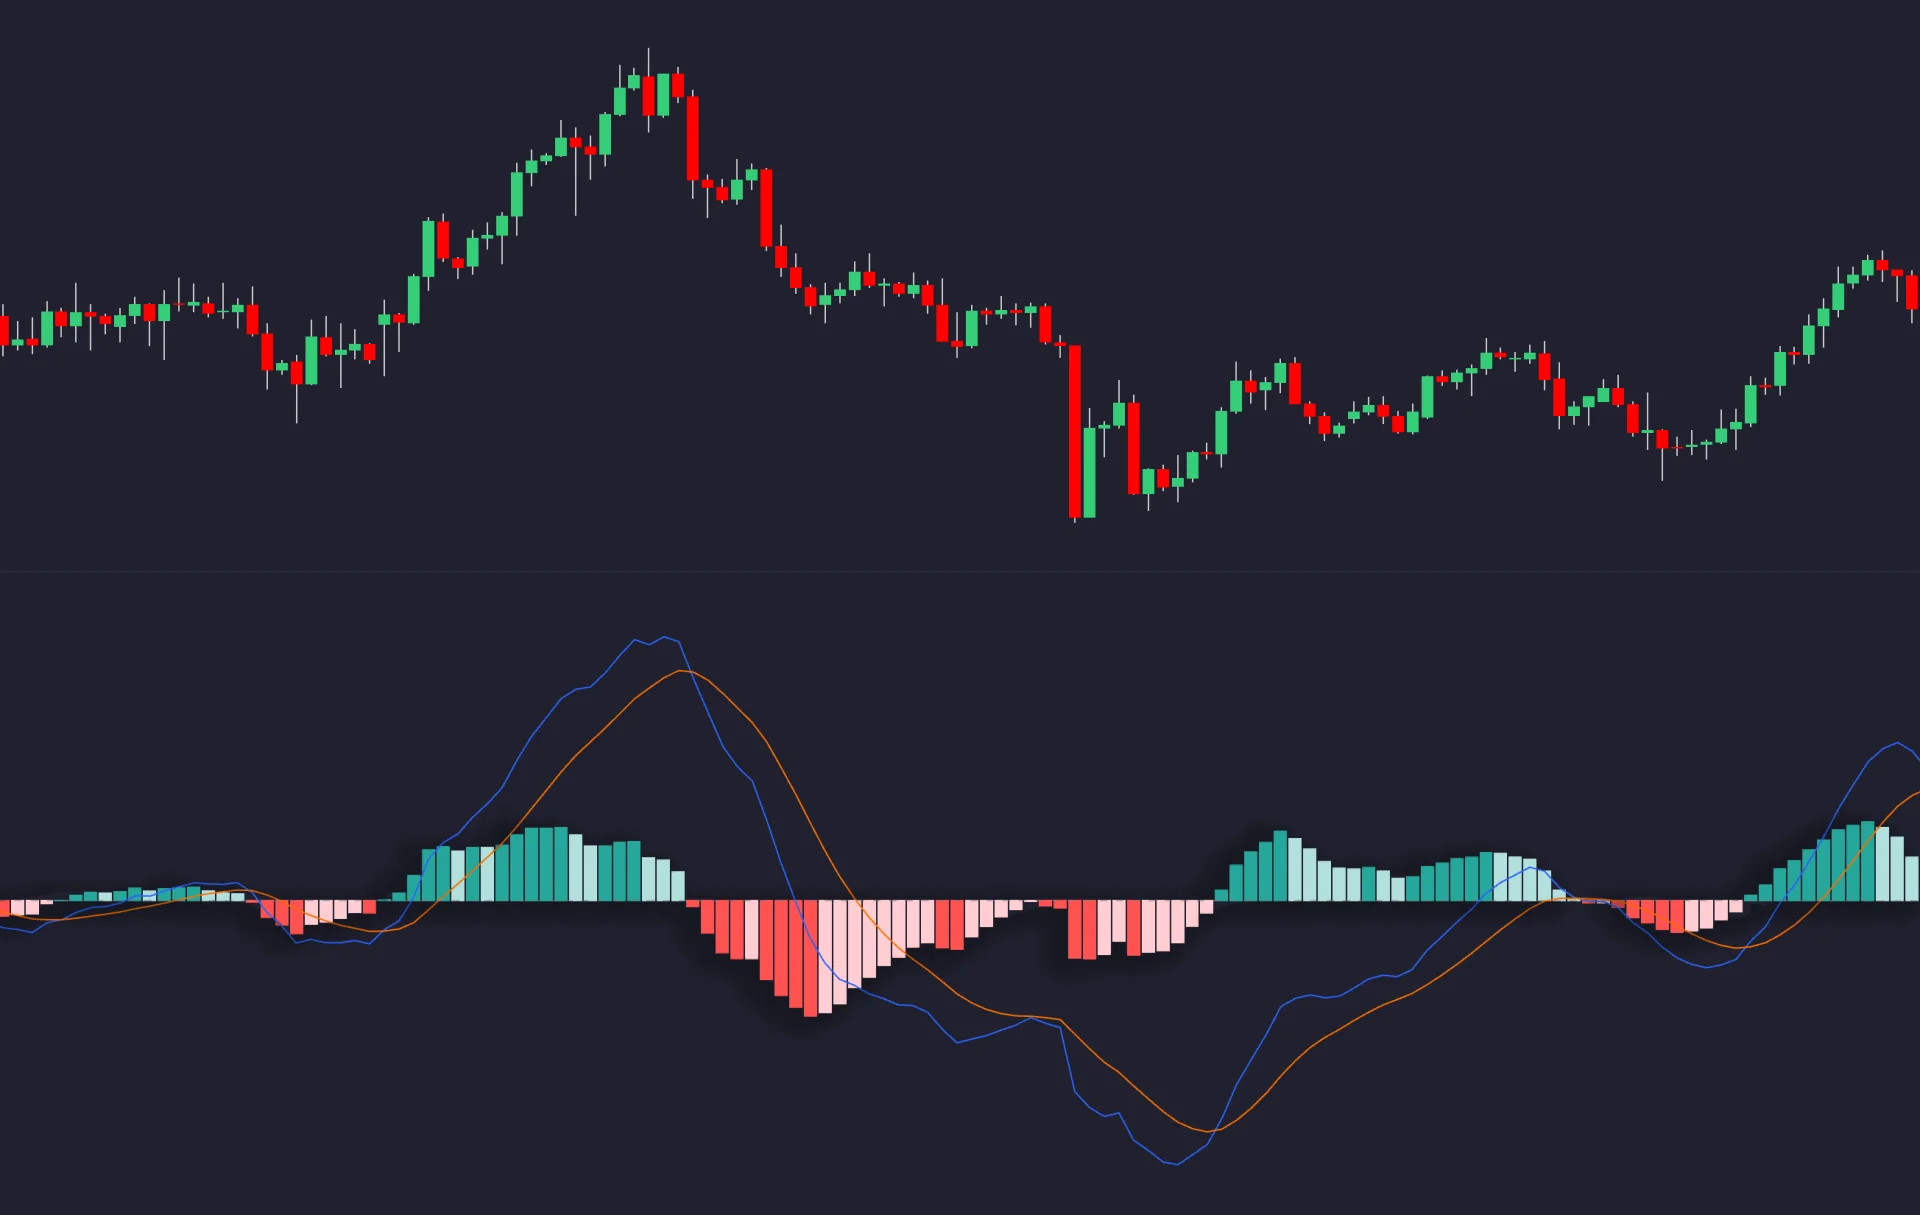
MACD values are in the source’s price units. Ranking unrelated assets by the largest raw MACD can favor higher-priced instruments. If ranking is the aim, define an appropriate normalized measure rather than assuming a larger number means a better opportunity. Expect repeated crosses during choppy periods.
Build a Momentum Screen in TradingView
Standard Asset Screeners
TradingView’s screener walkthrough distinguishes asset-specific screeners from Pine Screener. Open Products → Screeners and select the relevant asset category. Choose the market or universe where available, add supported technical and liquidity filters, and show the corresponding columns so you can inspect why each result qualifies.
Set each field’s interval deliberately. Save the screen, record when it ran, and review matching symbols on charts. Available fields differ between asset screeners; a chart indicator’s custom settings are not automatically transferable. Refreshing a results table is also different from backtesting the historical rule.
Pine Screener for Compatible Indicator Conditions
The current Pine Screener requirements describe scanning a watchlist or index with one compatible indicator per screen. Select a source, choose the indicator, configure its supported plots or alert conditions as filters, and run Scan. Rescan after changing the source, indicator, settings, timeframe or filters.
The indicator needs a supported plot or alert condition; strategies and indicator-on-indicator setups are not supported. Calculations use the last 500 bars, with supported intervals and restrictions on data requests and some inputs. Check the current requirements before relying on a custom script, especially when it uses other symbols or timeframes. A scan is a current calculation, not a full-history performance test.
If a combined MOM/RSI/trend rule needs custom code, it must be expressed through a compatible indicator rather than assuming three unrelated studies can simply be stacked in one Pine screen. Verify its calculated values against the same settings on ordinary candles.
Video: Pine Screener Walkthrough
This official TradingView tutorial demonstrates the Pine Screener workflow. It introduces the earlier beta interface, so use the current requirements linked above for supported sources and limits. The video explains tool operation, not the expected profitability of a momentum filter.
Example: Turn a Screen into a Testable Trading Rule
Consider a hypothetical daily continuation screen using completed bars: 20-period ROC above 5%, RSI(14) between 55 and 70, and close above the 50-period SMA. These are research inputs, not recommended universal thresholds. Add a separately defined liquidity requirement suitable for your instrument and intended trade size.
| Candidate | ROC(20) | RSI(14) | Close / SMA(50) | Meets the three price conditions? |
|---|---|---|---|---|
| A | 8% | 62 | 108 / 103 | Yes |
| B | 12% | 76 | 112 / 104 | No: RSI exceeds the chosen upper bound |
| C | 4% | 60 | 104 / 101 | No: ROC does not exceed 5% |
Candidate A qualifies for review, but the screen does not specify when to enter or how to leave. Decide whether to act only when a symbol first qualifies or on every qualifying day. Define re-entry, the maximum number of simultaneous positions and how to rank candidates when capital is limited.
For an illustrative long trade, suppose the next executable entry is 108 and the actual-price stop is 105. A $100 risk budget with $10 reserved for estimated costs gives (100 − 10) ÷ 3 = 30 shares. An exit at 105 loses $90 before costs; a gap exit at 103 loses $150 before costs. The planned stop does not guarantee the loss remains within the budget.
Evaluate the Screen without Inflating Results
| Check | Why it matters | Practical approach |
|---|---|---|
| Universe at the time | Today’s surviving symbols can distort a historical test | Use the eligible historical universe where available and disclose missing delisted assets. |
| Data and timing | Delayed feeds, sessions and unfinished bars can change values | Record the feed, interval, session and decision timestamp; inspect completed-bar values. |
| Execution and costs | A qualifying close is not always an achievable entry | Model the next eligible fill, spread, fees, slippage and instrument-specific costs. |
| Indicator overlap | Several price-derived filters can be redundant | Compare a simple baseline with each added condition individually. |
| Later-period evaluation | Repeated tuning can fit historical noise | Keep a later sample untouched, track all attempts and examine drawdown and trade count. |
Win rate alone is insufficient. Compare net results, average gain and loss, drawdown, turnover and how many trades support the estimate. A screen that selects very few symbols can look impressive by chance. Changing settings after every disappointing period makes it harder to distinguish a repeatable rule from hindsight.
Use alerts only after defining the exact condition and timing. Check whether the alert evaluates an unfinished bar or a completed one, and whether a changed setting requires recreating it. Review real fills separately from both screen results and simulated trades.
Frequently Asked Questions
What is the most accurate momentum screening indicator?
There is no universal winner. MOM, RSI, moving averages, MACD and composite oscillators describe different calculations. Evaluate a complete rule on a defined market and timeframe with costs, rather than assigning unsupported accuracy scores.
What is the difference between a chart indicator and a screener?
A chart indicator calculates values for the chart being viewed. A screener evaluates defined conditions across a selected universe. Adding an indicator to a chart does not automatically make it a market-wide scanner.
Can I use custom indicators in TradingView Pine Screener?
Compatible indicators can be used, subject to the current Pine Screener requirements. One indicator is selected per screen, and it must expose supported plots or alert conditions. Check actual compatibility and data limits; a strategy or a chart-only display is not automatically eligible.
Should I buy whenever RSI is below 30?
No. RSI can remain low during a persistent decline. Define whether you are studying continuation or mean reversion, specify any crossing condition, and add explicit execution and exit rules before evaluating results.
Do ADX and CCI replace momentum screening?
They answer different questions. ADX measures trend strength without identifying direction by itself, while CCI measures deviation from an average relative to mean deviation. Neither provides a complete screening or trading rule without a universe, timeframe and explicit conditions.
How can LuxAlgo help with momentum research?
Native LuxAlgo charts include standard studies and the LuxAlgo Library. Quant, our coding agent, can help express custom indicator or strategy rules. Inspect generated code, run the strategy manually and verify individual trades. Keep screening, chart analysis, alerts and execution assumptions distinct.
Read next