Trend Continuation: Ride Market Waves
Trend-continuation trading looks for an established move to resume after a pause. The useful question is not whether a chart resembles a flag or triangle, but whether a clearly defined entry, exit and risk plan performs acceptably when the pattern succeeds and when it fails. A consolidation can also resolve against the prior trend.
Start on native LuxAlgo charts by marking the preceding move, the consolidation boundaries and the point that would invalidate the setup. Use Quant, our coding agent, to help implement supported rules, inspect the generated code and run the strategy manually. Keep a visual pattern candidate, a breakout event and a profitable trade as three separate ideas.
Recognize the pause within the larger trend
A continuation setup needs context. Define what counts as the preceding trend, how long a pause may last and which observations establish its boundaries. Without those rules, the same sideways movement can be labeled a continuation after a favorable breakout and a reversal after an unfavorable one.
| Pattern | Visual structure | What remains uncertain |
|---|---|---|
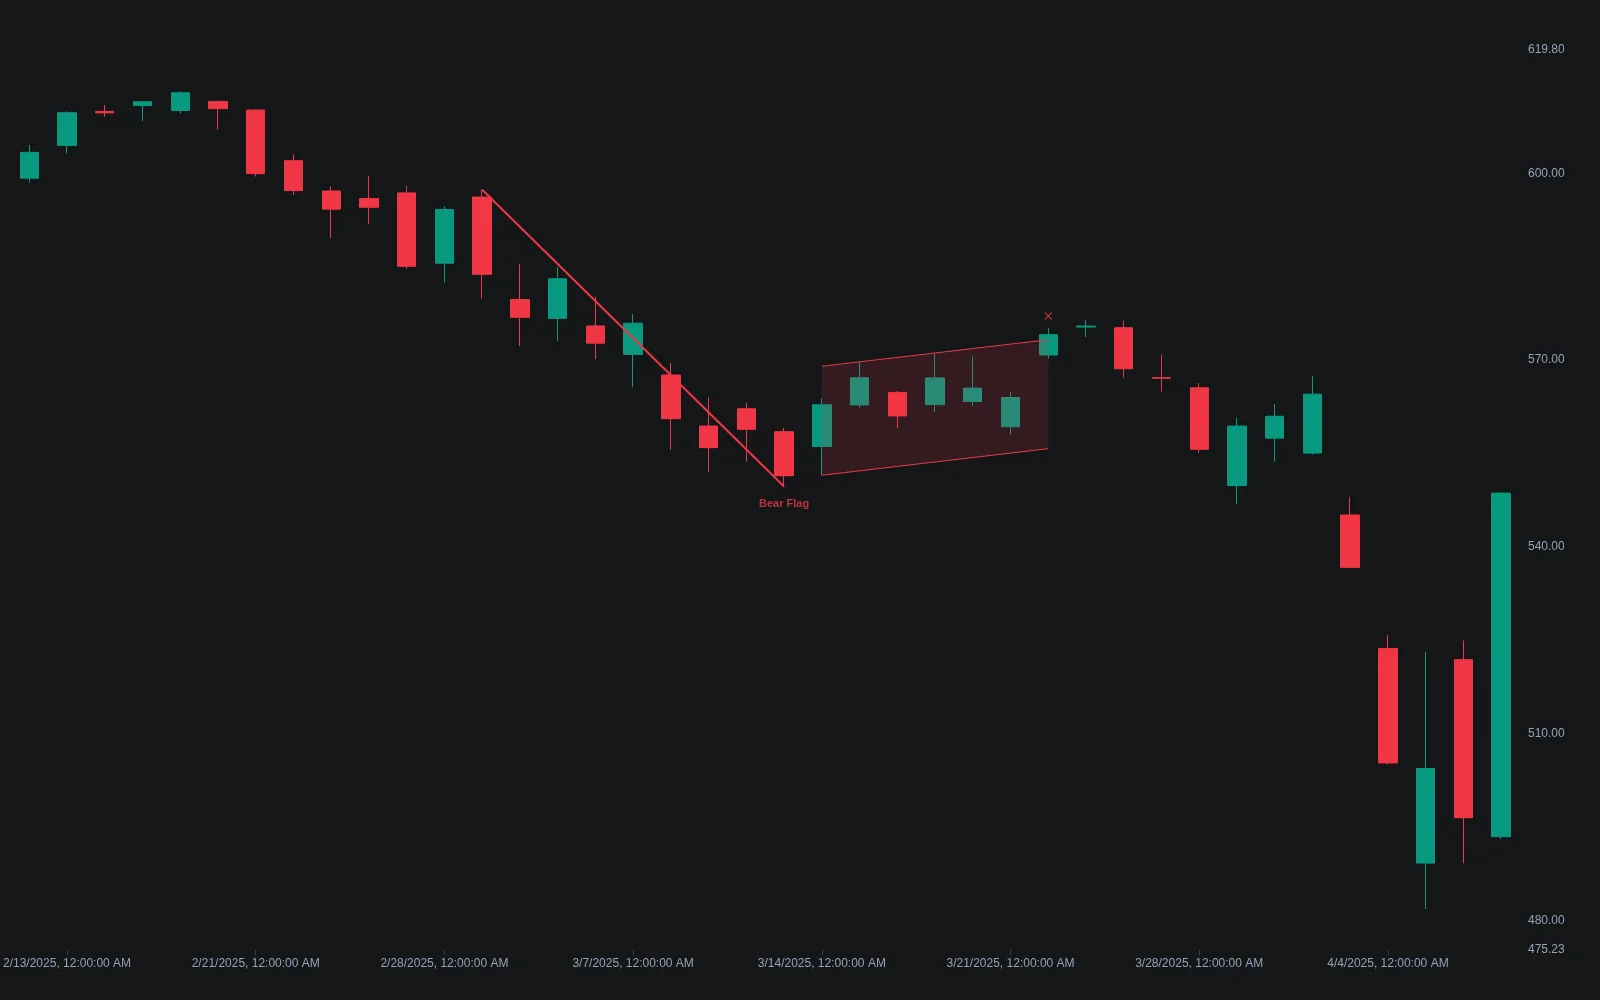
| Flag | A short consolidation bounded by roughly parallel lines after a sharp move. | The prior move may not resume, and the eventual fill may be far from the boundary. |
| Pennant | A compact, converging consolidation after an impulse. | Compression does not guarantee the direction or size of the next move. |
| Triangle | Converging boundaries, with symmetrical, ascending or descending variants. | The shape alone does not establish a completed breakout. |
| Rectangle | A range between approximately horizontal boundaries. | Either boundary can break; continued sideways movement is also possible. |
For bullish continuation, the trade thesis generally requires renewed upward movement; for bearish continuation, it requires renewed downward movement. Do not apply an “above the pattern” entry rule to both directions. Decide whether the trigger is an intrabar breach, a completed close, a buffered level or a retest, then test that exact definition.
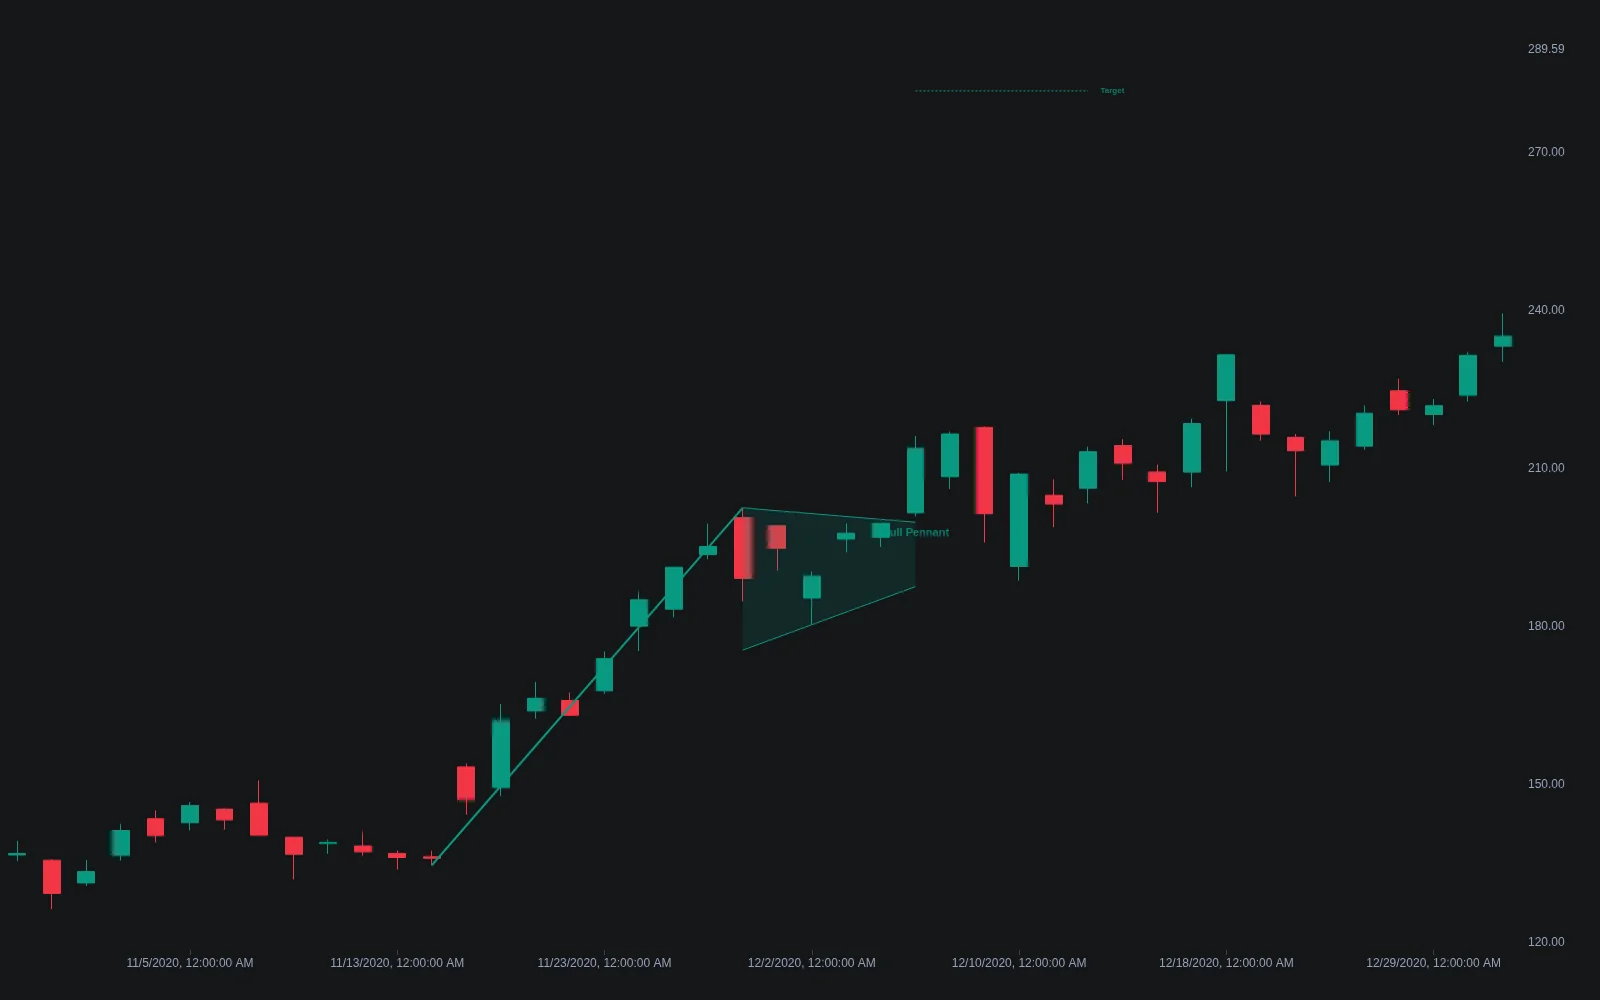
Measured-move targets are projections. They can help specify an exit hypothesis, but price has no obligation to travel the projected distance. Test the target alongside the stop and entry assumptions rather than presenting the drawing as a forecast.
Use trend and volume filters as testable conditions
Moving averages and momentum
A rising average with price above it is one way to describe upward context; a falling average with price below it can describe downward context. The selected length determines the horizon being summarized. A 10-period average is not universally the “major trend,” and an average is a lagging calculation rather than independent evidence of future direction.
Specify the averaging method and timeframe. Ten daily bars, ten hourly bars and a daily value displayed on an hourly chart are different inputs. Multiple averages or momentum indicators can repeat related price information, so agreement does not automatically improve the strategy.
- RSI: describes recent relative gains and losses under its calculation. An extreme reading can persist during a trend and is not, by itself, an entry or exit.
- MACD: can define a momentum condition such as crossing its signal line, but the condition must be evaluated at a specified time.
- Higher-timeframe context: use only the latest completed value available at the decision time. Do not use the eventual daily close to justify an earlier intraday trade.
- Swing-based levels: a pivot requiring right-side bars becomes known only after those bars arrive. A label drawn back on the turning point is not evidence that a trader could act there immediately.
Volume adds context, not certainty
Record the volume comparison instead of calling it “strong” by inspection. For example, a rule could compare the completed breakout bar with a stated prior average. That threshold is a parameter to evaluate, not a guarantee against a failed breakout.
Keep the data basis consistent. A partial session should not be compared casually with complete sessions, and exchange-specific volume does not describe all venues. Some markets provide tick activity rather than consolidated traded volume. Check the chart data source before interpreting a surge.
A candidate can fail on high volume, and a low-volume breach can later develop into a larger move. Your volume rule should be judged across the complete sample, including signals it rejects, rather than only the examples selected for illustration.
Define an entry and its failure condition together
Choose the pattern boundary before the outcome is known. Specify the minimum number of observations, allowed slope or range, maximum duration and when the setup expires. Those details make the difference between a repeatable strategy and a retrospective chart annotation.
| Decision | Bullish example | Bearish example |
|---|---|---|
| Entry trigger | A completed close above the selected upper boundary. | A completed close below the selected lower boundary. |
| Execution assumption | A stated next-bar fill or other explicitly modeled order. | A stated next-bar fill or other explicitly modeled order. |
| Price failure | A chosen level below the setup, with a defined exit mechanism. | A chosen level above the setup, with a defined exit mechanism. |
| Time failure | Exit or cancel if progress does not occur within the chosen interval. | Exit or cancel if progress does not occur within the chosen interval. |
| Retest policy | Wait for a defined return and response, or accept that the trade may be missed. | Wait for a defined return and response, or accept that the trade may be missed. |
The examples are rule templates, not instructions to enter every close beyond the boundary. A close-based signal is not known until the bar closes. If the next bar opens with a gap, assuming the earlier closing price as your fill can overstate performance.
A retest is optional and may never happen. Waiting for one changes the strategy’s sample and opportunity set; it does not remove risk. Likewise, a tiny breach is not automatically false. Define what counts as failure, such as a subsequent close back inside the range, before evaluating the result.
Size the trade for the stop distance and execution risk
First choose the invalidation level, then calculate whether the position fits the risk and capital constraints. In a hypothetical long share trade, an entry at $42 and planned stop at $40 create $2 of price risk per share. A $180 total budget reserving $20 for estimated costs leaves $160 for price risk, allowing 80 shares with a position value of $3,360.
An exit at $46 would produce $320 gross profit, twice the planned $160 price risk. A gap followed by a fill at $38 would instead lose $320 before costs. This illustrates why a planned risk amount is not a guaranteed loss cap. Adjust for contract multipliers and trade increments when the instrument is not an ordinary share.
For a separate hypothetical short trade at $42 with a planned stop at $44, the same $2 distance gives the same 80-unit price-risk calculation before product-specific costs. The direction of the stop is reversed, and borrowing, leverage and short-sale obligations require their own assessment. Do not treat the cash-long example as a complete short-selling risk model.
Understand what the exit order actually does
The SEC’s stop-order bulletin distinguishes a trigger from an execution price. A stop order becomes a market order after triggering, so the fill can differ substantially from the stop. A stop-limit order controls the acceptable execution price but can remain unfilled. Broker trigger standards and available order types also differ.
A chart-based exit signal is separate from an order submitted at a broker. State whether the strategy acts on a wick, close or another condition, and model when the order could actually be placed. If stop and target both appear inside one historical candle, coarse bar data may not reveal which was reached first.
Targets, trailing rules and breakeven changes
A fixed target, a time exit and a trailing exit are different trade-management choices. Define their priority when more than one condition applies. A target price does not secure a profit until an executable exit occurs.
For a long trailing rule, specify when it activates and ensure the level does not move downward merely because a recalculated volatility distance increases. For a short rule, use the corresponding upward-loss restriction. A changing indicator line is not automatically equivalent to a broker’s trailing-stop order.
Moving a stop to the entry price after a 1R move is a strategy choice, not a universal improvement. It may reduce some losses while exiting trades that later resume. Fees and gaps also mean “entry price” is not necessarily economic breakeven. Compare the full results of the rule rather than assuming it is free protection.
Adapt to volatility without changing the plan mid-trade
Use an instrument-relevant measure to estimate normal movement and execution demands. If a planned stop distance increases from $2 to $4 while the price-risk budget stays $160, the hypothetical quantity falls from 80 to 40 shares. That is a sizing adjustment made before entry; widening a stop after entry can increase the already committed loss exposure.
Broad market-volatility indicators and a specific instrument’s bar range answer different questions. Neither tells you the future breakout direction. Check spreads, event risk and whether the strategy’s historical assumptions still fit the current conditions.
- Set a limit on combined exposure to related positions, not only a separate allowance for each trade.
- Define any daily or weekly loss rule in advance, including what happens to existing positions. A rule cannot guarantee protection from a sudden gap.
- Avoid repeatedly increasing size or loosening stops to recover a previous loss.
- Allow a no-trade outcome when the setup, data or execution conditions do not meet the plan.
Build a native LuxAlgo continuation workflow
Use native charts to inspect the chosen market and define the pattern rules. The LuxAlgo Library provides indicator references and implementations, but an indicator’s presence does not prove that it recognizes every flag, pennant or triangle. Verify the exact logic of the tool being used.
- Write the trend, consolidation, breakout, sizing and exit conditions in plain language. Include the timeframe, session and required historical inputs.
- Ask Quant, our coding agent, to implement the supported rule set. State that pivot confirmation and higher-timeframe values must be available at the time of each signal.
- Inspect the code before relying on the plot. Check the pattern boundaries, signal timing, stop direction and any trailing or breakeven update.
- Run the strategy manually. Review inputs and properties, including capital, quantity, costs and execution assumptions.
- Inspect the trade list around failed breakouts, gaps and periods of sideways trading. A summary metric alone can hide incorrect behavior.
- Evaluate a later period that was not used to choose the rules, with a relevant baseline and the same data and cost assumptions.
A screener selects candidates according to its rules. It does not establish that each result has a high probability of success. Similarly, a multi-chart layout is a workspace feature rather than evidence that more charts improve a strategy. Use the tools that serve the defined decision process.
Avoid common continuation-trading mistakes
Naming the pattern after seeing the result
Save the boundaries and settings at the decision time. A losing flag candidate should stay in the record as a failed candidate, rather than being relabeled and removed from the sample. Otherwise, the apparent success rate becomes a product of hindsight.
Waiting for certainty before honoring the stop
A pause and a reversal can look similar while they develop. Decide in advance what price or time condition ends the trade thesis. Waiting until a reversal looks obvious can move the exit far beyond the original risk assumption.
Overtrading similar signals
Several entries on related instruments can express the same market exposure. Track both trade frequency and portfolio concentration. A maximum number of trades can support discipline, but it does not replace checking whether each rule has evidence behind it.
Optimizing every disappointing result
Keep a record of alternative lookbacks, buffers, volume filters and exit rules tried. Repeatedly choosing the best historical combination raises the risk of fitting noise. Report losing periods and parameter sensitivity, then reserve genuinely unseen observations for evaluation.
Video: symmetrical triangles and flags
This recorded lesson illustrates continuation-pattern concepts. Use it alongside the explicit entry, failure and execution rules above. The shapes are educational examples, not a guarantee that a pattern will resolve in the expected direction.
Frequently asked questions
Does a continuation pattern guarantee that the trend will resume?
No. A consolidation can break with the prior trend, against it or remain unresolved. Define the entry and failure conditions before evaluating the result.
What is the difference between a flag and a pennant?
A flag has roughly parallel consolidation boundaries, while a pennant converges. Both are commonly studied after a preceding impulse, but neither shape establishes a profitable trade.
Does high breakout volume eliminate false signals?
No. Volume is a measurable filter to test, not certainty. Compare consistent sessions and data sources, and include failed signals in the evaluation.
Should every stop move to breakeven after a 1R gain?
No. That is a management rule to compare with alternatives. It changes the payoff distribution, and fees or gaps can still produce a loss.
Can a stop order guarantee the planned loss amount?
No. A triggered stop becomes a market order and can fill away from the stop price. A stop-limit order can remain unfilled. Check the broker’s rules and model execution risk.
How can I test continuation rules with Quant?
Specify the pattern, timing, sizing and exits, inspect the generated code for information that was unavailable at the decision time, then run it manually and review costs, individual trades and unseen periods.
References
- StockCharts ChartSchool — Flags and Pennants; pattern geometry.
- SEC — Stop, Stop-Limit, and Trailing Stop Orders; trigger, execution and non-fill distinctions.
- LuxAlgo — Native Charts and Chart Data; chart workspace, source scope and sessions.
- LuxAlgo — Making Strategies and Native Strategy Settings; code review, manual runs and testing assumptions.
- LuxAlgo Library; indicator-specific definitions and implementations.
- Continuation Patterns: The Symmetrical Triangle and Flag — video; recorded educational lesson.
The position-sizing and payoff examples are hypothetical calculations. The references document concepts and tools; they do not validate a profitable continuation strategy.
Read next