Trend Strength Index Indicator: Measuring Trend Intensity
The indicator traders usually mean by "trend strength index" is William Blau's True Strength Index (TSI): a momentum oscillator that double-smooths each bar's price change and its absolute value with two exponential moving averages, then plots their ratio scaled to run between +100 and −100. The numerator keeps the sign of every price change while the denominator strips it, so the TSI reads as net directional momentum as a share of total movement. Zero marks the point where up and down momentum balance, sustained readings on one side describe the regime, and crosses of the line with its signal EMA or with zero are the usual triggers. Because the smoothing is deep, the line turns after price does.
Key Takeaways
- Zero-line crossovers: a move from negative to positive means smoothed up momentum now outweighs down momentum over the lookbacks; the reverse defines the bearish side. They are slow and relatively rare.
- Signal line crossovers: the TSI crossing an EMA of itself fires earlier and more often. Many traders take only the crosses that agree with the zero-line side.
- Divergences: the smooth trace gives well-defined swing highs and lows, which makes comparisons against price easier to mark than on noisier oscillators. They remain probabilistic.
- Parameters: Blau's defaults are a 25-period first EMA and a 13-period second EMA, with a signal EMA of 7 to 13. Shorter smoothing turns faster and whipsaws more; longer smoothing does the reverse.
The LuxAlgo True Strength Index in the Library reproduces the published calculation and opens on Quant Charts in one click, with alerts for both kinds of cross. Quant, our coding agent, can turn a written TSI rule into a strategy you can inspect in Code and test with Run.
Trend Strength Index (TSI): Tutorial
TradingView published this tutorial in July 2025. It walks through the built-in True Strength Index, its signal line and the crossover reads described below.
How the Trend Strength Index Works
Most oscillators measure momentum in one of two ways: where the close sits inside a recent range, as the stochastic does, or how large recent gains are relative to losses, as RSI does. The TSI asks a different question: of all the movement over the lookback, how much was directional? A market that rose $10 in ten straight up days and one that rose $10 while swinging $3 each way every day have the same net change; the second has far more total movement, and the TSI reads lower for it.
Reading TSI Values
- Sign: sustained positive values mean smoothed up momentum dominates over the lookbacks; sustained negative values mean the reverse. Near zero, up and down momentum are nearly balanced and small oscillations flip the sign without saying much.
- Magnitude: values far from zero mean a large share of recent movement was in one direction. Readings near the theoretical limits essentially never print, so the practical range is market-specific.
- Guides: charting packages commonly draw overbought and oversold lines near +25 and −25. These are conventions rather than properties of the math; a strongly trending market can hold beyond a guide for weeks, and a quiet one may never reach it. Percentiles of the instrument's own TSI history make more defensible levels, and even those mark stretch, not reversal. See overbought and oversold for the general caution.
The zero-line crossover is the slowest and cleanest read. It tracks the sign of smoothed momentum, so it changes only when the balance of directional movement has shifted over the whole lookback, which is why many systems use it as a directional filter rather than a trigger: longs only while the TSI is positive, shorts only while it is negative.
Calculating the Trend Strength Index
The construction is short enough to follow by hand, and following it explains both the bounded scale and the lag.
Step-by-Step Calculation Process
- One-bar momentum: subtract the previous bar's close from each close. This series is signed.
- Double smoothing of momentum: apply a 25-period EMA to the momentum series, then a 13-period EMA to the result. Order matters: the long EMA is applied first. This is the numerator.
- Double smoothing of absolute momentum: take the absolute value of each one-bar change and apply the same 25-then-13 smoothing. This is the denominator.
- Ratio: divide the numerator by the denominator and multiply by 100.
- Signal line: apply a short EMA, commonly 7 to 13 periods, to the TSI itself.
Because the denominator can never be smaller in magnitude than the numerator, the ratio stays within −1 and +1 and the scaled TSI within −100 and +100. The table shows hypothetical double-smoothed values and the reading each produces.
| Smoothed momentum (numerator) | Smoothed absolute momentum (denominator) | TSI = 100 × ratio | Reading |
|---|---|---|---|
| +0.90 | 1.00 | +90.0 | Almost all recent movement was upward; rare in practice |
| +0.60 | 1.20 | +50.0 | Strong directional up momentum |
| +0.30 | 1.50 | +20.0 | Rising, but most movement was two-way |
| +0.02 | 1.10 | +1.8 | Balanced; the sign carries little information |
| −0.45 | 0.90 | −50.0 | Strong directional down momentum |
Two consequences follow. Any single large bar enters both numerator and denominator, so it moves the TSI less than it would move a price-unit oscillator such as MACD, whose amplitude drifts with price and volatility. And the 25-then-13 smoothing spans a lot of history: on a daily chart the line reflects roughly two months of changes, which is where its smoothness and its lag both come from.
How Parameters Affect the TSI
Three lengths shape the line. The long length sets the filter and does the heavy smoothing; the short length shapes response within that filter; the signal length trades cross quality for speed. Raising any of them steadies the line and deepens the lag; lowering them does the opposite. The table describes what changes, not which setting is best, because no setting tests best across all markets and timeframes.
| Setting (long, short, signal) | Signal frequency | Lag | What it suits |
|---|---|---|---|
| 13, 7, 7 | High; more signal crosses and more zero flips in ranges | Short | Faster swing timing where whipsaws are acceptable and tested |
| 25, 13, 13 (published defaults) | Moderate | Moderate | The standard reference; start here and change one input at a time |
| 40, 20, 13 | Low; zero crosses become regime changes | Long | Position bias and directional filtering rather than entries |
A change in one input has not been tested by a result at another. Record the three lengths, the price source and the interval with any rule, and revalidate after any change; the same numbers rarely transfer across markets without testing.
Using TSI Signals for Trading Decisions
The TSI supplies a regime read and a timing trigger. The rest of a trade, the entry price, stop, target and size, still has to be defined separately and tested together with the signal.
Using Signal Line and Zero Crossovers
- Zero-line crossovers are the slow read. A cross above zero says smoothed up momentum now exceeds down momentum; a cross below says the reverse. In a rangebound market the line can hover near zero and cross repeatedly, and those crosses mean little.
- Signal-line crossovers are the fast read, essentially MACD-style timing applied to a normalized line. They fire earlier and fail more often. The common filter is to take only the crosses that agree with the zero-line side: buy a cross above the signal line while the TSI is positive, sell a cross below it while the TSI is negative.
Where a cross happens matters. A signal cross far from zero after an extended run is often a pullback resuming; a cross near zero is a coin toss between a trend change and noise. Test the two separately before trusting either.
Spotting Divergences with Price Action
A regular divergence forms when price makes a lower low but the TSI makes a higher low (bullish), or price makes a higher high while the TSI makes a lower high (bearish). A hidden divergence is the mirror case inside a pullback and points to continuation rather than reversal. The TSI's deep smoothing produces clean swing points, so these comparisons are easier to mark objectively than on choppier oscillators.
Divergences are still probabilistic. Trends routinely extend through one, a divergence can persist for a long time before anything happens, and price sometimes reverses with no divergence at all. Most users require a signal-line cross or a structural break, such as a close through the most recent swing high or low, before treating one as actionable.
A Worked Rule with Position Sizing
Consider a hypothetical stock on a daily chart with a $25,000 account and a 1% risk budget of $250. The rule: buy a TSI cross above its signal line only while the TSI is positive, stop below the most recent swing low, target twice the risk, exit early on a cross below the signal line. See Risking It Right for the budgeting logic.
| Step | Calculation | Result before costs |
|---|---|---|
| Signal cross while TSI is +18 | Buy next open at $84.20 | Entry $84.20 |
| Stop below the latest swing low at $81.70 | $84.20 − $81.70 | $2.50 risk per share |
| Position size | $250 ÷ $2.50 | 100 shares; $8,420 notional |
| Target at 2R | $84.20 + 2 × $2.50 | $89.20 |
| Early exit on a signal cross down at $86.30 | 100 × ($86.30 − $84.20) | $210 gain, about 0.84R |
| Gap through the stop, fill at $81.10 | 100 × ($84.20 − $81.10) | $310 loss, about 1.24R; a stop level is not a guaranteed fill |
Over a sample of such trades, expectancy is what matters: win rate × average win minus loss rate × average loss, after commission and slippage. A 40% win rate with 1.8R average wins and 1.0R average losses gives about +0.12R per trade; the same rule with 0.9R average wins is a loser. Neither number can be assumed; both come from the test.
Using the True Strength Index on Quant Charts
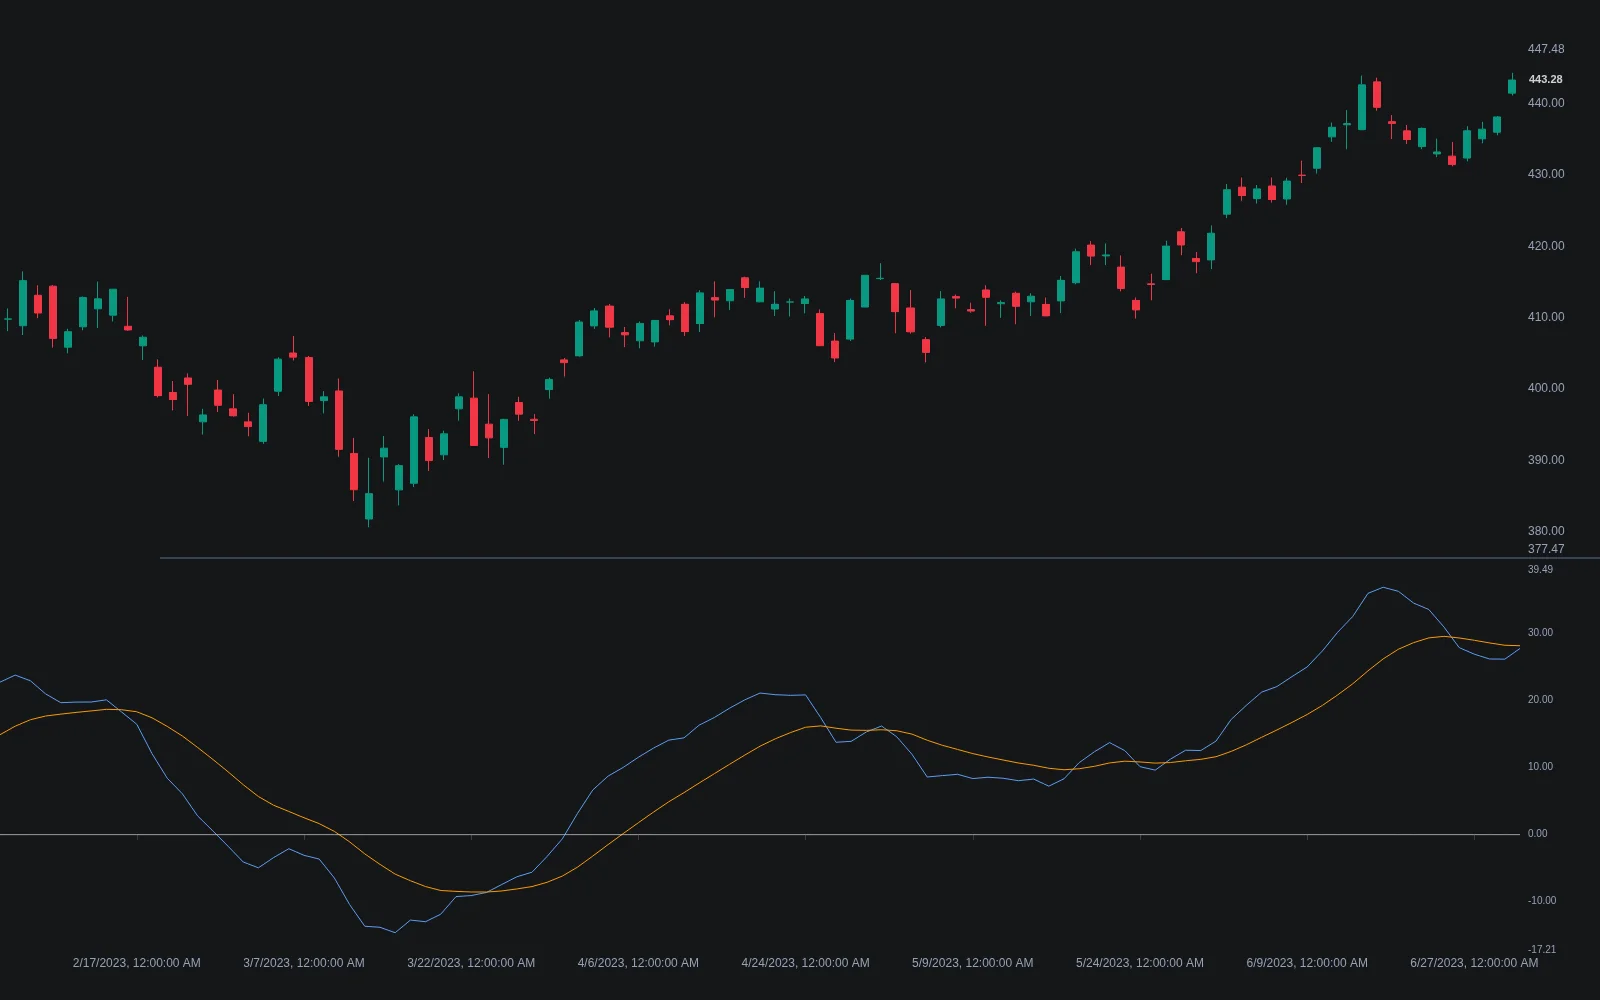
The Library's True Strength Index is the standard build with three inputs, Long Length 25, Short Length 13 and Signal Length 13, a dashed zero line and four alert conditions: Signal Line Cross Up, Signal Line Cross Down, Zero Line Cross Up and Zero Line Cross Down. The source is published on the page, so the calculation can be checked against Blau's definition, and the indicator loads onto a chart with Open on Quant Charts.
Native Tools Alongside the TSI
| Tool | What it adds | Where it runs |
|---|---|---|
| True Strength Index | Blau's oscillator with signal line, zero line and four crossover alerts | Quant Charts, from the Library page |
| Adaptive Momentum Oscillator | A different momentum measure with a signal line and an optional divergence detector, useful for cross-checking TSI divergences | Quant Charts, from the Library page |
The Adaptive Momentum Oscillator is a reasonable native companion because it measures momentum differently and flags divergences on its own; agreement between the two frames a stronger claim than either alone, and disagreement is information too.
Testing a TSI Rule with Quant
Write the rule completely: the three lengths, the trigger (signal cross, zero cross or both), the directional filter, the stop placement, the target or exit rule, and position sizing. Describe it to Quant, inspect the Code to confirm that crosses are evaluated on closed bars, and click Run. The Making Strategies with Quant guide shows the workflow, and the native backtest guide explains the Backtest Summary: net profit, trade count, win rate, maximum drawdown and profit factor, with commission and slippage set in the strategy properties.
Compare the filtered rule (signal crosses agreeing with the zero side) with the unfiltered one and with a plain zero-cross rule, on identical data and costs, and read trade count before return. Trying many length combinations on the same history and keeping the best is curve fitting; hold out a period the settings never saw.
Alerts
The native indicator's four alert conditions cover the two reads described above, and Quant Charts alerts fire on the confirmed bar rather than on an intrabar touch that may reverse before the close. If you also chart on TradingView, its built-in True Strength Index exposes the same crosses through its alert dialog. Whichever platform you use, alert on the exact condition you tested, not on a looser one.
Conclusion: Using the Trend Strength Index with LuxAlgo
The True Strength Index is a careful piece of design: a bounded, zero-centered read of how directional recent movement has been, smooth enough to mark turns and divergences cleanly. Its cost is lag, and its zero-area readings in ranges mean little. Used as a regime filter and a timing trigger inside a fully specified rule, with the stop and size taken from structure rather than from the oscillator, it earns its place; used as a standalone signal, it produces the many false crosses that TradingView's own documentation warns about.
The native True Strength Index on Quant Charts gives you the published calculation with alerts, and Quant lets you test the complete rule before trading it. Whatever the test shows, the line will be the same; what changes is whether the rule around it holds up.
FAQs
Is the Trend Strength Index the same as the True Strength Index?
In practice, yes. "Trend strength index" is a common name for William Blau's True Strength Index, the double-smoothed momentum oscillator described here. Check the formula rather than the label when comparing tools; the Ergodic Oscillator on some platforms is essentially the same construction with its signal line.
What are the standard TSI settings?
Blau's published defaults are a 25-period first EMA and a 13-period second EMA, with a signal EMA of 7 to 13 periods; the LuxAlgo build uses 25, 13 and 13. Shorter smoothing turns faster and whipsaws more; longer smoothing does the reverse. No setting tests best across all markets and timeframes.
Why is the TSI bounded between +100 and −100?
The denominator is the double-smoothed absolute price change, which can never be smaller in magnitude than the double-smoothed signed change in the numerator. The ratio therefore stays within −1 and +1 before scaling by 100. Readings near the limits essentially never print.
Are +25 and −25 real overbought and oversold levels?
No, they are conventions that charting packages draw by default. A trending market can hold beyond a guide for weeks and a quiet one may never reach it. Percentiles of the instrument's own TSI history make more defensible levels, and even those mark stretch rather than reversal.
Which is more reliable, the zero cross or the signal cross?
Zero crosses are slower and cleaner because they require the balance of directional momentum to shift over the whole lookback. Signal crosses fire earlier and fail more often. Many traders take only the signal crosses that agree with the zero-line side, and test the two separately.
Can I backtest a TSI strategy on Quant Charts?
Yes. Open the True Strength Index from the Library with Open on Quant Charts, describe the full rule to Quant including the three lengths, trigger, filter, stop and sizing, inspect the Code and click Run. Compare it with the unfiltered rule under the same costs and hold out data the settings never saw.
References
LuxAlgo Resources
- Quant Charts
- LuxAlgo Quant
- True Strength Index Indicator
- True Strength Index Concept
- Adaptive Momentum Oscillator
- RSI
- MACD
- Exponential Moving Average
- Overbought and Oversold
- Regular Bullish and Bearish Divergence
- Hidden Divergence
- Swing High and Low
- Making Strategies with Quant
- Native Backtest Guide
- Risking It Right
External Resources
Read next