Triple Top Pattern: Double Confirmation Entry
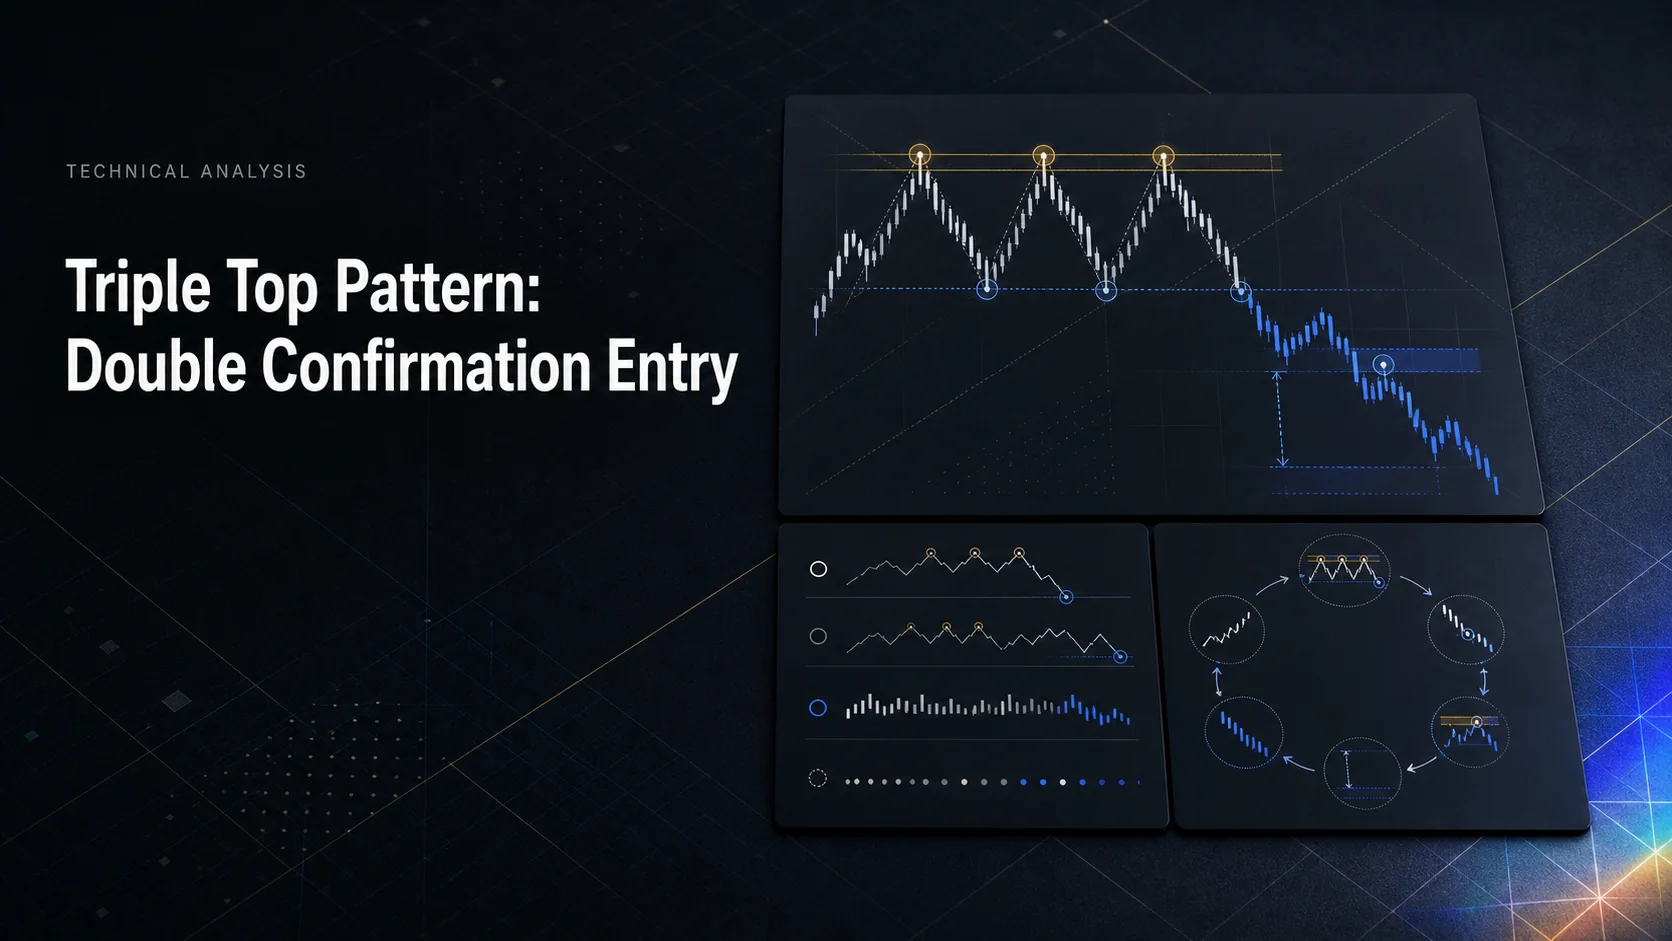
A Triple Top is a potential bearish reversal built from three distinct peaks near the same resistance zone. It is completed by a break below the intervening support—not simply by the third failed attempt at the highs. Until that break, the market may still be consolidating before another advance.
This guide uses double confirmation to mean a completed-bar support break followed by a failed retest of that support as resistance. Volume and momentum provide additional context. Waiting for the retest can improve entry location, but it can also mean missing a move that never returns.
LuxAlgo’s charting and AI platform lets you examine the structure on Quant Charts and define a reproducible test with Quant, our coding agent. Keep the visual pattern, the entry rule and any indicator’s own detection logic separate.
Finding Triple Top Patterns
Pattern Components
Start with an existing uptrend, three reasonably similar highs and two meaningful pullbacks between them. The highs need not match to the tick. Three adjacent candles tapping the same price are not necessarily three independent swings.
| Component | What to identify | Why it matters |
|---|---|---|
| Prior trend | An advance into the formation. | There must be an upward trend for a bearish reversal to reverse. |
| Three peaks | Well-separated highs around a common resistance zone. | Repeated tests establish the candidate structure, not a completed trade signal. |
| Two troughs | The reaction lows between those peaks. | The lower reaction low provides the conventional confirmation level. |
| Support break | A close below that level under your chosen rule. | Completes the pattern; a later rally can still invalidate the bearish trade. |
The LuxAlgo Triple Top/bottom guide describes this confirmation level as the lowest point between the peaks. If the troughs differ substantially, do not silently substitute a sloping line that produces an earlier entry. Define that alternative as a different rule and test it separately.
A clearly taller middle peak suggests a head-and-shoulders interpretation. Rising troughs beneath flat highs can resemble an ascending triangle. The eventual break matters more than choosing a convenient label before the outcome is known. Also distinguish this candlestick or bar-chart reversal from a Point & Figure Triple Top Breakout, which is a bullish resistance-break pattern.
Volume and Trend Analysis
Classical analysis looks for declining overall activity while the top develops and an expansion during the decline through support. This is supporting evidence, not a requirement that every peak’s volume be lower than the last. There is no universal rule that the second peak must have 50–70% of the first peak’s volume or that the third must have 20%.
Compare volume on a consistent basis: the same instrument, feed, session and bar interval. For an intraday study, compare similar times of day rather than treating the opening bar’s normal activity as an exceptional breakout. Ordinary bar volume measures traded activity; it does not directly identify all aggressive sellers or prove that institutions are distributing.
Quant Charts’ U.S. equities feed reflects Cboe EDGX activity rather than consolidated U.S. market volume. Cryptocurrency volume belongs to the displayed exchange, and other feeds may use different volume conventions. Check the chart data documentation before comparing figures from different platforms.
Double Confirmation Methods
1. Confirm the Neckline Break
Mark the support level before the break and specify what counts as confirmation. A daily setup might require a daily close below support; a one-hour strategy should use its own completed one-hour bars. A daily close is not mandatory for every timeframe.
A large bearish body, a close near the bar’s low and increased volume can support the reading, but none makes the next decline certain. A wick below support followed by a close back inside the range would fail a close-based rule.
An entry on the initial breakdown is one approach. Record whether it occurs at the next available price, on a stop trigger or after another condition. Do not assume a historical closing price was an executable fill known before the bar closed.
2. Wait for a Failed Retest
Under the double-confirmation approach, price returns toward broken support and then rejects it as resistance. A mere touch is insufficient: define the rejection, the allowed price tolerance and how long the setup remains valid.
| Retest observation | Possible rule to test | Limitation |
|---|---|---|
| Price location | Price revisits a predeclared zone around broken support. | A rally through the zone can restore the old range. |
| Rejection | A completed candle returns below the level after testing it. | The next executable entry may differ from that candle’s close. |
| Volume | Retest activity is lower than breakdown activity on a comparable basis. | This is bar-volume comparison, not the same thing as Volume Profile. |
| Candlestick context | A bearish rejection or engulfing structure forms at the level. | Candle names alone do not override support reclaim or poor reward relative to risk. |
| Expiry | Cancel if no qualifying retest occurs within a fixed number of bars. | The market may continue without offering any entry. |
For example, a research rule could allow a retest within five bars and within 0.25 ATR of the neckline, then require a close below it. Those are illustrative inputs, not recommended universal settings. Decide whether a close above the zone cancels the setup and whether multiple retests are permitted.
Volume Profile describes activity by price level; standard volume bars describe activity by time interval. A high-volume node near the neckline can be context, but it cannot replace the specific lower-volume retest condition above.
Indicator Confirmation
- MACD: compare matching price swings with the MACD line or histogram. Similar price highs with weaker oscillator peaks can indicate momentum disagreement. A signal-line cross is a different event; state which one the strategy uses.
- ADX: measures trend strength, not bearish direction. A rising ADX can accompany either an advance or a decline. Use price structure and, if included, the directional indicators to establish direction. StockCharts explains the ADX and +DI/−DI distinction.
- Stochastic Oscillator: can show weakening momentum or an overbought reading near the peaks. Overbought is not an automatic sell signal, and the oscillator can remain elevated during an uptrend.
MACD and Stochastic both derive from price, so agreement does not constitute two independent probability estimates. Compare the price-only entry with each added filter to see whether it improves results after costs, rather than assuming more indicators always improve accuracy.
Using LuxAlgo for Triple Tops
Chart the Structure and Inspect the Tool
On Quant Charts, identify the three swings, mark the resistance zone and lower reaction low, and keep the proposed stop and target visible. Record the symbol, timeframe, session and data source so the review can be repeated.
The EQH/EQL Liquidity Zones study provides a useful supporting view. It compares confirmed pivots within a percentage tolerance, extends qualifying zones and can retain swept zones in a faded style. This identifies repeated levels; an EQH label alone does not establish three peaks, a neckline break or a failed retest.
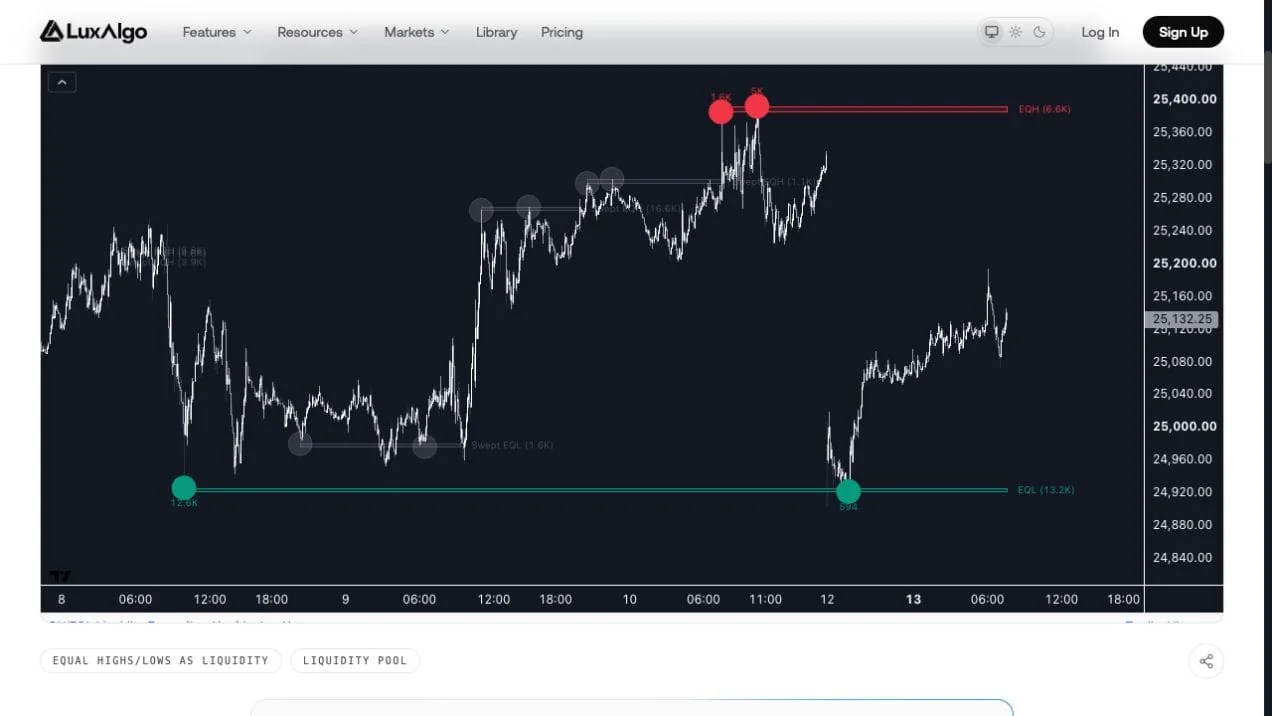
The study’s left/right pivot lengths affect when a high becomes confirmed. A label drawn on an earlier pivot bar is not evidence that the label was available then. Its displayed volume is based on pivot activity, not a measurement of actual stop orders waiting at the zone.
Strategy Testing with Quant
Use Quant, our coding agent, to turn the discretionary description into explicit code. A useful starting request is:
Build a Triple Top strategy with configurable confirmed-pivot lengths, peak-equality tolerance and minimum spacing. Use the lower intervening low as support. Require a completed-bar breakdown followed by a retest and rejection within a configurable expiry. Enter only after all conditions are known. Include structural stops, position sizing, commission and slippage, and log canceled candidates as well as trades.
Inspect the generated code and run it manually, following Making Strategies with Quant. Check several candidates bar by bar: pivot recognition, neckline selection, retest timing and fills should match the written rules. A compiling script is not proof that the intended pattern has been implemented correctly.
The native strategy viewer exposes trade logs and metrics such as win rate, profit factor and maximum drawdown. Compare breakdown entries with retest entries over the same dataset. Hold parameters fixed on an unseen period, include failed patterns, and report sample size and net expectancy. Optimizing many tolerances until a historical chart looks good can overfit the test.
Trade Alert Setup
Distinguish a candidate-level alert from an entry alert. A notification that price crossed support does not prove a retest, a volume condition or a valid short entry. Configure the specific supported event in the product and edition you use, including its timeframe and close-versus-intrabar behavior.
If no supported alert condition expresses your complete Triple Top definition, use the notification to prompt manual inspection instead of calling it a fully automated strategy. Test alerts against recorded chart events before relying on them; chart analysis and notifications do not themselves execute trades.
Managing Triple Top Trades
Stop-Loss and Targets
For a short trade, the stop is above entry. Possible reference points include the rejected retest high or the pattern’s resistance zone, depending on the strategy. A fixed two-ATR stop is another rule to evaluate, not a universal prescription. Compare its distance with the structure rather than choosing whichever produces the most attractive position size.
The conventional measured target subtracts the pattern’s height from the neckline: target = neckline − (peak level − neckline). This is an estimate, not a guaranteed destination. Nearby support may justify an earlier planned exit, and the actual entry price determines the available reward.
Consider a hypothetical advance from $209.39 into three peaks near $308.63, with a neckline at $265.25. The height is $43.38, so the measured objective is $221.87. A later move to $109.10 would extend well beyond that objective; it cannot be presumed from the formation. These figures illustrate a hypothetical scenario rather than an executable historical signal.
A documented historical example in StockCharts’ Triple Top guide uses Rockwell Automation in 1999: highs near $23, support around $19.80 and a projected $3.20 decline to $16.60. Its support retest illustrates the sequence, but one successful example does not establish a strategy’s success rate.
Position Size and Risk Ratios
For a hypothetical short entry at $99, stop at $103 and target at $90, planned risk is $4 per share and potential reward is $9, or 2.25R before costs. A $20,000 account using a 0.5% research risk budget allocates $100, allowing 25 shares before costs and broker constraints.
If the stop fills at $105 after a gap, the loss becomes $150 before costs. A stop order does not cap the realized loss at the planned amount. Short positions also require attention to borrowing availability and fees, margin and the possibility of losses beyond the initial allocation.
| Sizing approach | How it works | What to check |
|---|---|---|
| Fixed percentage | Risk budget changes with account equity. | A percentage such as 1–2% is not universally appropriate; account for correlated trades and drawdown limits. |
| Fixed dollar | Use a defined cash risk budget for each test. | Reassess its percentage of equity as the account changes. |
| Volatility-based | Use an ATR-related stop distance, then divide the risk budget by per-unit risk. | ATR estimates movement size, not direction or a guaranteed maximum loss. |
For shares, planned quantity is the risk budget divided by the entry-to-stop distance, rounded down where whole shares are required. For contracts, include the point value and minimum contract size. Reduce quantity for estimated costs; do not tighten a structurally necessary stop merely to fit a larger position.
Market Rules and Timing
Major daily Triple Tops can develop over months; intraday formations have different noise, liquidity and execution conditions. Select the timeframe before evaluating examples. For U.S. equities, 9:30 a.m.–4:00 p.m. Eastern is the regular core session on a normal full trading day, with holidays and early closes requiring a calendar check. This schedule is not a universal rule for forex, futures or crypto.
Pre-market activity, earnings announcements, spreads and available liquidity can change execution. A higher-volume session does not ensure accurate pattern detection. Keep session definitions consistent between chart review, volume comparisons and backtests.
Moving a stop to entry after a favorable one-ATR move or trailing it at 1.5 ATR are optional strategies to test. For a short, an ATR trail generally sits above the chosen low-price reference and should not be widened simply because volatility increases. A stop at the entry price is not true breakeven after fees, spread, borrowing costs or slippage.
A Practical Review Checklist
- Confirm the prior uptrend, three distinct peaks and lower intervening support.
- Separate a completed breakdown from a still-developing range.
- Define the retest, rejection, expiry and invalidation before looking at the outcome.
- Check volume and momentum on a consistent basis without counting correlated indicators as independent proof.
- Calculate reward relative to risk from the actual proposed entry and include execution costs.
- Use Quant Charts for the visual review and Quant for a manually inspected test; retain failed candidates and canceled setups in the record.
FAQs
How can I use the Triple Top pattern to spot potential bearish reversals in my trading strategy?
Look for an existing uptrend, three distinct highs near resistance and two intervening reactions. The conventional pattern completes when price breaks below the lower reaction low. Before that break, it remains a candidate that may resolve upward.
What does double confirmation mean for a Triple Top entry?
In this guide it means a completed-bar support break followed by a retest that rejects the old support as resistance. Define the retest tolerance, rejection condition and expiry in advance. A retest may never occur, and confirmation does not guarantee a profitable trade.
How can I confirm a breakout using volume and other indicators?
Compare breakdown and retest activity using the same feed, session and timeframe. Expanding breakdown volume or weakening momentum can support the reading, but fixed peak-volume percentages are not universal rules. ADX measures strength rather than bearish direction.
How does LuxAlgo help identify and confirm Triple Top patterns?
Quant Charts supports visual structure review, while Quant helps code explicit rules for testing. Library studies such as EQH/EQL Liquidity Zones can identify repeated levels. Equal-high or supported pattern alerts do not automatically establish a complete Triple Top break-and-retest sequence.
How do I calculate a Triple Top price target?
Subtract the height between the peaks and neckline from the neckline. Peaks at $110 and support at $100 produce a conventional $90 objective. Calculate reward from the actual entry, and treat the objective as an estimate rather than a promised destination.
Can I backtest a Triple Top strategy without look-ahead bias?
Use only information available when each decision occurs. Confirm pivots before using them, enter after the required breakout and retest events, and include costs and failed candidates. Inspect generated code and run it manually, then evaluate fixed rules on unseen data.
References
LuxAlgo Resources
- Triple Top/bottom Concept Guide
- Quant Charts
- Chart Data and Volume Sources
- EQH/EQL Liquidity Zones
- Quant
- Making Strategies with Quant
- Native Strategy Viewer and Backtests
External Resources
Read next