Ultimate Guide to Stochastic Divergence Trading

Stochastic divergence is a mismatch between price swings and oscillator swings, not a prediction that price must reverse. Regular divergence is commonly studied as a reversal setup; hidden divergence as a continuation setup. Neither becomes a complete strategy until the swing definitions, confirmation timing, entry and risk rules are specified.
With LuxAlgo’s native charts and Quant, our coding agent, you can examine the pattern, implement its rules and test the trades it would actually produce. This guide explains the four common forms, shows how confirmation delay changes an example, and separates native divergence tools from TradingView toolkits.
Stochastic Oscillator Fundamentals
The stochastic oscillator compares the close with the high–low range over a selected number of bars. In TradingView’s documented calculation, the raw range-position value is smoothed into %K, and a further average of %K produces %D.
Record a baseline by input name: range lookback 14, %K smoothing 3 and %D period 3, with the smoothing method specified. A shorter lookback such as 10 or a more smoothed configuration such as 21,5,5 changes the response. These are candidates to compare, not configurations proven best for ranging markets or volatile cryptocurrencies.
For divergence, also record which oscillator series supplies the swings. A pattern on %K need not match one on %D, and neither is automatically the same as a divergence on another oscillator. An oscillator reading above 80 or below 20 is context, not a valuation judgment or an instruction to trade.
Four Divergence Patterns to Recognize
| Pattern | Price relationship | Oscillator relationship | Hypothesis to test |
|---|---|---|---|
| Regular bullish | Lower low | Higher low | Downward momentum may be weakening |
| Regular bearish | Higher high | Lower high | Upward momentum may be weakening |
| Hidden bullish | Higher low | Lower low | A pullback may occur within an independently defined uptrend |
| Hidden bearish | Lower high | Higher high | A rally may occur within an independently defined downtrend |
Compare corresponding lows for bullish patterns and highs for bearish patterns. Define whether you sample the oscillator at price pivots or match separately confirmed oscillator pivots within a tolerance. Either approach needs a consistent rule; switching between them after seeing a favorable chart changes the strategy.
Regular divergence can develop repeatedly while a trend continues. Hidden divergence requires a trend definition rather than assuming continuation from the pattern name. An extreme-zone filter, such as requiring a bullish candidate below 20, is an additional condition whose contribution should be tested rather than described as universally strongest.
The Signal Exists When It Becomes Known
Connecting two historical pivots can make a divergence appear earlier than it was detectable. Distinguish the pivot candle, the candle confirming that pivot, and any later price-confirmation candle.
Consider this hypothetical bullish candidate on a daily chart. The first low is $100 with a selected stochastic reading of 12. Later, price reaches $98 while the corresponding reading is 20. That is a lower price low with a higher oscillator reading under the chosen sampling rule.
| Event | What is known | What cannot be assumed |
|---|---|---|
| Second low prints at $98 | A potential turning point exists | That this is already a confirmed swing low |
| Three required later bars complete | The second pivot qualifies if all pivot conditions hold | An entry at the low three bars earlier |
| Price later closes above the predefined $101 confirmation level | The candidate has met that price-confirmation rule | A fill at $98 or an inevitable profitable trade |
| Next permitted entry | The actual executable price determines the trade’s risk | The original reward-to-risk relationship if price gaps |
The $101 level must have been defined before confirmation, with a rule for how it was selected. Specify how long the candidate remains valid and what cancels it. A fresh synchronized low, an expired confirmation window or a price move that makes the planned entry too expensive may invalidate the setup.
Bearish examples reverse the geometry and trade direction. Short trades also require instrument-specific assumptions about borrowing, fees and permitted execution.
Turn Reversal and Continuation Ideas into Rules
A reversal strategy might require regular divergence near a support or resistance zone marked before the setup, followed by a completed close through a defined trigger level. A hammer or engulfing formation could be a different trigger, but the candle pattern needs exact conditions rather than a discretionary label.
A continuation strategy might require price above a specified moving average before accepting hidden bullish divergence during a pullback. For a bearish version, define the downtrend and rally condition separately. Moving averages such as 50 and 200 periods are examples, not proof of trend persistence.
ADX can supply a strength filter, but it does not determine direction. A threshold such as 25 is a convention to evaluate, not a universal boundary between profitable and unprofitable divergence trades. Adding volume or price-action filters also requires comparison with the base rule.
A published win-rate figure is useful only with a reproducible strategy, sample, costs and entry/exit definitions. A trending-versus-ranging success rate cannot be transferred to a different implementation without that evidence.
Use Multiple Timeframes Without Looking Ahead
| Context chart | Setup chart | Possible timing chart |
|---|---|---|
| Daily | 4-hour | 1-hour |
| Weekly | Daily | 4-hour |
| 4-hour | 1-hour | 15-minute |
These arrangements preserve distinct jobs for the charts. They are not a requirement to find divergence on every interval. A single-timeframe system can be tested too, and correlated price-derived conditions do not become independent confirmations merely because they appear in different windows.
If a rule uses a completed daily or weekly reading, its final value is unavailable during that unfinished candle. Define how conflicts are handled: skip, wait or use one interval solely as context. Higher-timeframe information is not automatically correct information.
Native Divergence Tools and Quant
The Divergence Variants & Confirmation Library indicator distinguishes pending patterns from confirmed and failed ones. It supports regular, hidden and exaggerated variants; its default oscillator is RSI, so select the stochastic option when investigating stochastic divergence.
Review oscillator length and smoothing, left/right pivot bars, maximum swing separation and the confirmation rule. The documented default is a structure break, with a window limiting how long a candidate can wait. Right-side pivot bars add detection delay. The dashboard’s confirmation rate measures patterns meeting that rule, not the win rate of a strategy with entries, exits and costs.
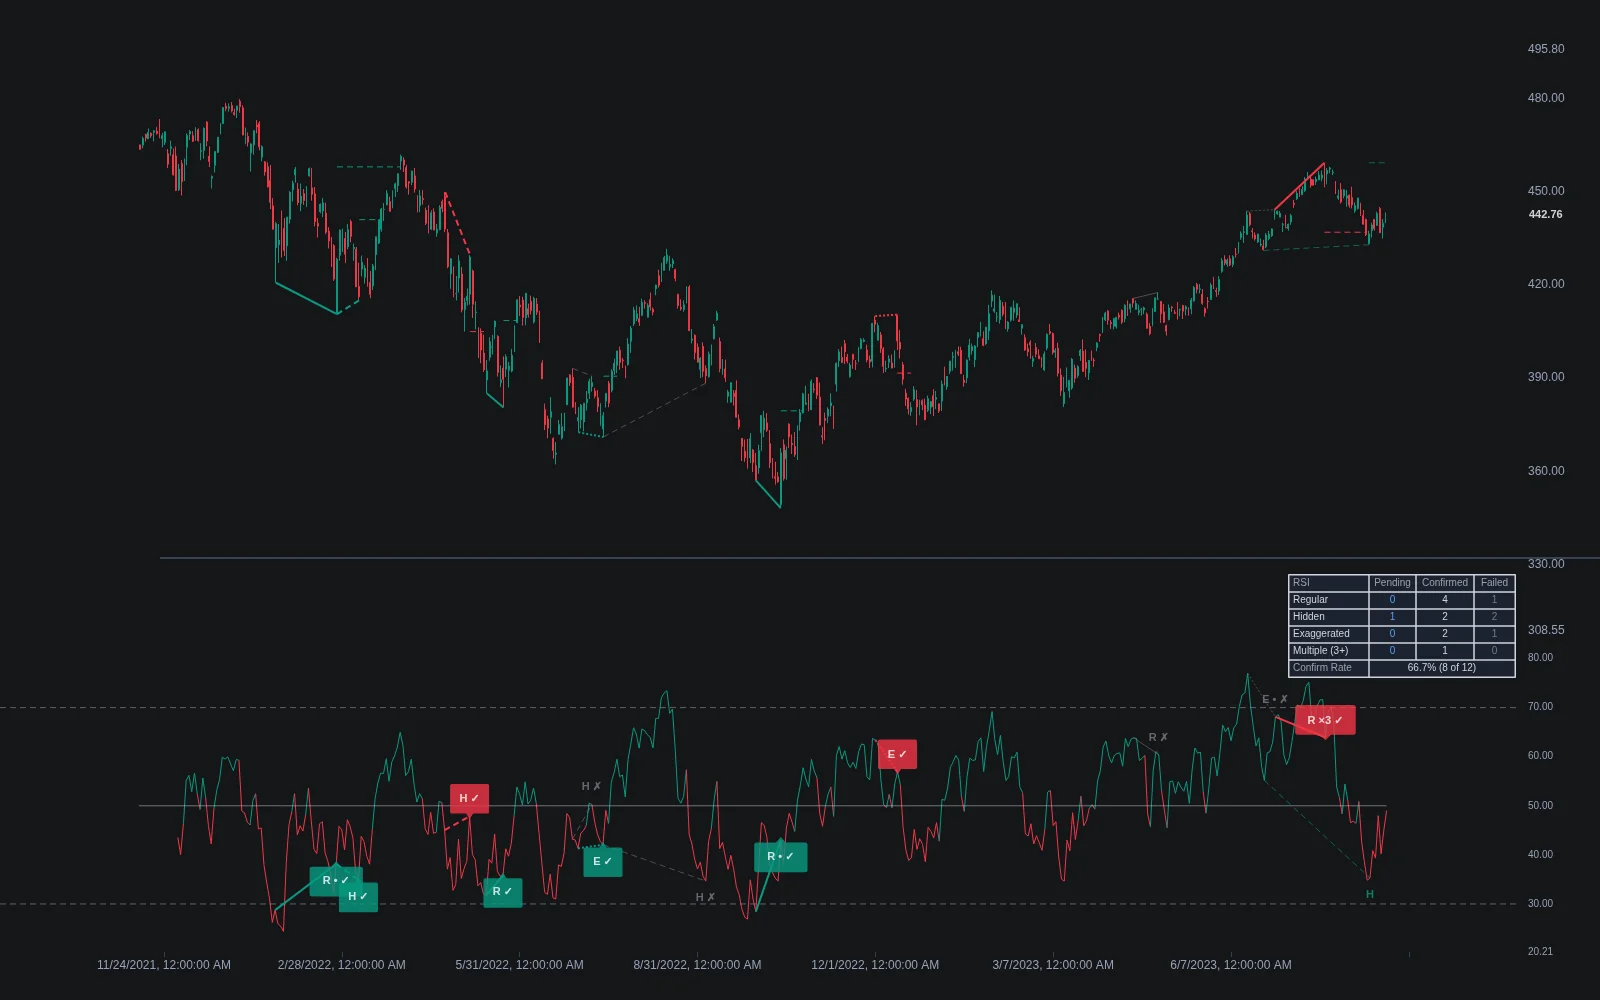
Ask Quant to implement your full trading rule, including the point when a divergence becomes available. Review the generated code and plotted entries, then run the strategy with commission and slippage assumptions. A detector, an alert and a backtested trading strategy are separate things; none should be treated as automatic broker execution.
Risk, Targets and Execution
Choose invalidation before calculating position size. A structural stop beyond a swing and an ATR-based distance are different policies. Multipliers such as 1.5, 2 or 3 times ATR are possible test inputs, not universal settings or guaranteed loss limits.
For example, suppose the confirmed setup allows an entry at $102 with a planned stop at $99. The price-risk distance is $3 per share. A hypothetical $150 price-risk budget permits 50 shares before costs, slippage and buying-power constraints. A target at $108 offers $6 per share, or 2R, if reached and filled as assumed.
A 2R target is not a 2R expected return. With every win exactly +2R and every loss exactly −1R, the theoretical break-even win rate is one-third before costs. Gaps, partial exits, trailing stops and variable fills change that calculation. Record actual average wins and losses in the test.
If taking partial profits at a level and trailing the rest, define the fractions, activation point and trailing method. A trailing stop can still be slipped through; it does not guarantee that unrealized gains are locked in.
Scheduled news, thin liquidity, overnight gaps and spread expansion can alter execution. A fixed 30-minute pause around every announcement is not a universal safe window. Define an event policy appropriate to the instrument and test it where the data permits. In a range, distinguish a boundary-reversal strategy from a breakout strategy rather than mixing their entry rules.
A Practical Research and Review Process
- Choose the market, timeframe, oscillator series and named inputs.
- Define pivot pairing, divergence type, confirmation delay, expiry and invalidation.
- Specify entry timing, stops, targets, position sizing and costs.
- Inspect the generated strategy’s individual trades, including failed or expired patterns.
- Compare limited alternatives and evaluate the chosen approach on a separate period.
- Paper trade the workflow before deciding whether it fits your execution and risk constraints.
Use the LuxAlgo Journal for recorded trades and notes. Log the divergence type, detection time, confirmation event and reason for exit, alongside net results. Keep a separate experiment log so unsuccessful configurations are not forgotten when selecting a promising one.
Judge the strategy using drawdown, average net trade, trade count, profit factor and the distribution of outcomes as well as win rate. Confirmation is a defined event; profitable performance remains something to evaluate.
FAQs
How do you trade stochastic divergence correctly?
Define the oscillator series and paired swings, wait until the required pivot and price-confirmation information is available, and follow explicit entry, exit and position-sizing rules. Test with realistic costs and a separate evaluation period. Regular and hidden divergence describe different patterns; neither guarantees a reversal, continuation or profitable trade.
Read next