Ultimate Oscillator: Combining Three Timeframes
The Ultimate Oscillator is Larry Williams's 1985 answer to a problem every single-window oscillator has: it throws extremes and divergences at different times depending on the lookback you chose. Instead of one window, it measures buying pressure against true range over three, 7, 14 and 28 bars by default, and blends the three ratios with weights of 4, 2 and 1 into one reading between 0 and 100. The short window supplies responsiveness; the two longer ones anchor it, so extremes arrive less often and divergence arcs run smoother. Readings above 70 and below 30 are the conventional overbought and oversold zones, but Williams did not trade the levels alone. His published rule was a divergence whose first oscillator trough prints below 30, confirmed by a break of the interim oscillator high, and the mirror image above 70.
Key points:
- Three windows, one line: the blend damps the one-bar spikes that fool short oscillators while the dominant 7-bar term keeps the line moving.
- A composite reading: a middling 55 can hide a hot short window cooled by a soft long one, which is why the method leans on divergence and confirmation rather than the raw number.
- Williams's rule, not the level: divergence from the extreme zone plus a break of the interim oscillator peak is the signal; a 30/70 cross alone recreates the false signals the design was built to filter.
- Extremes persist in trends: the blended reading can hold near 70 while price keeps running, and there the extreme is partly a strength signal.
The LuxAlgo Ultimate Oscillator is the standard build of Williams's formula with four level alerts, and it opens on Quant Charts in one click. Quant, our coding agent, can turn Williams's full rule into a strategy you can inspect in Code and test with Run.
Ultimate Oscillator Divergences: Video Walkthrough
The Secret Mindset published this walkthrough in May 2020. It shows the divergence reading on forex and stock charts; treat any results shown as illustrations of the method rather than as evidence about performance.
How the Ultimate Oscillator Is Calculated
Two per-bar quantities feed the calculation. Buying pressure is how far the close finished above the true low, and true range is the full distance the bar covered once gaps are accounted for. Summing each over a window and dividing asks how much of the available range buyers actually captured over that window.
Breaking Down the Formula
- True low: the lower of the bar's low and the previous close.
- Buying pressure (BP): Close − true low.
- True range (TR): the higher of the bar's high and the previous close, minus the true low. The Library's ATR page covers the same true-range construction.
- Three ratios: sum BP and sum TR over 7 bars and divide; repeat over 14 and over 28.
- Blend: UO = 100 × (4 × Average7 + 2 × Average14 + 1 × Average28) ÷ 7.
The weights are fixed constants of the published formula; tuning happens through the lengths. Because the three windows nest, the 7-bar ratio also sits inside the 14- and 28-bar sums, which is part of why the line is smoother than a plain 7-bar oscillator without being as slow as a 28-bar one.
Example Calculation
The hypothetical table walks seven daily bars. Note that true range uses the previous close when it lies outside the bar's range, which is why days 5 to 7 have a true range of $0.60 rather than the $0.40 a plain high-minus-low would give.
| Day | High | Low | Close | Previous close | True low | BP | TR |
|---|---|---|---|---|---|---|---|
| 1 | $10.50 | $9.80 | $10.20 | $10.00 | $9.80 | $0.40 | $0.70 |
| 2 | $10.80 | $10.10 | $10.60 | $10.20 | $10.10 | $0.50 | $0.70 |
| 3 | $11.00 | $10.40 | $10.90 | $10.60 | $10.40 | $0.50 | $0.60 |
| 4 | $11.20 | $10.70 | $11.10 | $10.90 | $10.70 | $0.40 | $0.50 |
| 5 | $11.50 | $10.90 | $11.30 | $11.10 | $10.90 | $0.40 | $0.60 |
| 6 | $11.70 | $11.10 | $11.50 | $11.30 | $11.10 | $0.40 | $0.60 |
| 7 | $11.90 | $11.30 | $11.70 | $11.50 | $11.30 | $0.40 | $0.60 |
| 7-bar sums | $3.00 | $4.30 | |||||
The 7-bar ratio is $3.00 ÷ $4.30 = 0.698: buyers captured about 70% of the available range over the week. Suppose the 14-bar ratio, which includes an earlier softer week, is 0.55 and the 28-bar ratio is 0.48. The blend is 100 × (4 × 0.698 + 2 × 0.55 + 0.48) ÷ 7 = 62.5. The reading is well below 70 even though the last week was strongly one-sided, because the two longer windows pull it toward the medium-term balance. That is the design working: a hot week is not an extreme until the longer windows agree.
Changing the Lengths
The 7/14/28 defaults double at each step and the 4/2/1 weights were designed around that spacing. Compressing all three, for example 4/8/16, makes the line reach the extremes more often and suits faster work; stretching them, for example 14/28/56, reserves the zones for larger moves. Changing one length without rebalancing the others changes the oscillator's character rather than its speed. There is no set of lengths that tests best across markets or asset classes; the honest procedure is to keep the proportions, choose the scale from your holding period, and record the three numbers with every result.
Reading Signals: Levels, Divergences and Williams's Rule
Overbought and Oversold Levels
Above 70, buying pressure is stretched across the blend; below 30, selling pressure dominates all three windows. The 50 area marks balance: buyers captured roughly half the true range on a weighted basis. Because the blend needs the longer windows to agree, the zones are visited less often than on the RSI or the stochastic at comparable settings. The zones are also where the line parks in strong trends: in a persistent advance the reading can hold near 70 while price keeps running, and the extreme is then partly a strength signal. Fading the first stretched reading is exactly the mistake the method was built to avoid.
Williams's Divergence Rule
The published buy setup has three parts, and the sell setup mirrors each of them above 70.
| Step | Buy setup | Sell setup (mirror) |
|---|---|---|
| 1. Extreme | The oscillator's first trough prints below 30 during a decline | The oscillator's first peak prints above 70 during an advance |
| 2. Divergence | Price sets a lower low while the oscillator sets a higher low | Price sets a higher high while the oscillator sets a lower high |
| 3. Trigger | The oscillator breaks above the interim peak that formed between its two troughs | The oscillator breaks below the interim trough that formed between its two peaks |
| What is not a signal | The divergence by itself, or a cross back above 30 without the break | The divergence by itself, or a cross back below 70 without the break |
The confirmation step is integral. Acting on the divergence alone recreates the false signals the three-window design was meant to filter, and a cross of the level alone ignores the structure the divergence identified. The trigger also has a natural stop: the price low that formed the second trough of the divergence. StockCharts' ChartSchool page walks through the same conditions.
Hidden Divergence
A hidden divergence, price making a higher low while the oscillator makes a lower low inside an uptrend, points to continuation rather than reversal. It belongs to a different rule from Williams's reversal setup and should be tested separately; the two are easy to conflate because both are oscillator-versus-price comparisons. The Library's regular divergence page sets out the grammar both follow.
Using the Ultimate Oscillator in Practice
Regime and Trend Context
The 50 midline is a soft bias read: sustained readings above it say buyers have been capturing more than half the true range across the blend, sustained readings below say sellers have. Some traders take Williams's buy setups only when a higher-timeframe read agrees, and skip sell setups in a market whose weekly oscillator sits above 50. That filter reduces trade count; whether it improves results is a question for the test rather than an assumption. What the indicator does not do is confirm a trend by itself: a reading of 60 is a composite of three windows and says nothing about structure.
Ranges, Gaps and Intraday Use
In a trading range the oscillator swings between its zones repeatedly, and that is where the level-exit read, a cross back above 30 or below 70, is most often used as a mean-reversion timing signal. In a trend the same crosses fire against the move. The formula is bar-based, so the 7/14/28 structure applies unchanged to intraday charts, but overnight gaps feed outsized true-range and buying-pressure values into the sums at the open, so intraday readings around the first bars of a session deserve extra scepticism. None of this makes the oscillator immune to false signals in volatile conditions; the blend reduces whipsaw relative to a single 7-bar window, it does not remove it.
A Worked Rule with Position Sizing
Consider a hypothetical stock on a daily chart, a $25,000 account and a 1% risk budget of $250. The rule is Williams's buy setup: first oscillator trough below 30, a lower price low against a higher oscillator low, and a break above the interim oscillator peak, with the stop below the price low of the second trough and a first target at the next resistance zone. See Risking It Right for the budgeting logic.
| Step | Calculation | Result before costs |
|---|---|---|
| Setup | Oscillator troughs at 26 then 33 while price prints lows at $41.80 then $41.10; interim oscillator peak 41 | Bullish divergence with the first trough below 30 |
| Trigger | Oscillator closes above 41 | Buy next open at $42.60 |
| Stop below the second price low | $41.10 minus a $0.20 allowance | Stop $40.90; $1.70 risk per share |
| Position size | $250 ÷ $1.70, rounded down | 147 shares; $249.90 planned risk; $6,262.20 notional |
| First target at the next resistance zone | $46.00 − $42.60 | $3.40 reward, about 2.0R |
| Gap through the stop, fill at $40.30 | 147 × ($42.60 − $40.30) | $338.10 loss, about 1.35R; a stop level is not a guaranteed fill |
The stop comes from price structure, the trigger from the oscillator and the size from the stop distance. A break-even win rate for a 2R rule is 33% before costs; what the rule actually achieves on your markets is what the test reports.
Using the Ultimate Oscillator on Quant Charts
The Native Ultimate Oscillator
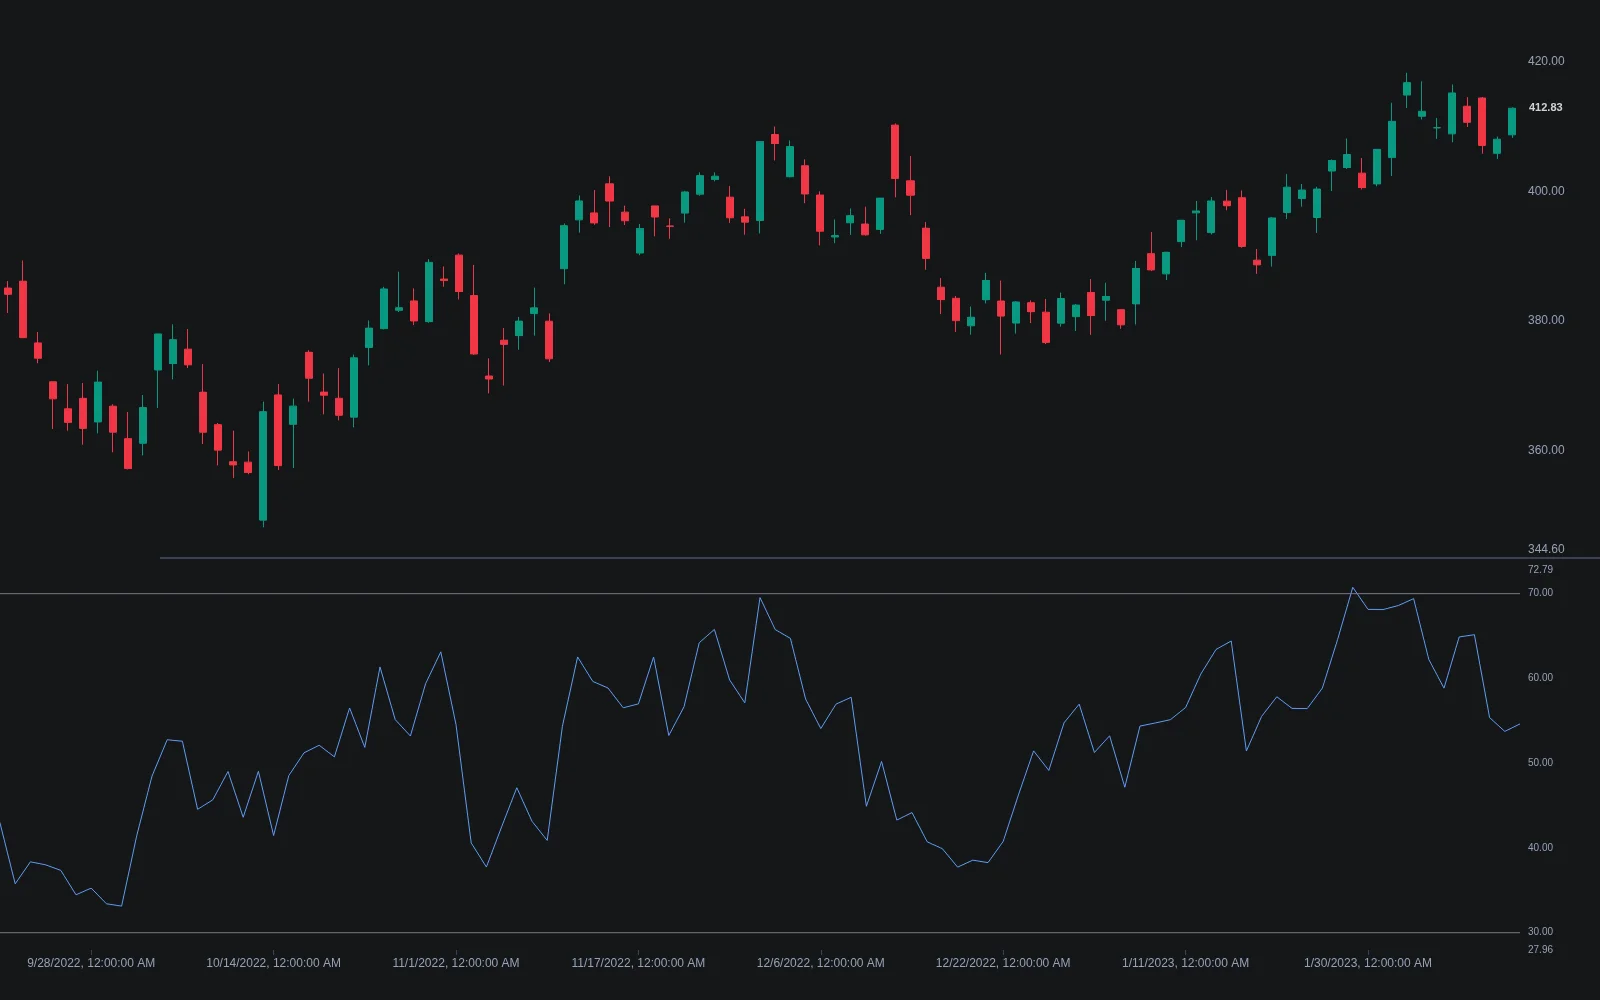
The Library's Ultimate Oscillator is Williams's formula without modification: Fast Length 7, Middle Length 14, Slow Length 28, Overbought 70 and Oversold 30, with the 4/2/1 weights as fixed constants and four alerts, Overbought, Overbought Exit, Oversold and Oversold Exit, covering the zone entries and the exits often used for timing. The source is published on the page, so the true-low and true-range handling can be checked line by line.
| Tool | What it adds | Where it runs |
|---|---|---|
| Ultimate Oscillator | Williams's blended momentum reading with level alerts | Quant Charts, from the Library page |
| Relative Strength Index | A single-window comparison, useful for seeing what the blend changes | Quant Charts, from the Library page |
| Stochastic | A faster range-position read that can time entries inside the oscillator's bias | Quant Charts, from the Library page |
| Support and Resistance Levels with Breaks | The zones that give a divergence a location and a target | Quant Charts, from the Library page |
Testing Williams's Rule with Quant
Write the rule completely: the three lengths, the extreme threshold for the first trough, how the two troughs and the interim peak are identified, the trigger (a close above the interim peak), the stop below the second price low, the target and the position sizing. Describe it to Quant, inspect the Code to confirm that the troughs are confirmed pivots rather than live values and that the trigger is evaluated on closed bars, and click Run. The Making Strategies with Quant guide shows the workflow, and the native backtest guide explains the Backtest Summary: net profit, trade count, win rate, maximum drawdown and profit factor, with commission and slippage set in the strategy properties.
Three comparisons are worth running. Williams's full rule against the divergence alone, to see what the confirmation break buys. The full rule against a plain 30-cross mean-reversion rule, to see what the divergence buys. And the 7/14/28 defaults against a compressed and a stretched set with the same proportions, to see how the scale interacts with your holding period. Read trade count before return, since a three-step setup fires rarely, and hold out data the lengths never saw.
Conclusion
The Ultimate Oscillator is a repair job by a trader who knew the flaws of single-window oscillators firsthand. Blending three windows of buying pressure against true range makes extremes rarer and divergence arcs smoother, and Williams paired the line with a complete rule, extreme, divergence and confirmation break, rather than a bare threshold. Read that way, it is a disciplined reversal method with a natural stop. Read as a 30/70 signal generator, it inherits the whipsaw of every oscillator in a trend.
Key Takeaways
- The blend is the point. A 7-bar window weighted 4 supplies sensitivity; 14- and 28-bar windows weighted 2 and 1 veto extremes that exist only on the short view.
- The level is a composite. A reading of 62 can hide a hot week cooled by a soft month, so read divergence and structure rather than the number alone.
- Williams's rule has three steps. First trough below 30, a lower price low against a higher oscillator low, then a break of the interim oscillator peak. The mirror applies above 70.
- Extremes persist in trends. Fading the first stretched reading recreates the false signals the design was built to filter.
- Native and testable. The Ultimate Oscillator opens on Quant Charts with level alerts, and Quant can build and test the full rule against its simpler alternatives.
FAQs
What are the standard settings for the Ultimate Oscillator?
Williams's construction sums buying pressure and true range over 7-, 14- and 28-bar windows, divides one sum by the other for each, weights the ratios 4, 2 and 1 and scales to 0 to 100. The native build uses those defaults with 70 and 30 as the levels. The proportions matter more than the absolute numbers, so change all three lengths together.
Why does the Ultimate Oscillator use three timeframes?
Because a single-lookback oscillator produces extremes and divergences whose timing depends on the chosen length. Blending three horizons lets the 7-bar window supply sensitivity while the 14- and 28-bar windows veto extremes that exist only on the short view. That reduces whipsaw rather than eliminating it; momentum extremes still fail in strong trends.
What is buying pressure in the Ultimate Oscillator?
The close minus the true low, where the true low is the lesser of the bar's low and the previous bar's close. Dividing its sum by the sum of true range asks how much of the available range buyers actually captured, with gaps handled by the true-range adjustment.
Is a reading above 70 a sell signal?
Not on its own. Above 70 means buying pressure is stretched across all three windows, which is exactly what strong advances produce, and the reading can hold there while price keeps rising. Williams's sell setup requires a bearish divergence whose first peak prints above 70 and a break below the interim oscillator trough.
How is the Ultimate Oscillator different from RSI?
RSI runs one lookback over smoothed gains and losses, so it reaches overbought and oversold more often. The Ultimate Oscillator blends three windows of buying pressure against true range, trading signal frequency for divergences Williams considered more reliable. The two are useful side by side precisely because they disagree about timing.
Can I backtest Williams's Ultimate Oscillator rule on Quant Charts?
Yes. Open the Ultimate Oscillator from the Library with Open on Quant Charts, describe the three-step rule to Quant including the lengths, the extreme threshold, the interim-peak trigger, the stop below the second price low and the position sizing, inspect the Code and click Run. Compare it with the divergence alone and with a plain level-cross rule under the same costs.
References
LuxAlgo Resources
- Quant Charts
- LuxAlgo Quant
- Ultimate Oscillator Indicator
- Ultimate Oscillator Concept
- Relative Strength Index Indicator
- Stochastic Indicator
- Support and Resistance Levels with Breaks
- ATR
- RSI
- Stochastic Oscillator
- Regular Bullish and Bearish Divergence
- Hidden Divergence
- Making Strategies with Quant
- Native Backtest Guide
- Risking It Right
- Reversal Spotting Made Easy
External Resources
Read next