Up/Down Volume Indicator: Analyzing Volume Direction Changes
The Up/Down Volume Ratio compares volume on rising-close bars with volume on falling-close bars over a defined window. A reading above 1 means the first total is larger; below 1 means the second is larger. It describes how volume is distributed across price-direction categories, not how many buyers or sellers participated.
Use LuxAlgo’s native charts to examine price and volume, then ask Quant to help build and test a clearly specified ratio-based strategy. First identify the calculation: a rolling Up/Down Volume Ratio, an intrabar Up/Down Volume histogram, and footprint-based volume delta are related but different tools.
How the Up/Down Volume Ratio Works
Define the Ratio Before Reading the Signal
For an unsmoothed, close-to-close ratio over N bars, assign each bar’s whole volume to the up category if its close exceeds the preceding close, or the down category if it is lower. In this version, an unchanged close contributes to neither category.
Up/Down Volume Ratio = sum of up-bar volume ÷ sum of down-bar volume.
Linn Software’s UDVR documentation also describes optional smoothing and an inverted down/up version. Record the lookback, smoothing, and orientation because they change the reading. An average of individual ratios is not generally the same as a ratio of the two summed volumes.
If down volume is zero, division does not produce an ordinary finite ratio. If both totals are zero, the ratio is undefined. Treat these cases explicitly in a script; replacing them with an arbitrary large value can create false threshold crossings.
Worked Calculation
Suppose a hypothetical ten-day window contains 2.5 million shares on up days and 1.8 million on down days. The ratio is 2.5 ÷ 1.8 ≈ 1.39. Up-day volume is about 39% greater than down-day volume. This is not evidence that there were 39% more buyers: every executed share had both a buyer and seller.
Likewise, a ratio of 1.5 means the up-category total is 50% larger than the down-category total. It does not measure the proportion of trades initiated at the ask. Multiplying both totals by ten leaves the ratio unchanged, so inspect total activity as well as the ratio.
A Ratio Is Different from an Intrabar Histogram
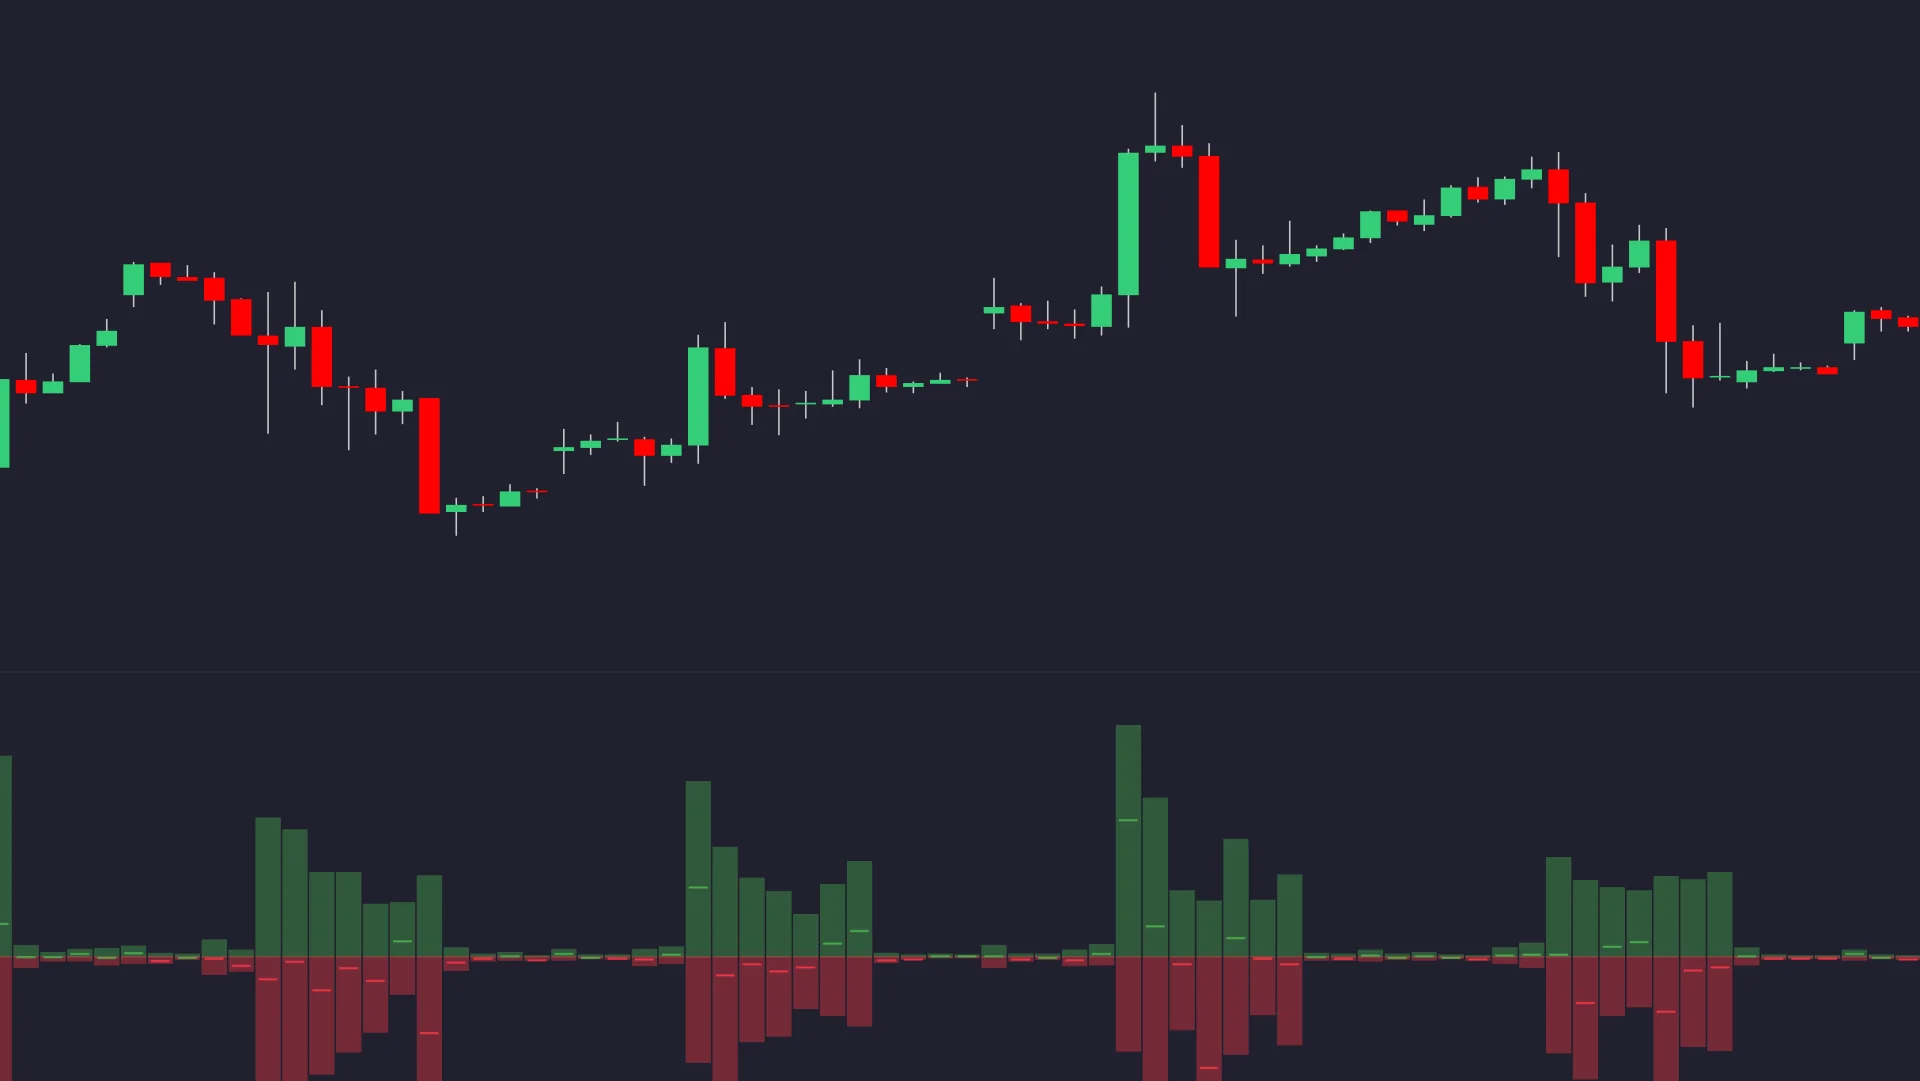
TradingView’s built-in Up/Down Volume examines lower-timeframe candles within each chart bar. It displays estimated up volume above zero and down volume below zero, with a delta mark. That display is not the rolling ratio described above.
Its directional estimate primarily compares each smaller candle’s close with its open, with a separate rule for equal open and close. Changing the lower timeframe changes granularity and historical coverage. A candle-derived estimate should not be labeled direct trade-by-trade aggressor data.
Reading Volume Direction Changes
Separate the Level from the Change
A rise from 0.8 to 1.2 crosses the equal-volume reference. A decline from 1.4 to 1.1 shows a smaller relative up-volume excess, but that excess remains positive. Neither observation guarantees a price reversal.
A jump from 1.1 to 2.0 could reflect new up volume, reduced down volume, or an older down-volume bar leaving the rolling window. Check both totals before calling it new buying activity. A small denominator can make the ratio unstable even when total volume is modest.
| Observation | What it establishes | What to check next |
|---|---|---|
| Ratio above 1 | More volume in up-close bars within the window | Total activity, price structure, and the selected window |
| Ratio below 1 | More volume in down-close bars within the window | Whether price confirms the proposed setup |
| Ratio near 1 | Similar classified totals | Activity may still be high; this does not prove consolidation |
| Large ratio jump | The relationship between the totals changed | Denominator size and bars entering or leaving the window |
| Price and ratio disagree | A potential divergence under your swing definition | Confirmation timing, invalidation, and later outcomes |
Values such as 1.5, 2.0, 0.6, or 0.5 are not universal entry, exhaustion, or reversal thresholds. Choose any threshold before testing it and compare results across different market periods. A faster change is not automatically a more predictive change.
Regular and Hidden Divergence
Regular bullish divergence compares a lower price low with a higher indicator low; regular bearish divergence compares a higher price high with a lower indicator high. These can be investigated as reversal conditions.
Hidden bullish divergence pairs a higher price low with a lower indicator low; hidden bearish divergence pairs a lower price high with a higher indicator high. These are commonly studied as continuation patterns, not automatic evidence that the existing trend is ending.
There is no universal rule that a divergence lasting three to five periods is more reliable. Define corresponding swings consistently. If a pivot needs later bars to confirm, a backtest must wait for those bars instead of entering at the earlier pivot. Daily and weekly observations overlap, so agreement across them is not independent evidence.
Choose Consistent Data Across Markets and Timeframes
- Stocks: check the feed’s venue coverage, regular versus extended hours, and handling of corporate actions. Keep the same settings when comparing windows.
- Cryptocurrencies: identify the exchange, pair, and volume units. One venue’s ratio does not automatically describe the entire crypto market, and changing to crypto does not make the ratio cumulative.
- Spot forex: a feed may provide tick counts rather than centralized traded quantity. A ratio of tick counts describes that feed’s activity. Exchange-traded FX futures provide contract volume for the chosen futures instrument, which is a different market from spot.
- ETFs and indexes: ETFs have their own traded volume. A calculated cash index may lack directly comparable volume; do not silently substitute an ETF or futures proxy. ETF volume is not a direct measurement of fund flows.
- Intervals: ten daily bars, ten weekly bars, and ten fifteen-minute bars measure different windows. Weekly classification is not necessarily the aggregation of each day’s classification.
Use completed bars for a close-based decision. During an unfinished bar, both volume and the direction category can change. Holidays, partial sessions, missing data, and session boundaries deserve explicit treatment. Low activity does not itself prove a feed is inaccurate, but it can make a ratio less stable and execution more difficult.
Turn a Ratio Observation into a Trading Rule
Start with a price setup: for example, a completed close above resistance marked before the breakout. Then define the ratio condition, entry timing, stop, and exit. Compare the same price strategy with and without the volume filter rather than assuming that an additional indicator improves it.
A moving average can define trend context, while support and resistance can define location and invalidation. RSI describes price momentum. Give each tool a specific purpose; agreement among related indicators does not guarantee a better entry.
Size from Planned Risk
Do not increase size solely because a volume signal looks clearer. Choose the invalidation level and a risk budget first. For a hypothetical share entry at $42, stop at $40, risk budget of $150, and $0.10 per-share allowance for costs, size is floor($150 ÷ $2.10) = 71 shares, or $149.10 of planned risk.
Actual losses can exceed the estimate because of gaps or poor fills. Other instruments require the appropriate point value and contract size. Consider existing positions and available capital, following position-sizing principles. If an exit depends on missing volume confirmation, define the deadline before entering.
Analyze Volume on LuxAlgo’s Native Charts
LuxAlgo’s native Volume Delta and CVD provide a related footprint-based view. Add them from Indicators → Orderflow on a supported symbol and fixed-duration timeframe. Monthly chart intervals are unsupported, and data availability depends on the instrument and feed.
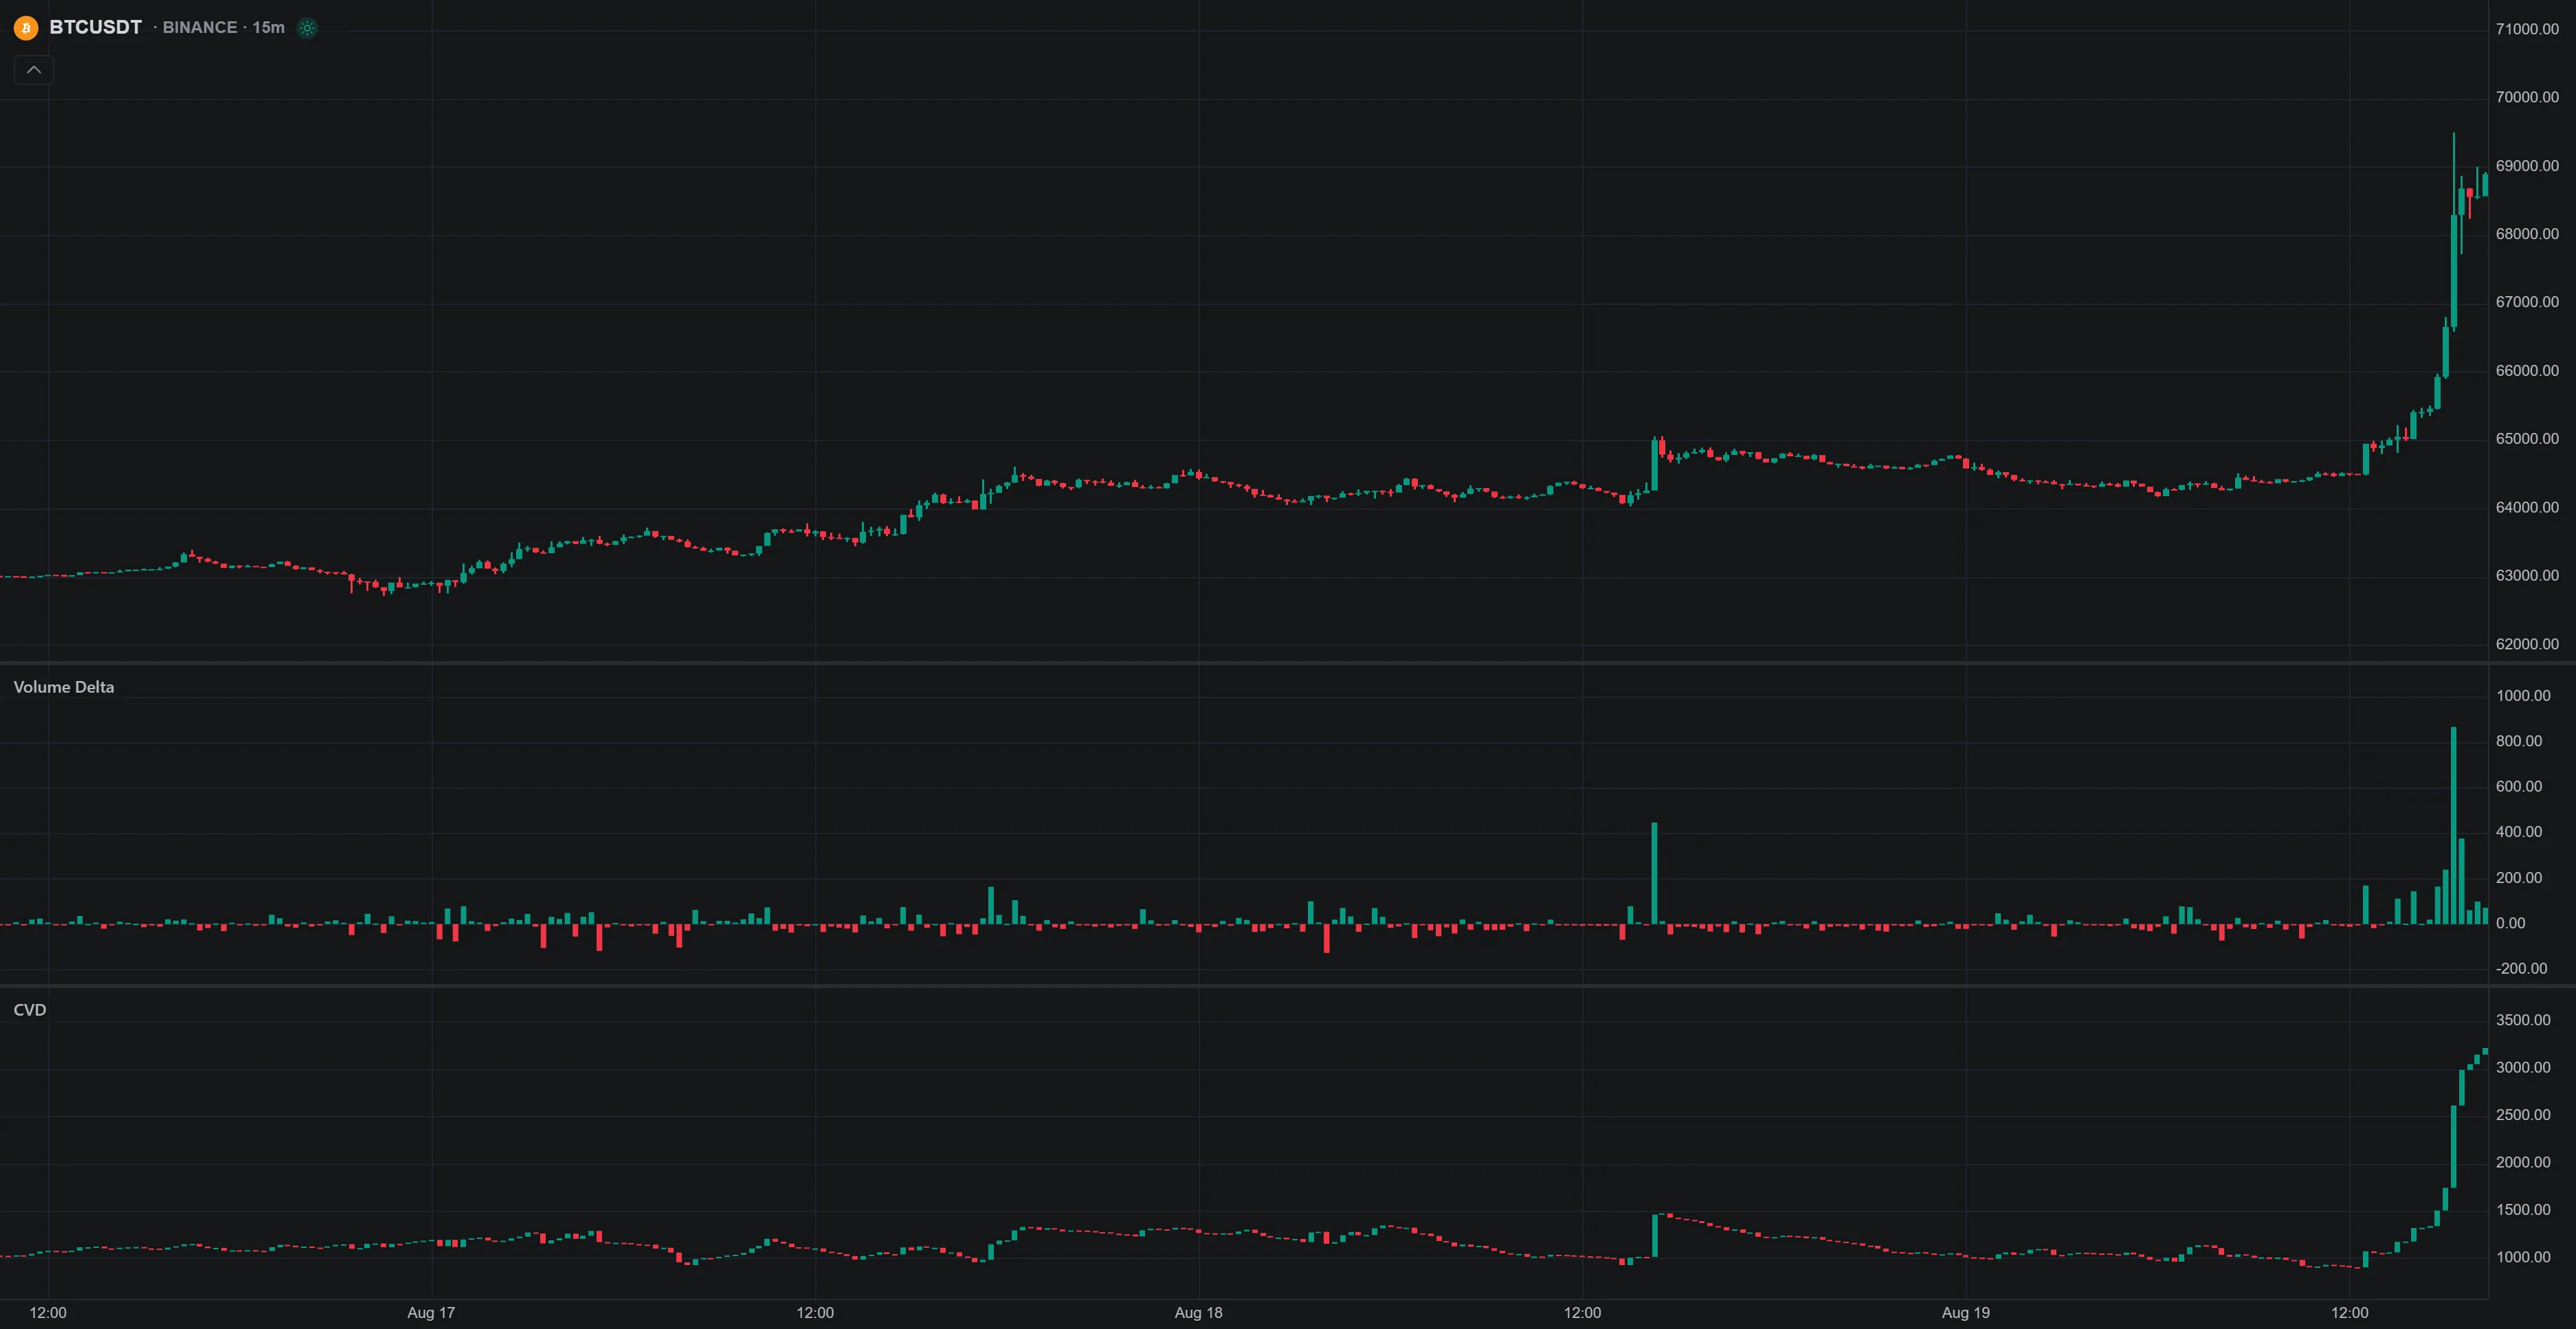
Total delta subtracts sell volume from buy volume; Average mode compares average trade size per side and requires trade counts. CVD accumulates deltas from its selected anchor. Keep those definitions separate from a rolling ratio of up-bar to down-bar volume.
Build and Test with Quant
- Specify the measure. Ask for the close-to-close ratio, including lookback, unchanged-close handling, zero-denominator behavior, smoothing, and any inversion.
- Specify the strategy. Include the price trigger, completed-bar timing, entry rule, stop, exit, and position sizing.
- Review the code and examples. Use Quant’s strategy workflow to build the implementation, then compare calculated values against a small hand-worked sample.
- Configure the test. Set capital, commission, slippage, and other relevant native strategy properties. Inspect trades, drawdown, and performance, not just whether the code runs.
- Reserve later data. Compare the price strategy with and without the ratio filter on data not used to choose the settings. Check sensitivity to nearby parameters and realistic costs.
A close-to-close calculation needs bar prices and volume. An intrabar or footprint calculation has additional data requirements; do not accept an undisclosed approximation if the requested inputs are unavailable. Quant-generated code still needs review, and parameter selection does not establish a durable trading edge.
Check each Library entry’s supported platform rather than assuming universal MetaTrader compatibility. Similarly, verify a screener or alert’s supported conditions before expecting an arbitrary ratio rule to work across a watchlist.
Video: Up/Down Volume Ratio Testing
This retained Academy of Forex tutorial demonstrates a TradingView ratio-testing example. Check its script settings and data source before comparing readings; the example is not a native LuxAlgo walkthrough or evidence of future profitability.
FAQs
How can I use the Up/Down Volume Indicator alongside other tools to improve my trading strategy?
Give each tool a defined role, such as a moving average for trend context or a premarked level for entry and invalidation. Test the same strategy with and without the volume condition, including costs and later validation data. Adding indicators does not automatically improve results.
What are the risks of relying only on the Up/Down Volume Indicator for trading decisions?
A ratio can change because an old bar leaves its window or its denominator becomes small. Unfinished bars, missing data, and different classification rules also affect readings. The indicator does not identify traders or guarantee direction; a complete strategy still needs entry, exit, sizing, and execution assumptions.
How does the Up/Down Volume Indicator work across different asset types like stocks, cryptocurrencies, and ETFs?
Apply the specified calculation to the selected instrument and feed, using consistent volume units and sessions. Crypto volume is venue-specific, ETFs have their own trading volume, and spot forex may supply tick counts. A cash index may require a clearly identified proxy. The ratio does not become cumulative merely because the asset class changes.
Read next