Using Fibonacci Levels to Time Retracements
Fibonacci retracements mark price levels within a selected swing; they do not predict when a reversal will happen. Their practical use is to organize a pullback hypothesis around explicit anchors, an entry condition and an exit rule. Price can cross every level without reversing.
This guide explains the ratios, how to draw the grid consistently, how to distinguish retracements from extension targets, and how to evaluate the resulting rules. The historical charts illustrate selected examples, not a measured success rate.
The Logic Behind Fibonacci Levels
The Fibonacci sequence is formed by adding the previous two terms. Ratios between increasingly large terms approach values related to the golden ratio, approximately 1.618. Its reciprocal is approximately 0.618; related values produce the familiar 23.6%, 38.2% and 78.6% chart references. The 50% midpoint is a trading convention, not a Fibonacci ratio.
Mathematical patterns in nature do not establish a causal law for market prices. Some traders watch these fractions, but that observation does not prove that reversals occur more often at one level or that a particular setup has an edge. The grid depends on the selected anchors, and different choices produce different prices.
Calculate the Retracement Before Interpreting It
For a swing low L and swing high H, let the range be H − L. After an upward leg, the retracement price is H − r × (H − L). After a downward leg, it is L + r × (H − L). Here r is the fraction retraced. These retracement calculations measure distance back from the end of the move.
| Retracement | Upward leg: 100 to 120 | Downward leg: 120 to 100 |
|---|---|---|
| 23.6% | 115.28 | 104.72 |
| 38.2% | 112.36 | 107.64 |
| 50% | 110.00 | 110.00 |
| 61.8% | 107.64 | 112.36 |
| 78.6% | 104.28 | 115.72 |
These hypothetical examples use a 20-point range. A 61.8% retracement of the advance gives back 12.36 points from 120, leaving 107.64. It is not 61.8% of the current asset price. With fixed anchors, the calculated prices stay fixed; moving an anchor changes every level.
How to Use the Grid in a Defined Setup
1. Choose Anchors with a Repeatable Rule
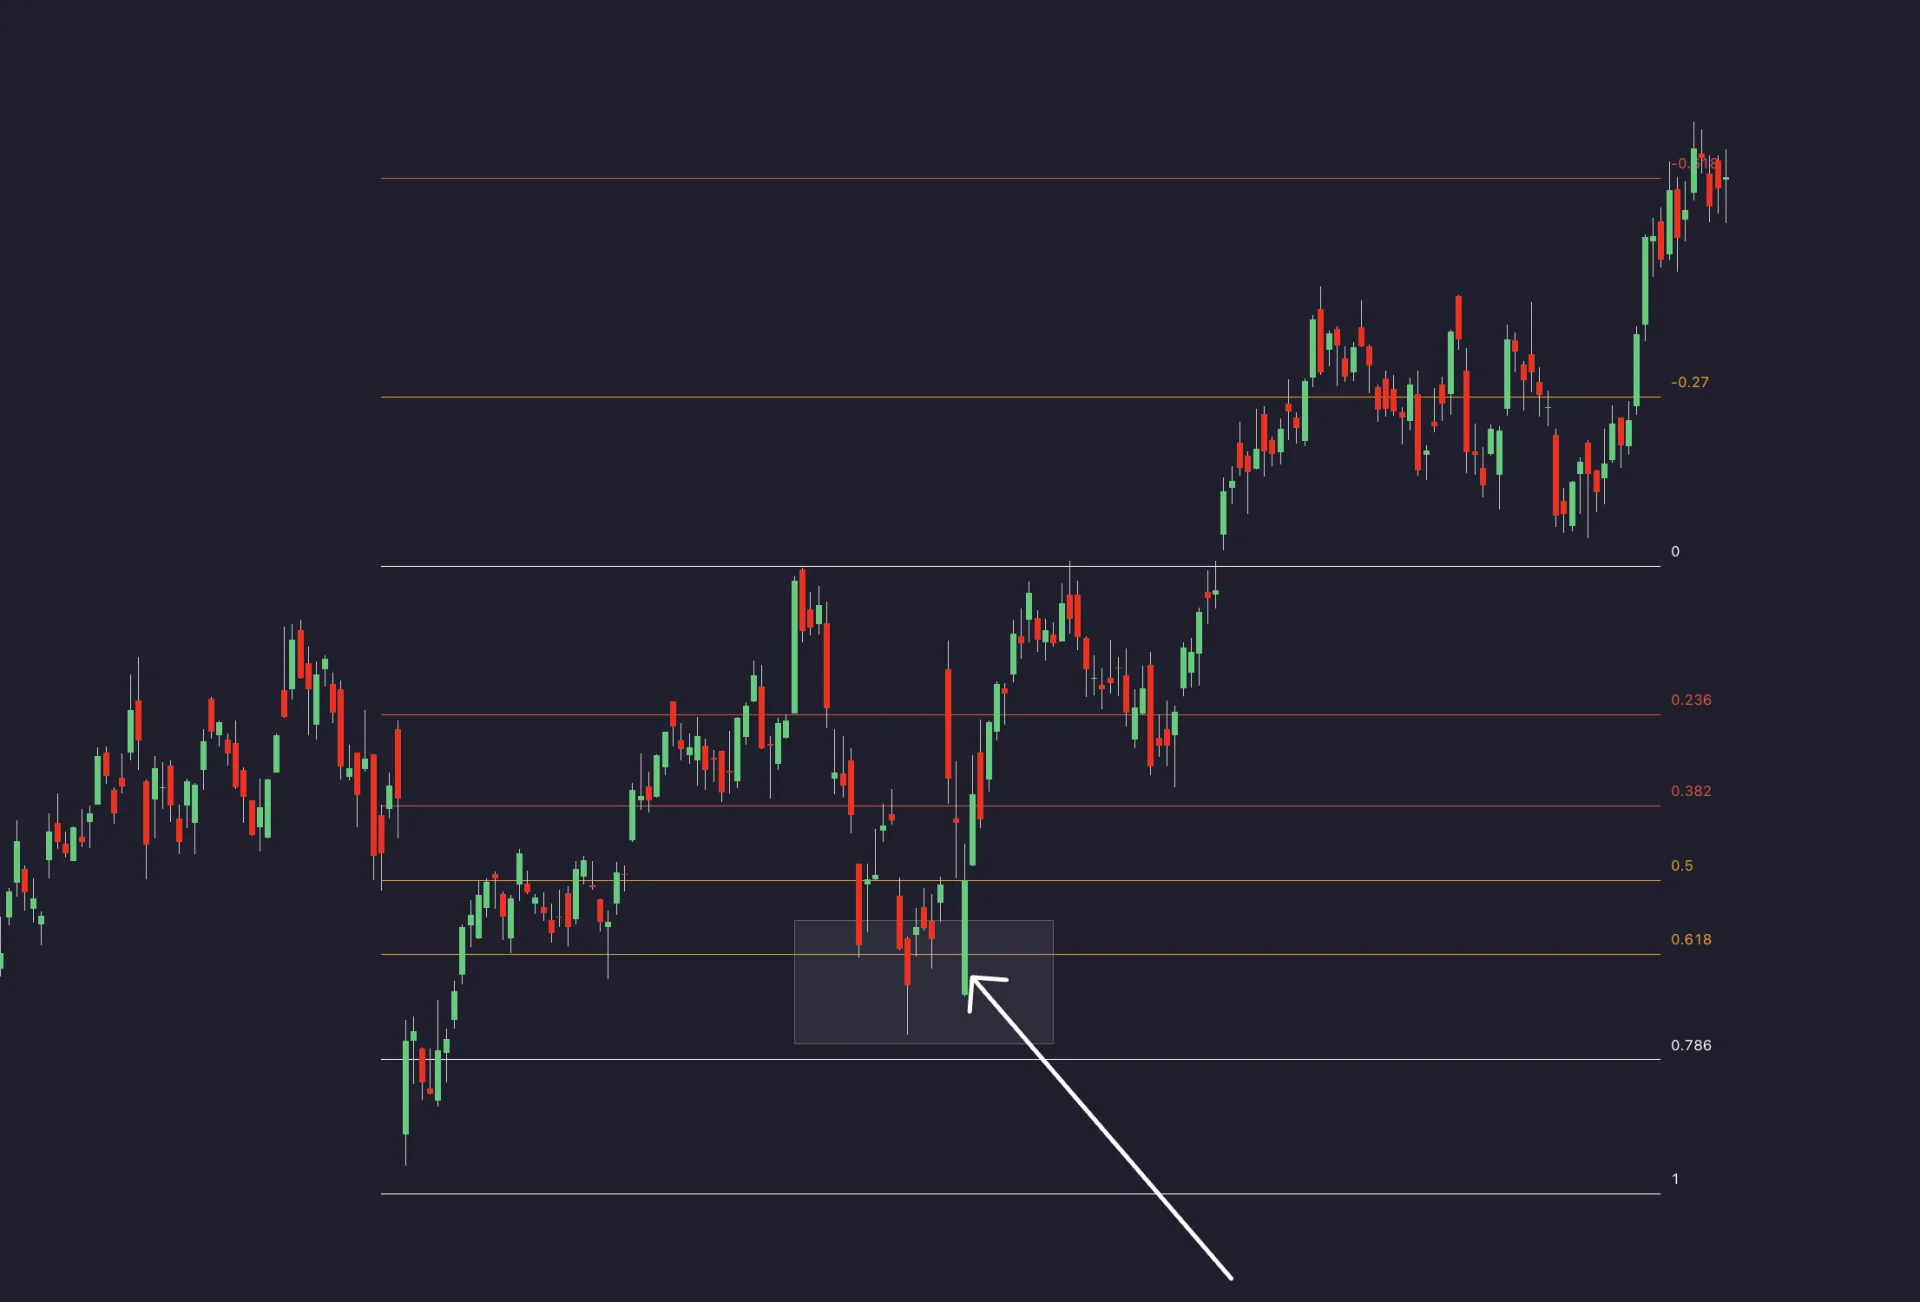
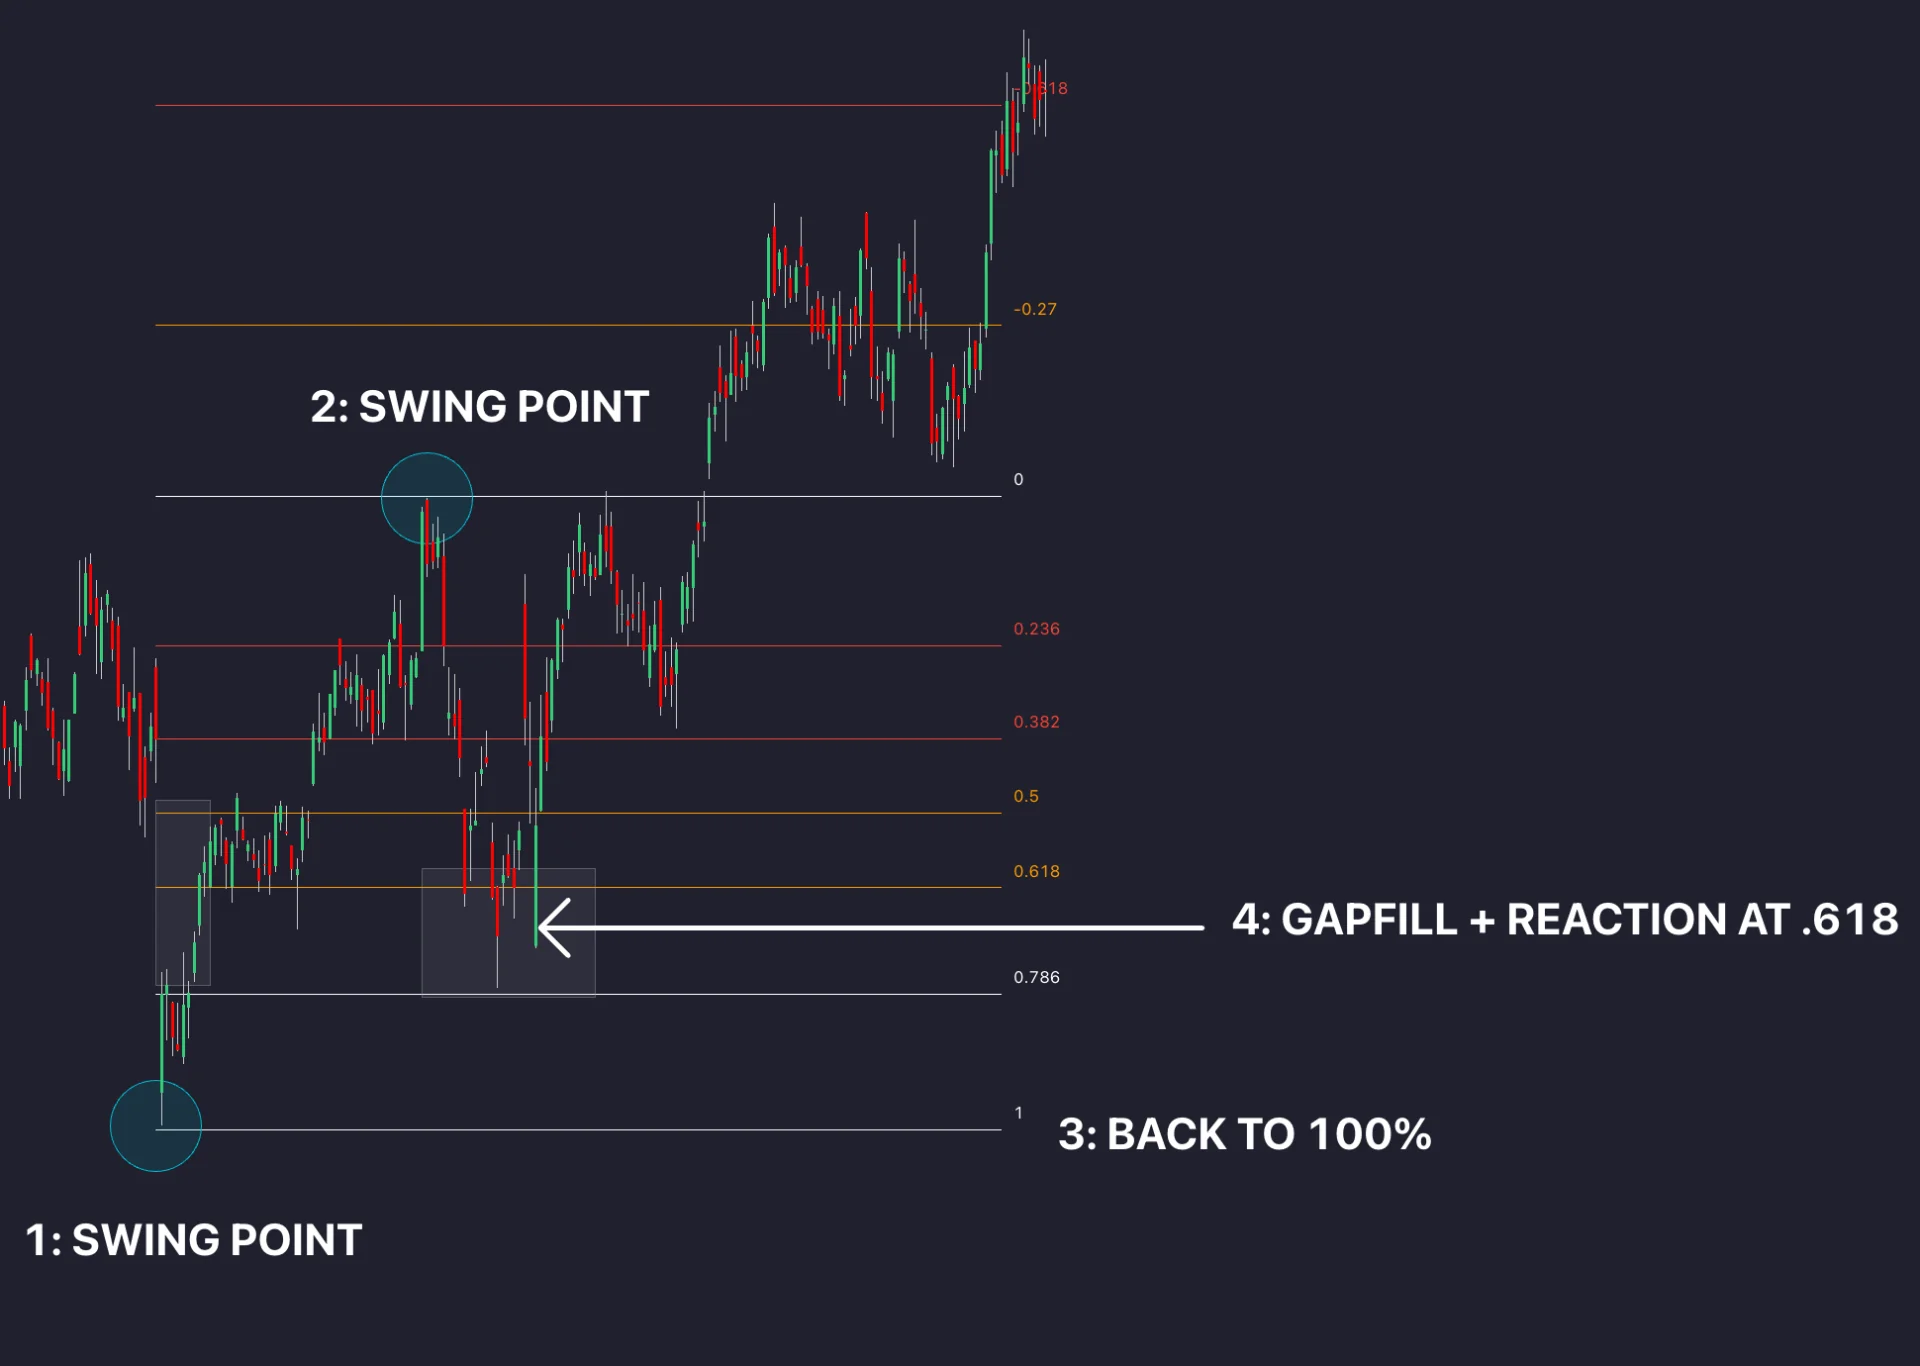
Select the start and end of the leg you intend to measure. For an upward leg, the usual drawing direction is low to high; for a downward leg, high to low. Choose wick extremes or body-based anchors consistently. Do not switch conventions simply because one makes an old trade look better.
Specify when a swing becomes usable. A pivot that requires later candles to confirm cannot be treated as known at its earlier plotted location. If a developing swing makes a new extreme, apply a predefined rule for updating or retiring the grid. Record the change instead of silently redrawing the past.
2. Check the Tool’s Label Direction
Many retracement tools display 0 at the end of the leg and 1 at its origin; reverse settings can swap the labels. Verify the actual price calculation. The 100% retracement is the return to the starting price, not a prediction that price must travel there.
3. Define the Reaction You Will Test
A touch of 61.8% is a location event. An entry could instead require a completed rejection candle, an engulfing pattern with explicit conditions, or a break of a specified local level. Those are different rules with different timing and fills. Name the candle interval, whether the bar must close, and the maximum time allowed for the setup.
Waiting for a trigger can exclude some trades and enter others later; it does not guarantee a reversal. Define the adverse exit, position size and target independently. A limit order at a level may not fill, and an exit order may execute worse than planned.
4. Treat Confluence as a Hypothesis
A retracement can overlap with prior support or resistance, a moving average, a trendline or a round number. Define the allowed distance for an overlap and evaluate it against the same setup without the extra condition. Several tools calculated from the same price history are not independent votes.
Daily and four-hour grids may share anchors or describe overlapping information. Use completed higher-timeframe observations and record which levels were available at the decision. A round price such as $100 may attract attention, but the chart alone does not reveal the identity or intentions of large participants.
Use Extensions as Candidate Targets
Retracements subdivide the measured leg. A two-anchor Fibonacci extension projects beyond its end. With start A, end B and extension multiplier e, the price is A + e × (B − A). Keeping the signed difference makes the formula work for both directions.
| Extension multiplier | Upward leg: A=100, B=120 | Downward leg: A=120, B=100 |
|---|---|---|
| 1.272 | 125.44 | 94.56 |
| 1.618 | 132.36 | 87.64 |
| 2.000 | 140.00 | 80.00 |
For the upward example, 1.618 lies 12.36 points beyond 120, not 32.36 points beyond it. A three-anchor projection instead transfers a multiple of A-to-B from a separate point C. Platform names vary, so verify whether the tool uses two or three anchors before comparing targets.
On a retracement grid with 0 at the high and 1 at the low, an upward extension can appear as a negative retracement value: −0.618 corresponds to the 1.618 extension of the original rise. The same price can therefore carry a different label under another convention.
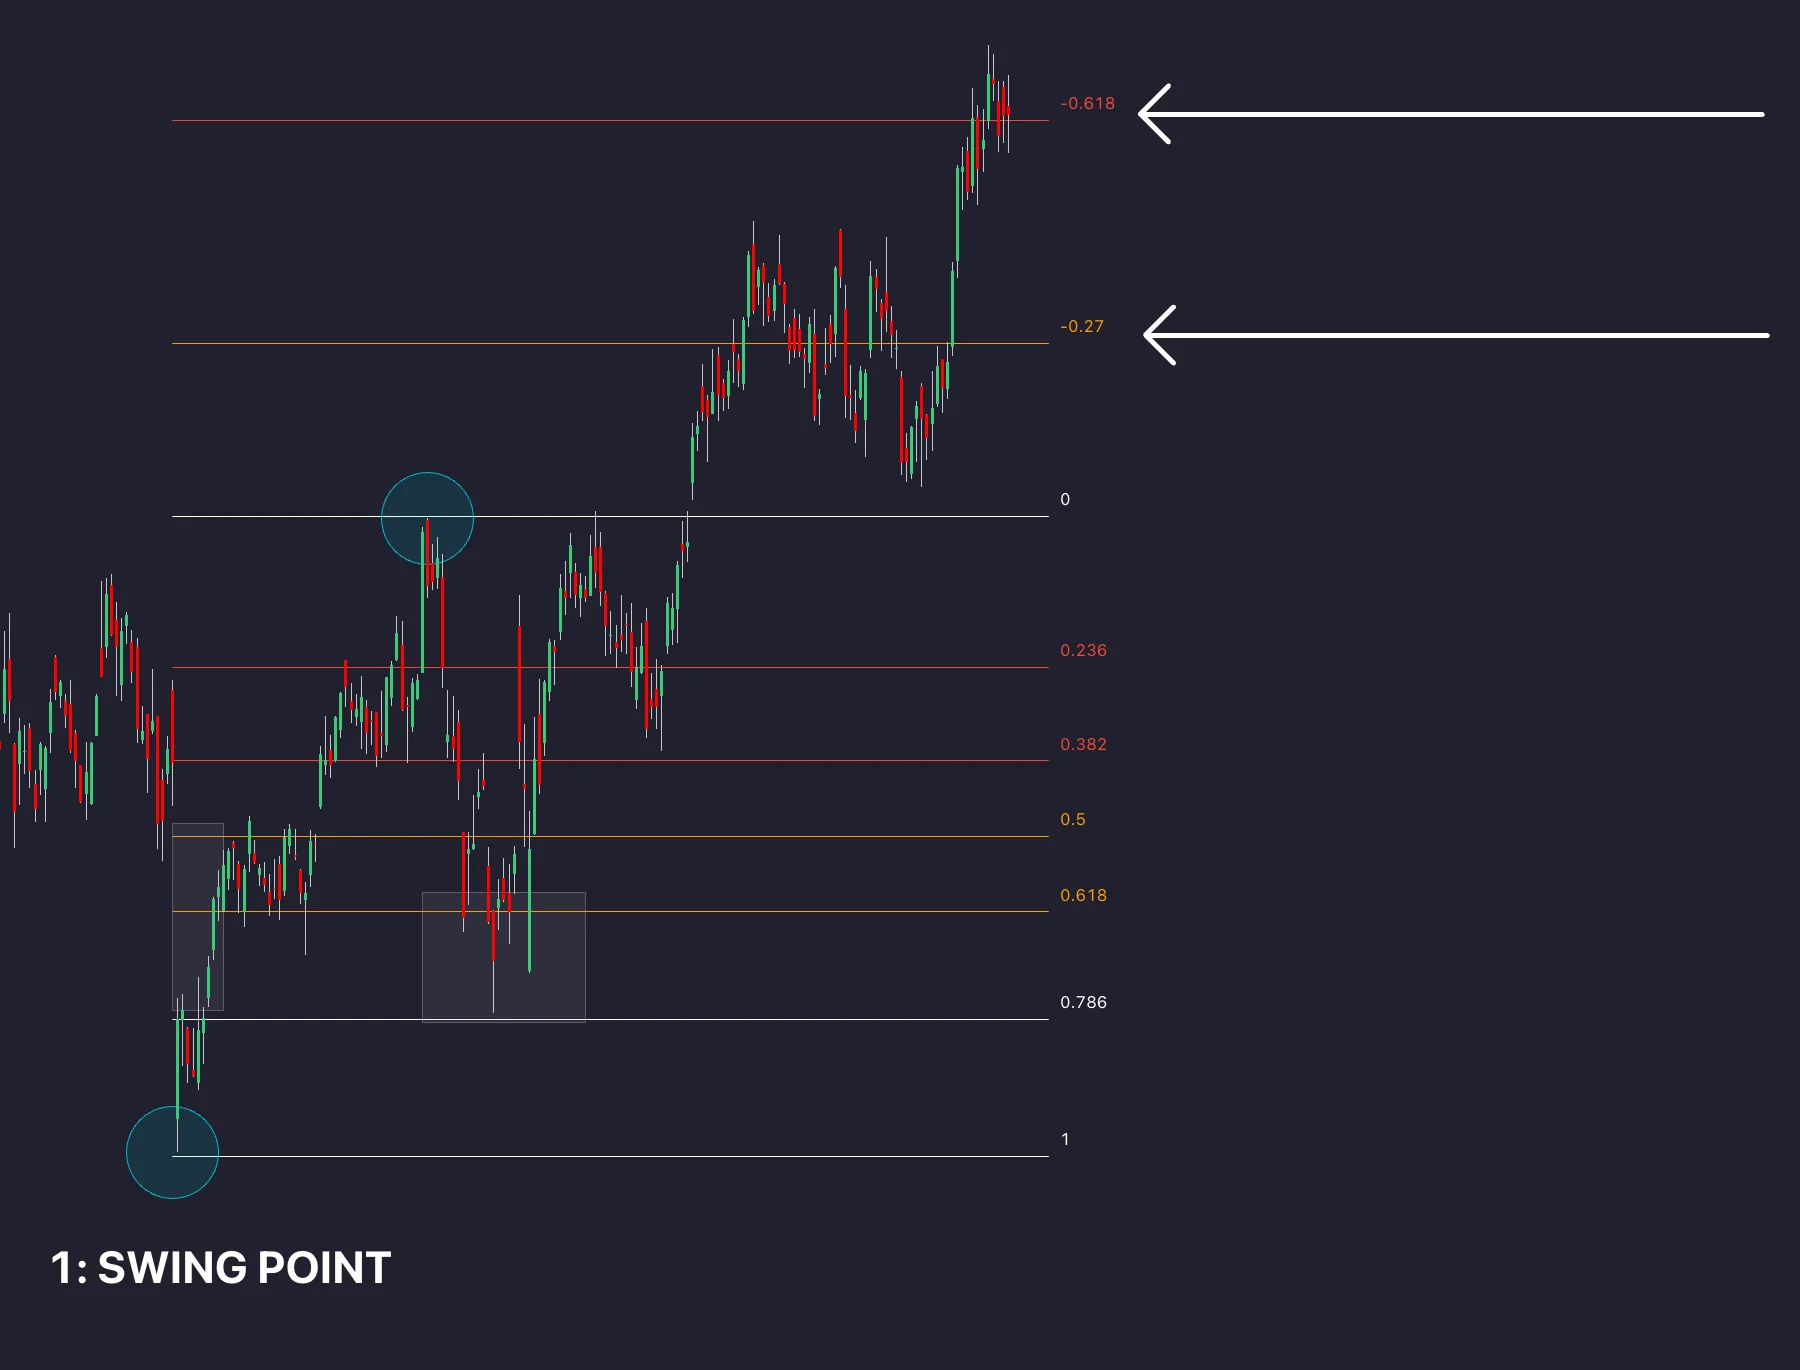
Targets can organize partial exits or a complete exit rule, but a level is not a guaranteed destination. Evaluate the planned reward against the adverse distance, fees and slippage. A visually attractive target can still produce poor results if the losses, missed fills or holding costs outweigh the winners.
Practical Limits and Common Mistakes
- Forcing anchors: choosing many alternative swings until one explains a reversal fits the past. Fix the selection rule before evaluating results.
- Assuming a trend guarantees a reaction: a clear leg makes the grid easier to define, but does not make its levels reliable barriers.
- Favoring 61.8% without evidence: 38.2%, 50% and other fractions are alternative hypotheses. The mathematical origin of a percentage does not rank its trading performance.
- Confusing price with time: ordinary retracement levels provide prices, not dates or countdowns. Fibonacci time tools are a separate construction.
- Ignoring failed examples: include setups that cross the levels, never trigger, miss an entry or reach the adverse exit.
- Moving the risk rule: widening an exit after entry to reach the next Fibonacci level changes the original loss exposure.
Research the Rules in LuxAlgo’s Native Platform
Use the current Library and native charts to inspect supported Fibonacci implementations. Record the market, source, interval, anchors and update rule. Check native data coverage before assuming the same history or analytics are available for every symbol.
Ask Quant, our coding agent to express a supported strategy hypothesis with explicit anchor confirmation, entry timing, exits and costs. Inspect the generated code and run it manually. Review strategy settings and individual trades on standard candle prices, then evaluate unchanged rules on later data not used for tuning.
Frequently Asked Questions
Do Fibonacci levels predict when price will reverse?
No. Retracement levels calculate price references within a selected swing. Timing requires a separate rule, and price may not reverse at any level.
Is 50% a Fibonacci ratio?
No. It is a conventional halfway-back level often included alongside Fibonacci-derived ratios.
Why do two traders get different Fibonacci prices?
They may choose different swing anchors, wick or body conventions, intervals or tool settings. Each choice can change the resulting grid.
Does more confluence guarantee a better trade?
No. Overlapping tools can reuse the same information. Evaluate the additional condition with fixed rules and later data after costs.
Is a 1.618 extension the same as a 61.8% retracement?
No. A retracement measures a pullback within the leg. A two-anchor 1.618 extension projects 0.618 of the leg’s length beyond its end; tool labels can use different conventions.
Read next