Volatility Smile vs. Skew: Key Differences
A volatility smile describes curvature in implied volatility across strikes; volatility skew describes asymmetry or slope. Compare options on the same underlying, with the same expiration and quote timestamp. A curve can have both a smile and a skew—it need not belong to one exclusive category.
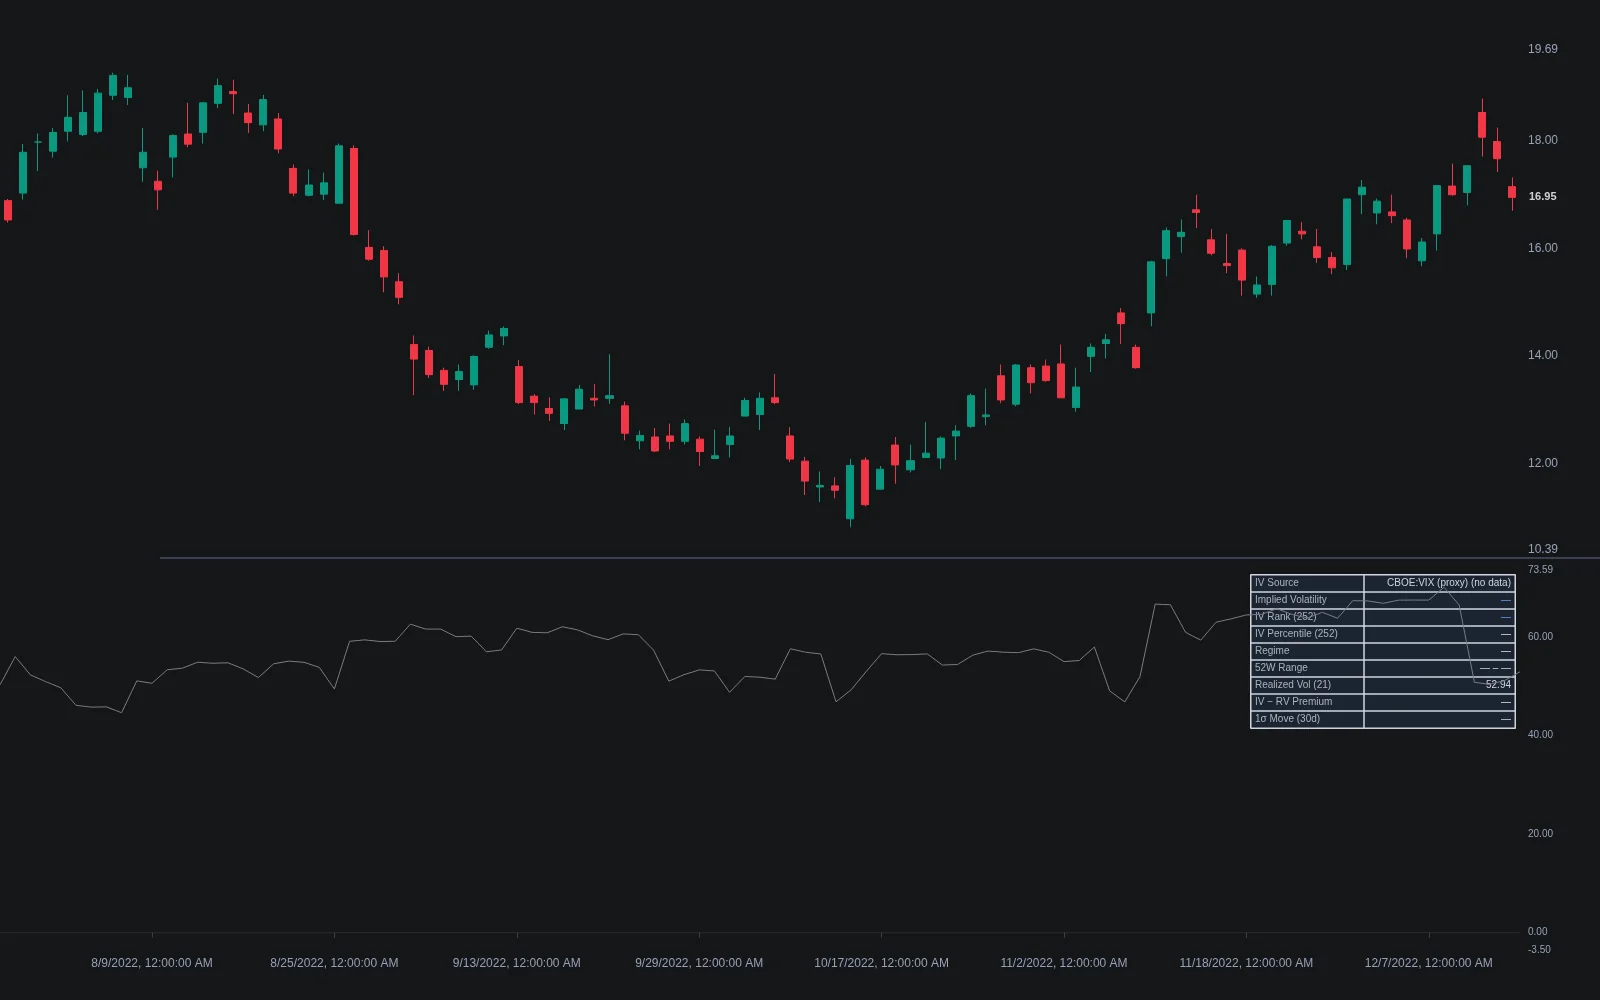
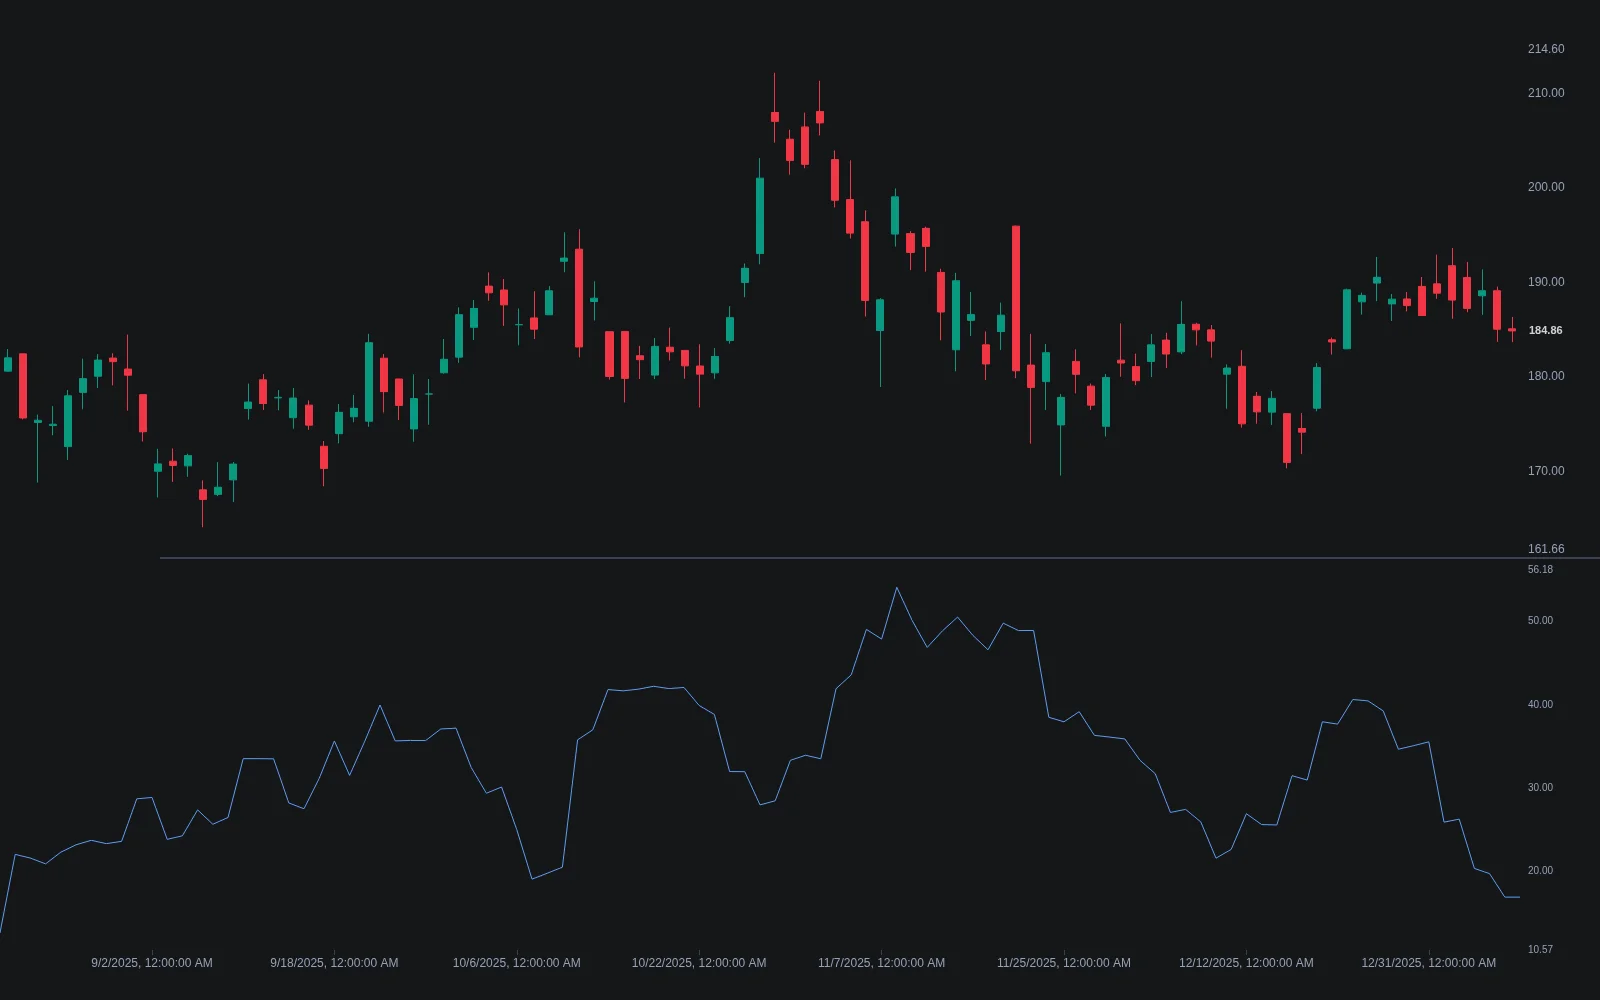
These patterns describe option pricing, not a guaranteed direction for the underlying. Use LuxAlgo’s native charts to study the underlying market and Quant, our coding agent, to help explore clearly specified price-based rules. Measuring an options smile itself requires suitable options quotes and a consistent pricing model; an ordinary underlying-price chart is not an implied-volatility surface.
What Is a Volatility Smile?
Implied volatility (IV) is the volatility input that makes a chosen option-pricing model match an observed option price, given its other inputs. A smile occurs when IV is higher at lower and higher strikes than around the center. It need not be perfectly symmetrical.
For an underlying near 100, a low-strike put and a high-strike call are out of the money. Describing the two wings this way is clearer than saying “ITM versus OTM” without specifying whether the option is a call or put. At the same strike, call and put moneyness are opposite.
The Options Industry Council’s overview distinguishes elevated wings in a smile from an uneven smirk and discusses supply and demand. Do not interpret a symmetrical-looking curve as equal real-world probabilities of upward and downward moves.
What Is Volatility Skew?
Using an increasing-strike horizontal axis, a downward-sloping IV curve has higher IV at lower strikes. This is often called negative or reverse skew. An upward-sloping curve has higher IV at higher strikes. Always state the axis convention: charts using delta or a different moneyness convention can look different.
Downside protection demand can contribute to elevated low-strike put IV, but skew also reflects pricing, risk compensation and market conditions. It is not a direct forecast that the underlying will fall. Similarly, high call-wing IV does not by itself prove optimism or predict a rally.
Compare Smile and Skew with the Same Inputs
| Feature | Smile | Skew |
|---|---|---|
| Main feature | Both wings elevated relative to the center | One side elevated relative to the other |
| Symmetry | May be roughly symmetric or tilted | Describes asymmetry under a stated convention |
| Useful question | How does IV vary away from the center? | How different are comparable points on opposite wings? |
| Common mistake | Reading the curve as equal physical probabilities | Reading its slope as a certain price-direction signal |
Here is a deliberately simplified numerical illustration for one expiration. These are invented IV inputs for explaining shapes, not observed prices or a calibrated, arbitrage-checked surface.
| Strike | Illustrative smile IV | Illustrative tilted curve IV |
|---|---|---|
| 80 | 32% | 38% |
| 90 | 25% | 30% |
| 100 | 22% | 24% |
| 110 | 25% | 22% |
| 120 | 32% | 23% |
The first example has equal wing values at the listed strikes. The second has a much higher low-strike wing and a slight rise at the far right. Changing expiration creates another curve; combining strike and maturity dimensions produces a volatility surface. Do not mix maturities and call the resulting line a single-expiration smile.
What the Curves Can and Cannot Tell You
IV summarizes option prices through a model. Historical or realized volatility summarizes past underlying returns. They answer different questions, so an ATR reading or historical-volatility indicator cannot substitute for strike-specific IV.
A flat Black–Scholes IV curve does not prove that actual returns are normally distributed. Under the standard constant-volatility model, log returns are normal and terminal prices are lognormal. Market-implied pricing distributions also differ from real-world outcome probabilities because prices incorporate risk compensation and other influences.
A steeper curve can accompany changing demand or risk pricing, but its meaning depends on the instrument, expiry, event calendar and quote quality. Avoid universal claims that equities always have one shape or commodities another. Compare like-for-like snapshots before attributing a change to sentiment.
Check the Data Before Interpreting the Shape
- Synchronize quotes: Use the same underlying and option timestamp. Stale option prices paired with a fresh underlying price can distort IV.
- Inspect bid and ask: A midpoint is an estimate, not a guaranteed fill. Wide spreads can create a misleadingly precise curve.
- Keep model assumptions consistent: Account for exercise style, rates, dividends, settlement and contract specifications.
- Define the comparison: Fixed strikes, forward moneyness and fixed-delta points are different measurements. State which you use.
- Handle unreliable points: Very little extrinsic value or poor liquidity can make IV estimates unstable. Do not force every quote into a smooth interpretation.
- Separate levels from shape: All strikes can move higher in IV while the difference between the wings narrows.
Higher IV Is Not Automatically a Bargain to Sell
Comparing IV is not the same as comparing dollar premiums or expected returns. Strike, time remaining and option sensitivities matter. Selling an option with higher IV can still expose you to losses that overwhelm the premium received.
Consider the short ratio put spread described by the Options Industry Council: buy one higher-strike put and sell two lower-strike puts with the same expiration. It combines a put spread with an additional short put, leaving substantial downside exposure. Assignment and margin requirements matter as well as the expiration payoff.
For independent arithmetic, suppose the strikes are 100 and 90 and the hypothetical net premium is zero. Per underlying unit, expiration payoff is max(100 − S, 0) − 2 × max(90 − S, 0), where S is the expiration price. At S = 90, payoff is +10; at 80 it is zero; at 60 it is −20; at zero it is −80. With a 100-unit contract multiplier, the last result is −$8,000 before fees. Zero premium is an illustrative assumption, not an available quote.
This explains why buying one put and selling two is not simply a way to collect “expensive” volatility safely. For a nonnegative stock price the loss is finite but can be substantial. Before expiration, changing prices, IV and exercise events can produce a different position value and cash-flow path.
Watch an Options-Skew Explanation
The OIC webinar discusses smile, positive and negative skew around 24:20, with measurement discussed later. Use it as additional education alongside the contract and risk review.
Use LuxAlgo for the Underlying Research
On native LuxAlgo charts, study the underlying’s price behavior and define the hypothesis you want to test. Quant can help turn explicit entry and exit rules into a script; review the code and simulated trades before relying on results. A price-based backtest does not establish the historical performance of a multi-leg options position.
An options backtest additionally needs historical contract quotes, expiration and strike selection, fills, contract multipliers, exercise and assignment handling, and appropriate valuation assumptions. Verify that those inputs are available rather than assuming an underlying-chart strategy includes them.
Use the smile or skew to frame a pricing question, then evaluate the entire position. The curve’s shape is a starting point for analysis, not a standalone reason to buy or sell an option.
FAQs
What is the difference between volatility smile and volatility skew?
A smile describes elevated implied volatility on both wings relative to the center, while skew describes asymmetry across strikes under a stated axis convention. A curve can display both. Compare the same underlying, expiration and quote timestamp.
Why do traders use volatility smiles for pricing options?
They show how market-implied volatility varies across strikes, helping traders compare and model option prices. The shape does not directly establish real-world probabilities or a profitable trade; quote quality, model assumptions and position risk still matter.
Read next