Volume Profile Map: Where Smart Money Trades
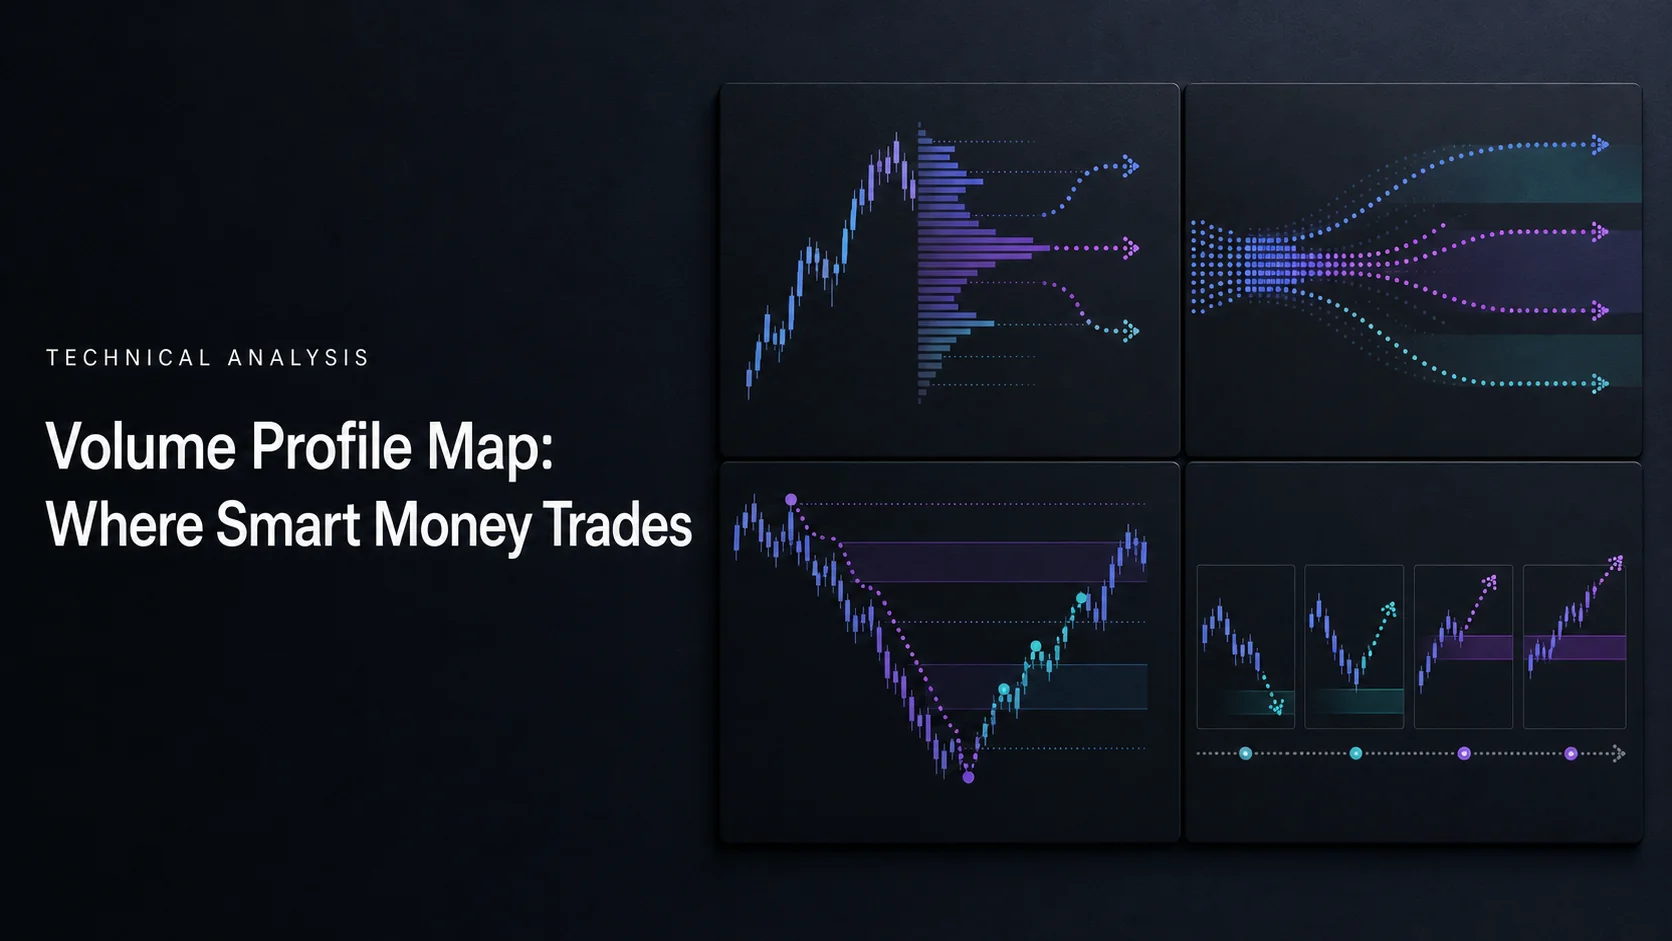
A Volume Profile map shows where trading activity occurred across price levels. It does not identify who traded or reveal institutional intentions. “Smart money” is a common description of large, informed participants, but a busy price zone alone cannot establish that those participants are accumulating or distributing a position.
Use the profile to map potential support, resistance, and areas of prior acceptance. On LuxAlgo’s native charts, combine that map with price behavior, then use Quant to turn a clearly specified idea into a testable strategy. The aim is a repeatable process for entries, exits, and risk—not a claim that every volume node predicts the next move.
Volume Profile Key Elements
Ordinary volume bars organize activity by time. A profile organizes activity by price across a selected window. Its shape depends on the data, session, range, and number of price rows. Compare profiles only after checking those settings.
| Element | Meaning | How to use it |
|---|---|---|
| Point of Control (POC) | The row with the most volume in the selected profile | Mark a reference zone and observe the next price reaction |
| Value Area (VA) | A range containing a chosen share of profile volume | Use its upper and lower boundaries, VAH and VAL, to frame a setup |
| High Volume Node (HVN) | A local concentration of historical volume | Investigate prior acceptance or consolidation |
| Low Volume Node (LVN) | A local valley in historical volume | Plan for either rejection or movement through the region |
A value area commonly uses 70%, but the percentage is configurable. It is not automatically one standard deviation, a measure of fundamental fair value, or a 70% probability that future prices will remain inside it. Profile row sizes and calculation methods can also change the boundaries. See TradingView’s profile definitions and methodology.
Read the POC in Context
A POC above current price is a potential overhead reference; it does not establish bearish sentiment by itself. A POC below price is a possible support reference, not proof of a bullish trend. Price near the POC may trade back and forth, reject it, or move through it.
Specify what would count as a reaction before entering. For example, a completed candle closing back above a premarked POC after testing below it is more precise than “smart money is buying.” Whether that trigger has value still requires testing.
Build a Volume Profile Map on LuxAlgo
Add native profiles through Indicators → Orderflow. Session covers a chosen session, Rolling covers the latest number of bars, and Visible Range changes as you pan or zoom. Session and Rolling require footprint data; Visible Range uses candle volume. Its up/down colors describe bar direction, not buy/sell aggressor volume.

Session settings include Day, Week, or Month, with trading-hour choices for daily sessions. POC, VAH, and VAL provide reference levels; developing traces show how session levels changed. Review the Volume Profiles documentation and symbol data coverage before selecting a setup.
Elsewhere, fixed-range tools let traders choose a particular historical interval, while candle footprints inspect activity within individual bars. These are different views, not interchangeable names for every native profile. Volume Profile Maps is also a separate Library indicator; check its own implementation rather than assuming it matches the native tool.
Choose the Window Before Reading the Signal
- Choose the question. Are you studying the prior session, a recent consolidation, or an entire swing?
- Fix the inputs. Record symbol, venue, interval, session, row count, and value-area percentage.
- Mark relevant zones. Start with POC, VAH, VAL, and the clearest nodes rather than drawing every small fluctuation.
- Wait for a defined reaction. Record the close, rejection, or retest required by the strategy.
- Keep timing honest. A completed session’s final profile was not available at the beginning of that session.
Scrolling until an attractive level appears can change a Visible Range profile. Save the intended window before evaluating the setup, especially when comparing historical examples.
What Volume Can Tell You About Smart Money
Volume Clusters Show Activity, Not Identity
A dense cluster tells you many units traded in that price region within the selected data. It cannot tell you whether one institution, many smaller traders, market makers, or several opposing strategies produced the activity.
High volume with rising price can accompany an advance; high volume with falling price can accompany a decline. Neither combination alone proves accumulation or distribution. A tight, high-volume range may reflect two-way trading, and its eventual resolution can occur in either direction.
Use “acceptance” as a description of sustained historical trading, not a claim that all participants agree about value. Likewise, an LVN records little past activity in that window; it is not a measurement of the current order book or evidence that institutions are absent.
Delta and Footprints Add a Different View
Volume Delta compares reported buy and sell volume under the data provider’s classification. Positive delta indicates more buy-side volume under that method; negative delta indicates more sell-side volume. Every executed trade still has a buyer and seller.
A footprint can help examine where that activity occurred within a bar. Price stalling despite positive delta may be a reason to investigate a failed advance, but it does not prove manipulation, reveal an institution’s inventory, or guarantee a reversal. Check data coverage and distinguish aggressor classifications from candle-direction estimates.
Volume Profile Trading Methods
The following are hypotheses to define and test. A profile level is a location for evaluating a setup, not an automatic order instruction.
| Setup | Candidate trigger | Failure condition to define |
|---|---|---|
| Value-area range trade | Price tests VAL and closes back inside the range, or tests VAH and rejects lower | Acceptance outside the range or a break of the chosen structural stop |
| Value-area breakout | A completed close outside VAH or VAL, optionally followed by a retest | Return through the specified invalidation level |
| LVN transition | A defined break and continuation through a low-volume region | Rejection back into the previous region |
| POC rejection or continuation | A retest of a previously marked POC followed by the required price response | Loss of the structure supporting the trade |
Value-Area and Low-Volume Setups
For a range strategy, wait for the chosen rejection rather than buying every VAL touch or selling every VAH touch. For a breakout strategy, decide whether entry requires a close outside value, a retest, or another observable condition. Those choices change trade frequency and entry price.
Volume can be an additional filter, but “a surge” needs a baseline. Compare completed bars with a defined historical sample; intraday comparisons should account for time-of-day effects. High activity does not guarantee continuation, and low activity does not automatically invalidate a move.
A Hypothetical POC Retest
Suppose a completed profile has a POC around $100. Price moves above it, returns, and meets a predefined long trigger at $101. A structural stop is $99 and a possible target is $105. The gross target distance is $4 against a $2 stop distance, or 2:1 before costs.
This is an illustrative setup, not a historical trade or evidence of institutional positioning. A POC touch without the required reaction is not the same signal, and the next trade can still lose.
Control Risk Before Entering
Place the stop where the trade idea is invalidated, allowing for the instrument’s ordinary movement and execution conditions. Do not assume a stop just outside value is always sufficient, or that an HVN will protect the order.
For the hypothetical trade above, a $200 risk budget and an estimated $0.10 per share in combined trading costs gives a position of floor($200 ÷ $2.10) = 95 shares. Planned risk is $199.50. If the stop must instead sit at $98, the same budget supports 64 shares at an estimated $3.10 risk each, or $198.40.
This calculation assumes shares, the stated entry and stop, and the cost estimate. Futures and other instruments require their point value and contract specifications. Follow position-sizing principles, account for other open exposure, and remember that gaps or slippage can produce larger losses. A stop price is not a guaranteed execution price, as explained in the SEC’s stop-order guidance.
Video: Stop Placement Around Profile Levels
Trader Dale’s tutorial illustrates a profile-based approach to stop placement. Treat it as an educational example to evaluate alongside your own entry, sizing, and execution rules.
Test the Rules with Quant and Add Context Carefully
Ask Quant to implement the profile window, level calculation, entry trigger, stop, target, and sizing rule explicitly. Confirm that the required data and profile calculations are accessible to the script; a visual chart feature does not guarantee identical strategy access. Review the code and trades before relying on results.
A useful test compares the same price setup with and without the profile condition. Include commission and slippage in native strategy settings, inspect drawdown and individual trades, and reserve later data for validation. Avoid using a session’s final levels to generate earlier entries. Changing parameters until every historical reversal is captured is not evidence of a durable edge.
For related planning, see stop-loss placement using Volume Profile and volume-based support and resistance. Keep the map, trigger, and risk rule separate so each decision can be reviewed.
FAQs
How does the Volume Profile help identify where institutional traders are active?
It identifies price regions with concentrated trading activity, but cannot identify the traders or their intentions. Use those regions as historical context for a defined setup rather than proof of institutional accumulation or distribution.
What do High Volume Nodes (HVNs) and Low Volume Nodes (LVNs) reveal about market trends?
HVNs are concentrations of historical volume; LVNs are valleys in that distribution. They help map prior acceptance and possible transition zones, but neither guarantees a reversal or continuation, and an LVN does not measure current order-book liquidity.
How can I use the Point of Control (POC) to improve my trading decisions?
Mark the highest-volume row in a specified profile, then define the price reaction needed for an entry and the level that invalidates it. Keep the profile window fixed, size the position from the stop distance, and test the rule with costs before relying on it.
Read next