W Bottoms & Tops: Clear Market Signal Guide
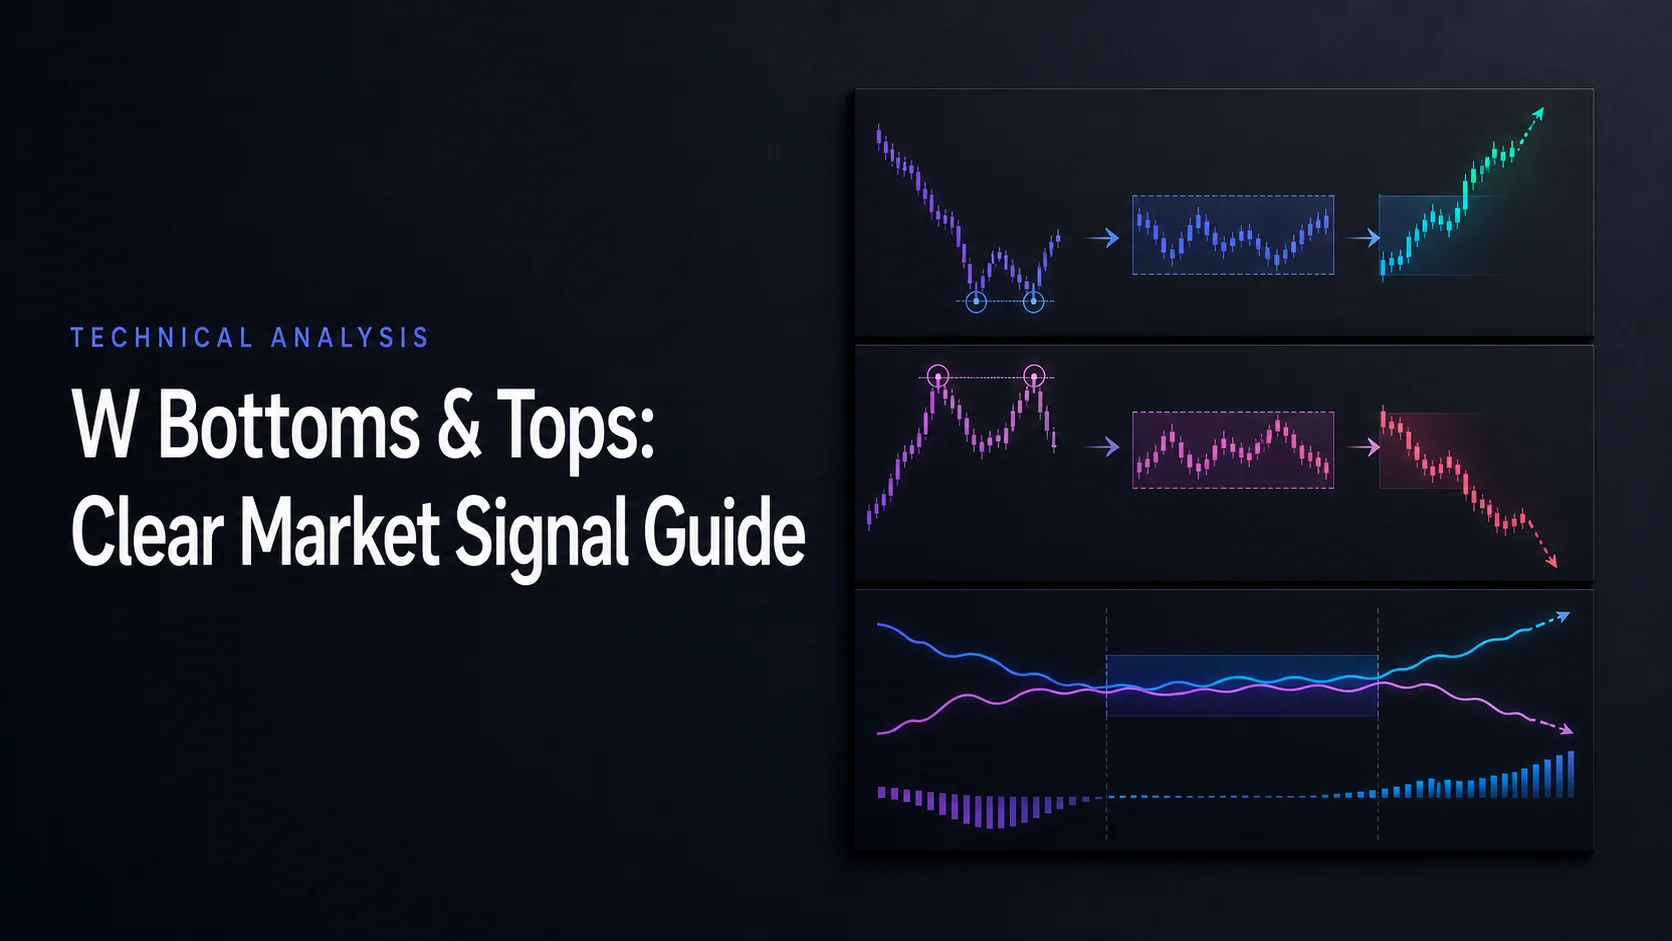
A W bottom is a potential bullish double-bottom reversal; its bearish counterpart is an M top, or double top. Two similar troughs or peaks create a candidate formation. A break of the intervening reaction level supplies the conventional confirmation, but it does not guarantee a profitable reversal.
This guide uses W bottom and M top to keep the shapes clear. Start in native LuxAlgo charts, define the geometry and timing, then use Quant, our coding agent, to implement complete strategy rules. Inspect the generated code and run it manually before judging the results.
Understand the Two Pattern Structures
A reversal requires a prior trend to reverse. In a downtrend, a W bottom consists of a first low, a reaction high and a second low near the first. The reaction high is the neckline resistance. In an uptrend, an M top consists of a first high, a reaction low and a second high near the first; the reaction low is neckline support.
| Component | W bottom | M top |
|---|---|---|
| Prior context | A decline before the first trough | An advance before the first peak |
| Candidate shape | Low → reaction high → similar low | High → reaction low → similar high |
| Neckline | Highest reaction price between the troughs under the chosen rule | Lowest reaction price between the peaks under the chosen rule |
| Conventional completion | Price breaks above neckline resistance | Price breaks below neckline support |
| Opposite-side reference | The trough zone | The peak zone |
The second trough does not confirm a bullish breakout by itself, and the second peak does not confirm a bearish breakdown. Price can remain in a range, develop another test, or continue the original trend. Similar prices need not be exactly equal, but your tolerance must be explicit.
For a hypothetical percentage rule, compare abs(second low − first low) ÷ first low × 100. Lows of 100 and 101 differ by 1%. A 1% threshold accepts that pair; a 0.5% threshold rejects it. A fixed tick distance or an ATR-based tolerance is a different specification. Choose one method and its measurement time instead of changing it to fit each chart.
Set the minimum separation, maximum formation age, required reaction depth and swing-identification method as well. A trough that develops a day later is a different research object from one separated by several months. Neither elapsed time nor visual symmetry establishes a success rate.
The StockCharts double-bottom reference and double-top reference describe classical intermediate- to long-term formations. Their recognition guidelines are conventions, not universal optimized settings for every instrument and interval. Also distinguish these bar-chart reversals from similarly named Point & Figure breakouts or breakdowns, which use different constructions.
See the Shape and the Breakout
Identify the two troughs and their intervening high before looking at the later advance. The historical chart below illustrates the sequence; it is one selected example, not a representative performance sample.
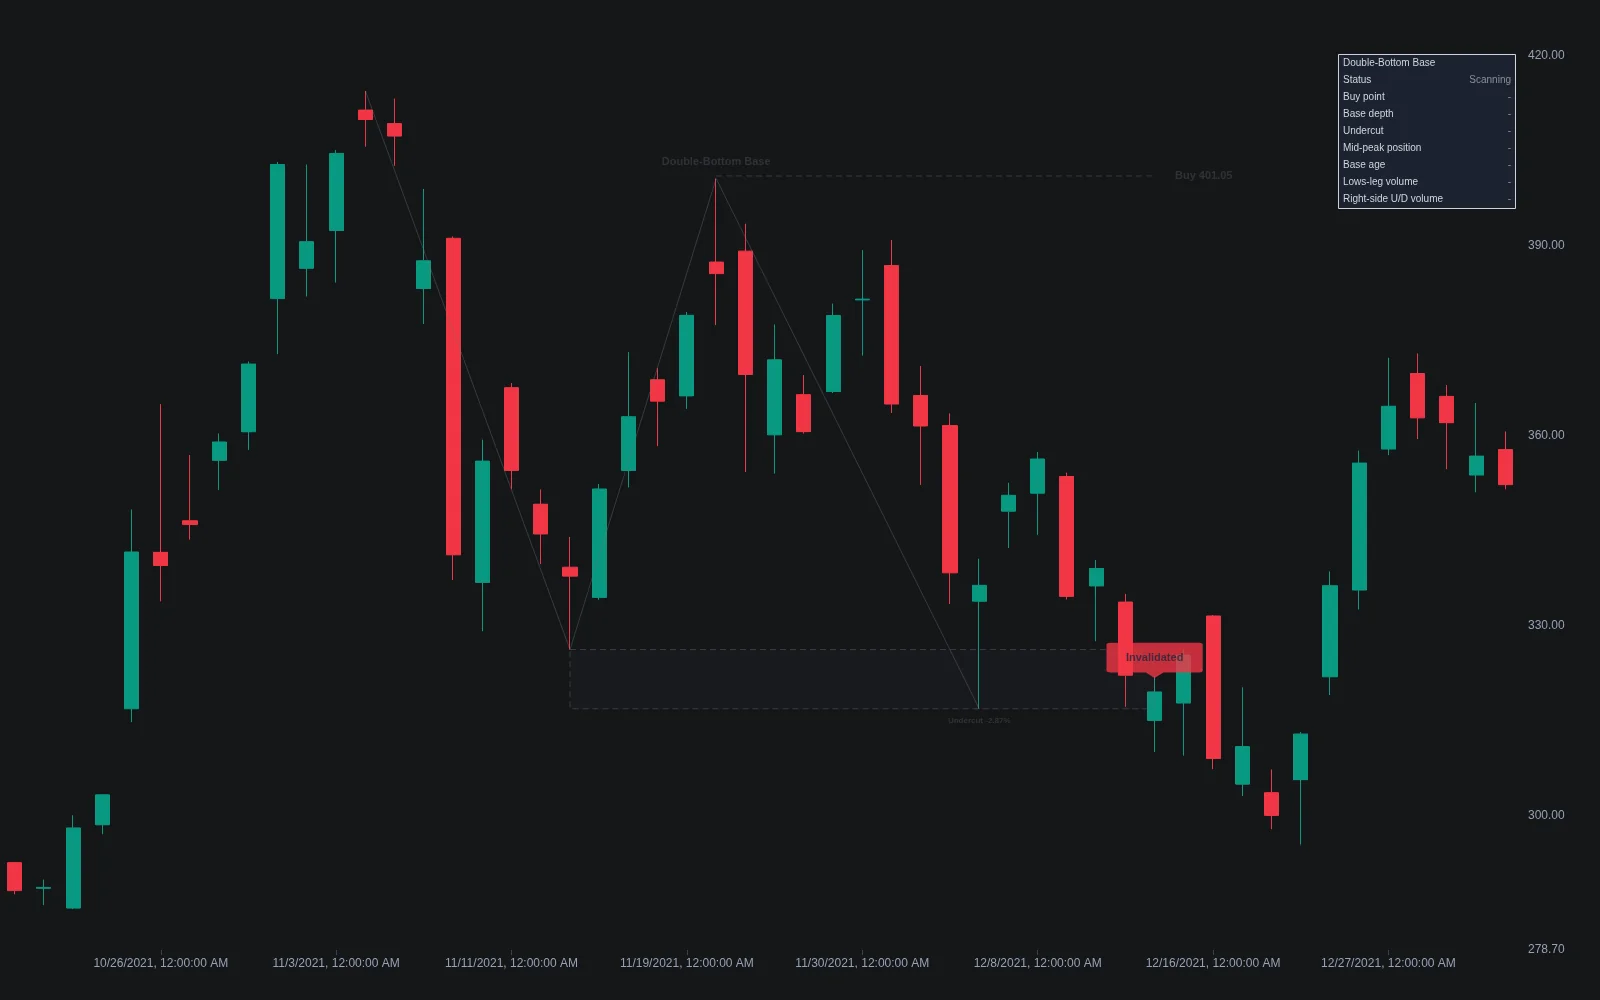
Video Example of a W Bottom
Brent Virkus’s brief historical walkthrough shows how to recognize a W-bottom candidate on a chart. Use it to understand the geometry, then apply explicit confirmation, entry and risk rules rather than treating the pictured outcome as a forecast.
Recognize the Pattern Without Future Information
Work in chronological order: identify the prior trend, first swing, intervening reaction and second swing. Freeze the candidate’s reference levels once the required observations are available. A neckline drawn across unrelated later highs is not the original neckline.
Swing confirmation can introduce a delay. A pivot low requiring two bars on its right is not known at the low itself: it becomes available only after those later bars have completed. A retrospective label on the earlier candle must not produce an earlier simulated entry. Apply the same principle to peak detection and divergence markers.
Define what happens if a new low or high changes the geometry before a neckline break. You can cancel the candidate, restart detection, or update a level according to a stated rule. These produce different results. Do not silently redraw the structure after seeing whether a trade won.
Candlestick patterns such as a hammer or morning star can describe behavior around a trough. They are optional additional conditions, not substitutes for the neckline requirement in a breakout-based strategy. Avoid declaring every pair of nearby lows a meaningful trend reversal.
Choose a Confirmation and Entry Method
Completed-Bar Break or Intrabar Crossing
A completed close above the W neckline is different from a wick crossing it and closing back below. Likewise, an M-top close below support differs from an intrabar dip. State whether a price buffer, multiple closes or a volume filter is required, and when the order becomes eligible.
For a close-based crossing event, a simple condition is current close above the fixed neckline while previous close was at or below it. Remaining above the level is a state, not a fresh crossing on every bar. Mirror the comparison for a bearish break. Specify whether repeated attempts and re-entries are allowed.
Breakout Entry or Retest Entry
A breakout method acts after the chosen break condition. A retest method waits for a return toward the broken level. The return may never happen, and a retest may fail. Treat these as separate entry models rather than simultaneously requiring an immediate entry and a later pullback.
An illustrative long retest rule could allow five completed bars after confirmation, require price to reach within 0.5 points of the neckline and then close above it, and enter at the next eligible price. Define cancellation if the time window expires or the structure fails. The distance and five-bar window are test choices, not recommendations.
Volume and Momentum Filters
A volume rule might require completed breakout volume above 1.5 times the mean of the preceding 20 completed bars. If that reference is 2 million shares and breakout volume is 3.2 million, the ratio is 1.6 and passes this example. Exclude the current bar from the reference and use consistent session and venue coverage.
Lower volume at a second trough can be consistent with reduced selling activity, but it does not prove accumulation or guarantee an uptrend. A fixed volume pattern is not present in every successful reversal. Exchange share volume, exchange-specific crypto volume and broker tick volume describe different datasets.
RSI compares smoothed gains and losses. A price low changing from 100 to 99 while RSI changes from 25 to 33 is a hypothetical bullish divergence when measured at matching, available pivots. For a bearish example, price highs of 120 and 121 with RSI readings of 75 and 66 diverge in the other direction. A flat second low is not the same geometry as a strict lower-low divergence.
MACD can add a momentum condition, but define whether you mean its signal-line crossover or a crossing of zero. RSI and MACD use the same underlying price history, so their agreement is not automatically independent evidence. OBV tracks signed volume based on close-to-close direction; an OBV divergence does not identify specific institutional buyers.
Bollinger Bands can describe price relative to a moving average and standard deviation. A second trough remaining inside the lower band can be a separate relative-price condition, even if the second price low is lower. Bands do not guarantee 90% containment or validate every neckline break. Specify the length, source, multiplier and exact condition if you use them.
Calculate Targets From the Pattern, Then Assess the Trade
A conventional measured objective projects pattern height from the neckline. Choose how to handle unequal swings. In the examples below, W height uses the lower trough and M height uses the higher peak. These are reference objectives, not promised destinations.
| Hypothetical setup | Height and objective | Entry changes the reward-to-risk |
|---|---|---|
| W: lows 100 / 101, neckline 110 | Height 110 − 100 = 10; objective 110 + 10 = 120 | Entry 111, stop 99: reward 9, price risk 12, or 0.75R before costs. |
| M: highs 120 / 119, neckline 110 | Height 120 − 110 = 10; objective 110 − 10 = 100 | Short entry 109, stop 121: reward 9, price risk 12, or 0.75R before costs. |
| W retest using a different stop | Same objective 120; hypothetical entry 110.50 and stop 108 | Reward 9.50, risk 2.50, or 3.8R before costs; this is a tighter, different exit rule. |
For the W example, adding the ten-point height to the actual entry of 111 would give 121, which is not the neckline-based measured objective of 120. A delayed or slipped entry can reduce the available reward while increasing risk. A pattern can meet your recognition rules and still fail your minimum trade requirements.
There is no automatic reason to double the pattern-height target. A larger objective is a separate hypothesis with different hit frequency and holding time. Inspect intervening resistance for a long or support for a short, and define target, time exit and competing-order handling before testing.
Keep Stop Placement and Position Size Consistent
A stop below the W trough zone protects against a different failure condition from a stop just below the neckline after a retest. For an M top, the corresponding choices are above the peak zone or above a retest reference. Neither placement is universally best, and they cannot be swapped after computing the trade’s risk.
Define the buffer in ticks, price units or a volatility measure with a specified measurement time. If you use the second trough rather than the lowest trough, say so: an unequal pair can make the difference material. Decide whether a stop remains fixed or trails and when updates become active.
Using the first W example, entry at $111 and stop at $99 imply $12 per share of planned price risk. A $200 risk allowance less $20 estimated total costs leaves $180, allowing 15 whole shares and $1,665 notional exposure. The $120 objective provides $135 gross potential price profit, compared with $180 planned price loss. Calling that trade “2R” would be incorrect.
If a gap leads to an exit at $95, those 15 shares lose $240 before costs. Stop orders do not guarantee their trigger price, and stop-limit orders may not fill. Check buying power, position concentration and quantity-dependent costs separately. For contracts, include point value and currency conversion. Short-stock trades also require borrow and margin checks.
Partial exits reduce exposure only when executed. Record the quantity, level and treatment of the remaining stop; taking some profit does not guarantee a profitable overall trade. If both a stop and target are touched within one bar, the OHLC data alone may not establish their sequence.
Build and Review the Rules in Native LuxAlgo
Open native LuxAlgo charts and select the instrument, feed, session and interval. Use drawings to mark the two swings and reaction level, then inspect relevant studies through the Indicators picker. Keep the pattern and every decision timestamp visible in the review.
Ask Quant, our coding agent to implement the swing rule, tolerance, neckline calculation, completed-bar trigger, entry model, stop, target and sizing. Inspect the generated strategy code and run it manually. Check pivot-confirmation delays and ensure the first eligible order does not precede the information it requires.
Use Inputs for exposed parameters and Properties for the simulation assumptions, including capital, quantity, commission and slippage. Rerun after changes and inspect individual trades in the native strategy viewer. A recognizable plotted W or M is not a complete tested strategy.
A retrospective pattern label does not establish when a strategy could trade, and an alert is not an order execution. Use Quant to implement the rules you actually intend to evaluate.
Evaluate Timeframes, Combinations and Market Differences
Daily or weekly formations take more calendar time than intraday formations; that alone does not prove greater reliability. Slippage, holding costs, gaps, trade frequency and sample size change with interval. If a higher-timeframe filter is used, only include the value available when the lower-timeframe decision occurred.
Fibonacci retracement can supply an optional level based on named swing anchors, but an attractive ratio does not validate a reversal. Choose the anchor timestamps and percentage before measuring the result. Test the added condition separately from the baseline pattern.
Adapt the data assumptions to the market. Stocks have sessions and corporate actions; crypto trades across venues; spot forex volume may be broker-specific tick activity. A W-like shape in different markets does not imply identical liquidity, volatility or execution. A V-shaped recovery simply does not meet a two-trough rule—do not relabel it after the fact.
Evaluate frozen rules on later data that did not choose the settings. Include failed breakouts, missed retests and periods with no signals, not only attractive historical examples. Review net results, drawdown, trade count and sensitivity to modest parameter changes. Keep a journal of the rule version, decision time, intended order and actual outcome.
Frequently Asked Questions
What is the difference between a W bottom and an M top?
A W bottom has two troughs around a reaction high after a decline. An M top has two peaks around a reaction low after an advance. The intervening reaction level is the neckline for the respective breakout or breakdown.
Does the second low confirm a W bottom?
It creates a candidate pattern. A conventional breakout method waits for the neckline resistance to break under its stated timing and filter rules. Even that completion does not guarantee a profitable trade.
Must both lows or highs be identical?
No. Define the allowed percentage, tick or volatility-based difference and the swing separation in advance. Different tolerances identify different sets of patterns.
How is a double-bottom target calculated?
A conventional objective adds the neckline-to-trough height to the neckline. Specify which trough is used when they differ. The actual entry, stop and costs determine the trade’s reward-to-risk, not the pattern height alone.
Is a retest required after every neckline break?
No. Breakout and retest entries are separate methods. If a retest is required, define its price tolerance, expiry and failure conditions; some moves will be missed because price never returns.
How do I test W and M patterns in LuxAlgo?
Define the complete geometry and trading rules, ask Quant, our coding agent, to implement them, inspect the generated code and run it manually on native charts. Check pivot delays, execution timing, costs and later-sample results.
Read next