Wedge Patterns: Rising & Falling Signals
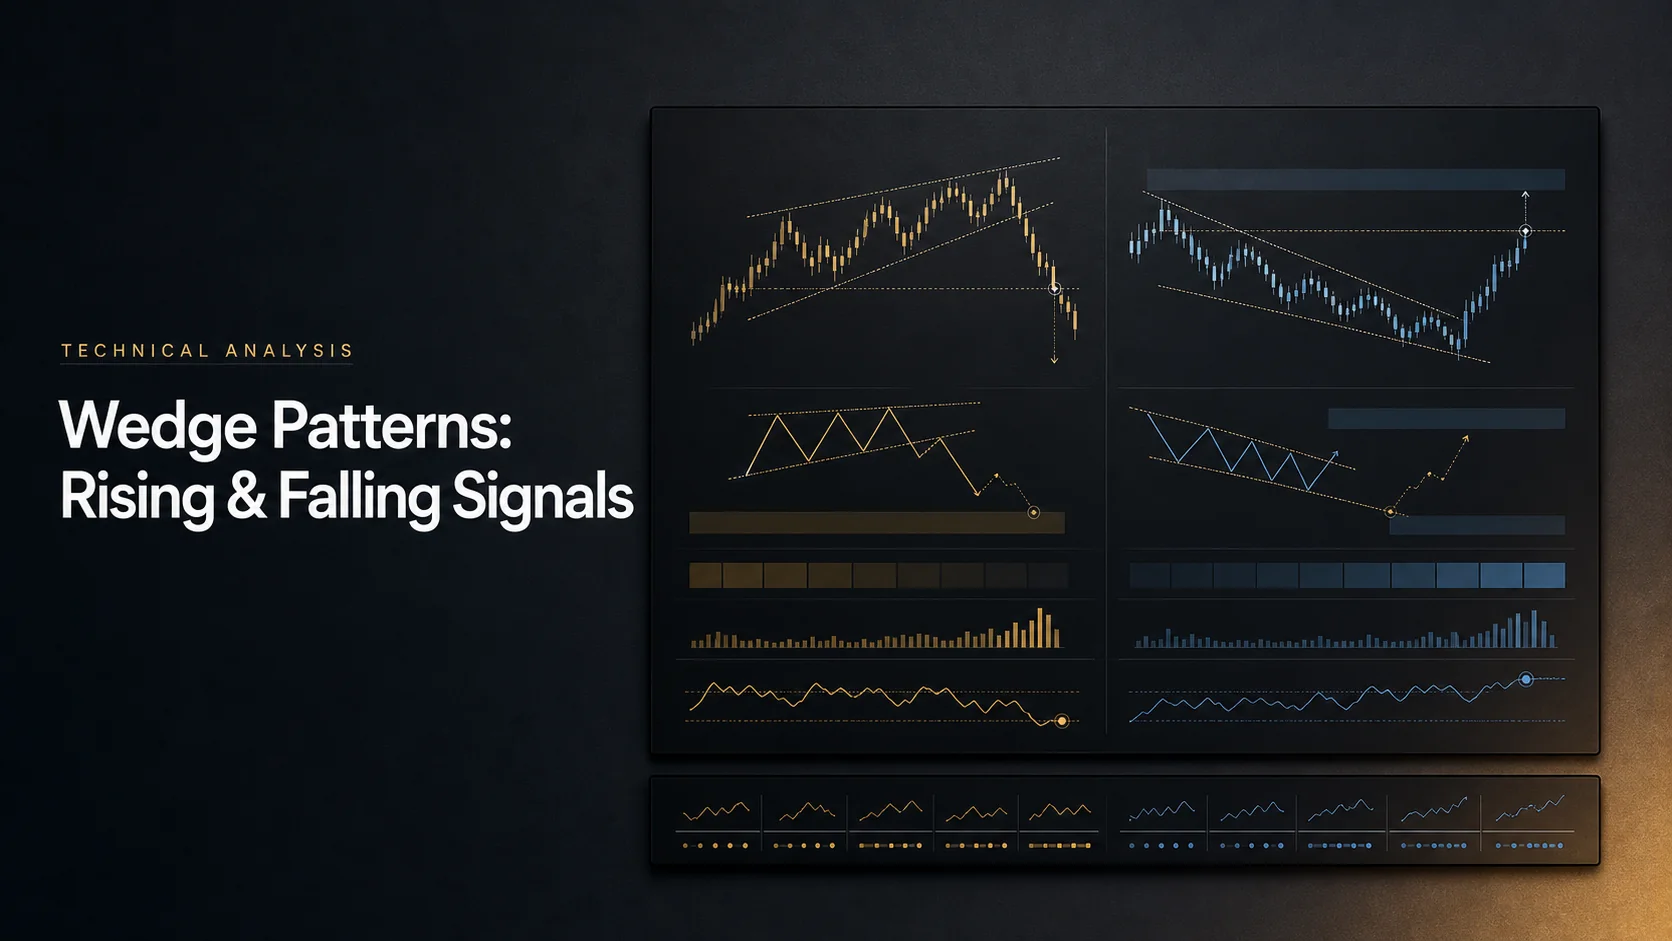
Wedge patterns describe price moving between two converging boundaries that slope in the same direction. A rising wedge slopes upward and has a conventional bearish interpretation; a falling wedge slopes downward and has a conventional bullish interpretation. The pattern remains a candidate until the specified boundary breaks, and either setup can fail.
Use LuxAlgo’s charting and AI platform to mark the structure on Quant Charts, compare it with surrounding price action, and develop explicit tests with Quant, our coding agent. The useful question is not whether a chart resembles a wedge after the move, but whether the same definition could have identified it before the outcome.
Key Points to Remember
- Both boundaries rise in a rising wedge; the lower boundary rises faster so the gap narrows.
- Both boundaries fall in a falling wedge; the upper boundary falls faster so the gap narrows.
- A rising wedge can precede a bearish reversal or occur as a countertrend rally within a decline.
- A falling wedge can precede a bullish reversal or occur as a pullback within an advance.
- Breakout timing, volume context, invalidation and position sizing need separate rules.
Structure of Wedge Patterns
Main Elements of Wedges
| Element | Rising wedge | Falling wedge |
|---|---|---|
| Upper boundary | Successively higher highs with a positive slope. | Successively lower highs with a negative slope. |
| Lower boundary | Higher lows; steeper positive slope than the upper boundary. | Lower lows; less negative slope than the upper boundary. |
| Range | Narrows while price trends upward. | Narrows while price trends downward. |
| Conventional trigger | Break below the lower boundary. | Break above the upper boundary. |
| Context | Potential reversal after an advance or continuation after a countertrend rally. | Potential reversal after a decline or continuation after a countertrend pullback. |
Draw each boundary through meaningful reaction points, using a consistent rule for wicks or closes. Two points define a straight line; additional well-spaced contacts help assess whether it describes repeated price behavior. Three touches on each side may be a chosen filter, but it is not a universal definition.
Duration also depends on the method and timeframe. A 10–50-bar scan is one possible implementation. StockCharts’ longer-term reversal examples discuss formations lasting several months. Neither convention makes every intraday wedge invalid or every long-duration wedge reliable.
A wedge is different from a parallel channel, whose width stays broadly constant, and from a broadening pattern, whose boundaries diverge. A symmetrical triangle usually combines a falling upper boundary with a rising lower boundary; a wedge tilts both boundaries in the same direction. Specify chart scale and pivot selection because they affect the apparent slopes.
Volume Analysis in Wedges
Activity often contracts as the price range narrows. Expanding volume around a break can add evidence of participation, especially for a bullish falling-wedge breakout. It does not reveal institutional ownership or guarantee follow-through.
Compare volume with an appropriate baseline, including time of day for intraday charts. A volume surge while price remains inside the pattern is different from a surge accompanying a completed breakout. Neither observation automatically validates or invalidates the structure.
Data coverage matters. Exchange-specific volume, consolidated stock volume and broker tick volume are different measurements. Record the feed and session in a test, and use Quant Charts data documentation to check the market you are analyzing.
Rising Wedge Analysis
How to Identify Rising Wedges
The StockCharts rising-wedge explanation describes narrowing upward price action. Higher lows rise more quickly than the upper boundary, while each advance makes less progress. Price is still making higher highs and higher lows; the bearish interpretation needs a subsequent support break.
For a consistent detection rule, identify the required pivots, calculate both lines on the same bar axis, and confirm that their vertical separation is positive and decreasing. Do not redraw the boundaries after a failed signal merely to keep the pattern intact.
Downtrend Signals in Rising Wedges
After an extended rise, a downside break may support a reversal hypothesis. During a broader decline, an upward-sloping wedge can be a countertrend recovery that fails. Distinguish those contexts before testing their outcomes rather than pooling them under one universal success rate.
A completed close below the lower boundary is one possible trigger. A break of a prior reaction low or a later failed retest is a stricter alternative that changes entry timing and price. Waiting longer may filter some false breaks but can also reduce available reward.
Rising Wedge Chart Examples
Consider a hypothetical geometric example with an initial lower boundary of $72.96 and upper boundary of $88.83. Later, the boundaries reach $80.37 and $90.87. The width narrows from $15.87 to $10.50 while both rise. These numbers illustrate convergence rather than a historical trade result.
To turn that geometry into a trade study, record the timestamps of the points, line extensions, actual breakout close and subsequent entry. A later low by itself does not establish when the signal became available or whether a short position could have been filled.
Falling Wedge Analysis
How to Spot Falling Wedges
In a falling wedge, both reaction highs and reaction lows generally move lower, but the upper resistance boundary has the more negative slope. The lower boundary descends more slowly. If the lower boundary were falling faster than the upper one, the lines would spread apart rather than form the narrowing wedge described here.
The StockCharts falling-wedge method emphasizes that reduced downside momentum does not establish a bullish reversal until resistance breaks. Higher lows are not required during the falling wedge; they may appear as price transitions out of it.
Uptrend Signals in Falling Wedges
A downward-sloping wedge after a decline can be a reversal candidate. The same shape within an established advance can be a corrective pullback and potential continuation. In both cases, define the upper-boundary break and the conditions under which the candidate expires.
Compare the breakout with prior resistance and available target space. A close above the line followed immediately by rejection at a nearby swing high can fail even when the wedge itself was drawn consistently. A retest can occur, but waiting for one may mean missing a move that continues without returning.
Falling Wedge Chart Examples
For a hypothetical example, suppose the upper boundary falls from $110 to $103 while the lower boundary falls from $100 to $98 over the same interval. Width contracts from $10 to $5. A later close above the upper boundary can satisfy a stated breakout rule; buying merely because price approaches the narrowing end is a different strategy.
A pattern’s breakout frequency, retest frequency, target-hit rate and average subsequent move are different statistics from an executable strategy’s win rate and net return. Any reported pattern statistic needs its source sample, market regime, breakout direction, target, failure definition and costs. Measure your own rule consistently rather than treating a quoted percentage as the probability of the next trade winning.
Trading with Wedge Patterns
When to Enter and Exit Trades
| Entry approach | Rising wedge example | Falling wedge example |
|---|---|---|
| Breakout close | Require a completed close beneath the lower boundary. | Require a completed close above the upper boundary. |
| Next-open entry | Enter at the following open under the tested execution model. | Use the following open and recalculate size from the actual fill. |
| Retest entry | Require a return to former support and a specified rejection. | Require a return to former resistance and a specified hold. |
| Invalidation | Define a structural stop and an expiry if no break occurs. | Define the relevant swing or boundary failure before entry. |
A wick beyond the line followed by a close back inside does not satisfy a completed-close rule. An intrabar stop-entry system may still have entered during that wick. These rules have different exposures and must not be mixed when reporting results.
Setting Stop Loss and Profit Targets
Choose a stop from the structure that invalidates the setup, with a declared buffer if needed. For a long falling-wedge breakout, this might be beneath a recent swing low; for a short rising-wedge breakdown, it might be above a relevant swing high. Placing every stop just beyond the breakout point ignores how differently sized patterns behave.
A wedge-height projection is a heuristic, not a universal price target. If you use it, specify where height is measured and from which breakout price it is projected. StockCharts’ rising-wedge discussion instead emphasizes other technical context for downside objectives. Prior support or resistance can limit the practical target well before a full projected move.
Fibonacci levels need explicit anchors. A 38.2% or 61.8% retracement measures part of a selected move, while 100% represents its full distance; those labels do not automatically provide conservative, moderate and aggressive profit targets.
Managing Trading Risk
Suppose a hypothetical falling-wedge breakout fills at $51 with a structural stop at $48.50. Planned risk is $2.50 per share. A $150 risk budget permits 60 shares before costs. A $56 target offers $5 per share, or 2R. If price gaps through the stop and fills at $47.50, the loss is $210 before costs.
One or two percent of capital is not a required allocation. Choose risk according to your loss tolerance, liquidity and overlapping exposures. Account for spreads, commissions, borrow costs for shorts where applicable, and slippage. A 2R target can still produce negative expectancy if losses and costs outweigh realized wins.
Wedge Analysis with LuxAlgo
Charting and Pattern Tools
Use Quant Charts to inspect the same symbol and timeframe throughout the study. Draw the upper and lower boundaries consistently and record the point-selection rule. Changing zoom or switching to logarithmic scale can alter the visual impression, so use the actual price coordinates to verify convergence.
The Library’s pattern tools on a Quant Chart provide pattern detection, dashboards and alerts alongside auto-drawn trendlines. Some list broadening wedges among their patterns; broadening formations differ from the converging wedges in this guide, so verify the exact pattern label and settings in the tool you use.
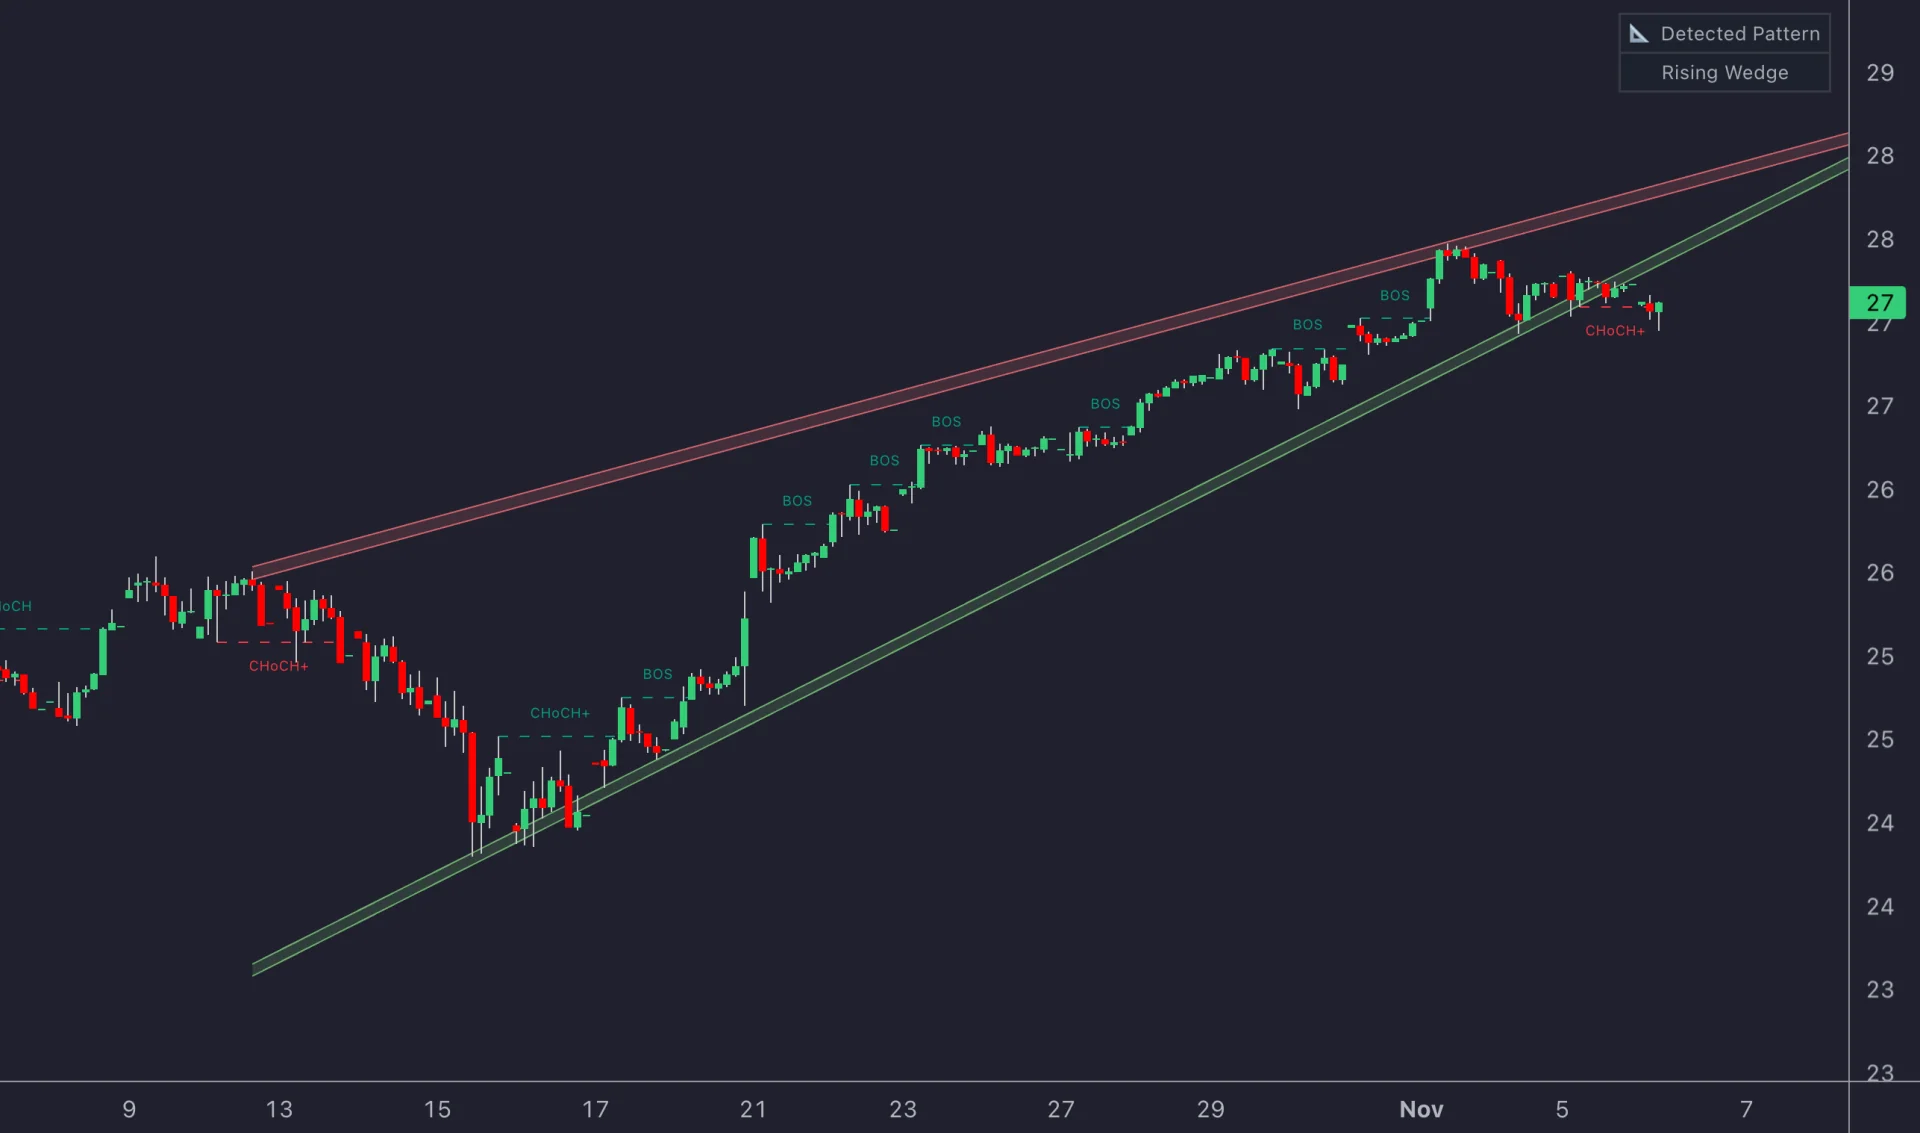
The historical chart above shows a Rising Wedge label, but that image does not establish a universal “third touch” alert rule. Auto-drawn trendlines also appear retrospectively once their conditions are met. A historical line reaching back to an earlier bar is not evidence that the full line was available at that time.
Pattern tools, trendline tools and horizontal range-breakout tools solve different tasks. Avoid assuming that a range-breakout signal detects a converging wedge, or that any volume overlay confirms institutional backing. Indicator settings or signals do not transfer automatically into a custom backtest.
Testing Wedges with Quant
Ask Quant, our coding agent, to implement a transparent candidate definition:
Find confirmed swing highs and lows using configurable left and right bars. Build upper and lower lines from the selected pivots only after they are confirmed. Flag a rising-wedge candidate when both slopes are positive, the lower slope is steeper, and the positive gap decreases. Mark the first completed close below the lower boundary after confirmation. Preserve the original lines and record failed candidates.
For falling wedges, require both slopes to be negative and the upper slope to be more negative. Inspect the generated code and run it manually, following Making Strategies with Quant. Hand-check several candidates and failures before adding entries, stops and targets.
State how many pivots must alternate, the minimum duration, touch tolerance, maximum allowed violations and candidate expiry. Pivot confirmation uses later bars, so decisions must begin after those bars exist. Exclude the breakout bar from any boundary-fitting step that would otherwise use future information.
Compare a simple completed-close trigger with a retest rule on unseen periods. Keep a record of every parameter variation, include costs and examine drawdown and average wins/losses as well as win rate. A convincing chart example is not a substitute for a full sample.
Advanced Wedge Pattern Methods
Using Technical Indicators
| Tool | Potential context | Limitation |
|---|---|---|
| RSI | Momentum or a precisely defined divergence. | Above70 or below30 does not require immediate reversal. |
| MACD | A crossover or weakening momentum under fixed settings. | It can lag and shares price information with the pattern. |
| Bollinger Bands | Volatility contraction or expansion. | A band touch alone is not a reversal signal. |
| Volume | Participation relative to a specified baseline. | Coverage differs by venue, market and session. |
Related indicators are not independent votes. Test whether each filter changes results after costs, rather than assuming agreement guarantees a better signal.
Avoiding False Breakouts
Possible filters include a completed close outside the boundary, a minimum price or ATR buffer, and a subsequent retest. Each trades earlier access for more evidence. No fixed number of confirming sessions eliminates false breaks.
For a hypothetical USD/JPY daily study, compare the first intraday breach with the daily-close trigger using the same patterns and execution assumptions. Include the cases where confirmation arrived after much of the move, as well as those where it avoided a loss.
Choosing the Right Timeframe
Daily and weekly views can clarify broader structure, but they are not inherently more accurate for every trading rule. Intraday patterns require closer attention to spread, session changes and noisy pivots. Choose intervals around the intended holding period and data coverage.
Higher-timeframe confirmation must use information known at the lower-timeframe decision. A weekly closing condition cannot justify a trade entered earlier in that week. Keep developing and completed candles distinct.
Common Trading Mistakes
- Misidentifying geometry: verify slope signs and narrowing width; a diverging formation is not a converging wedge.
- Redrawing after failure: preserve the original candidate and log why it failed.
- Ignoring confirmation timing: account for pivot delays and the difference between intrabar and completed-close triggers.
- Over-relying on a percentage: historical statistics do not define a current trade’s odds without comparable rules and data.
- Ignoring market context: news, liquidity, nearby levels and gaps can dominate the pattern.
A Bitcoin wedge example without its exchange, timeframe, timestamps and entry rules cannot establish a general result. Use a documented chart sample and include opposite-direction breaks rather than selecting only cases that fit the conventional bias.
How to Trade the Falling Wedge Pattern
Implementation Guide
Start with one market and a consistent drawing rule. Verify the geometry, label the prior trend, and define the breakout, stop and target before inspecting the outcome. Use Quant to make those choices reproducible, then compare failed patterns and favorable examples under the same assumptions.
Wedges organize price compression. Their practical value depends on how consistently you identify them, when the information becomes available and how the resulting trade is managed.
Frequently Asked Questions
Which line is steeper in a falling wedge?
Both lines slope down, but the upper resistance line has the more negative slope. The lower support line descends more slowly, allowing the gap to narrow.
Is a rising wedge always bearish?
It has a conventional bearish bias, but a trade needs a defined downside trigger and can fail. The shape alone does not guarantee a decline.
Do wedges require three touches on each line?
Two points define each line and extra well-spaced contacts help assess the pattern. Three per side can be a chosen filter, not a universal requirement.
Are broadening wedges the same as converging wedges?
No. Broadening boundaries diverge; the wedges discussed here have narrowing boundaries that slope in the same direction.
Does a wedge have a fixed success rate?
No universal trading win rate follows from the shape. Results depend on sample, definitions, entry and exit rules, costs and market context.
How can Quant research wedges?
Specify confirmed pivots, slope and width rules, timing, expiry and outcomes. Inspect the code and run it manually, preserving failed candidates and including realistic execution assumptions.
References
LuxAlgo Resources
External Resources
Read next