Buy Sell Calendar
 By LuxAlgoJan 23, 2023
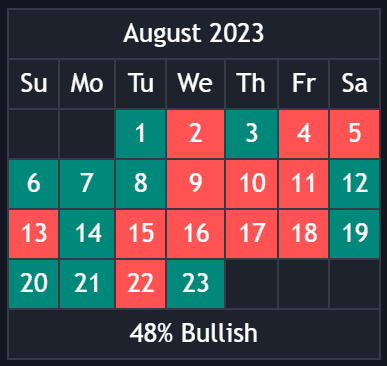
The Buy Sell Calendar projects sentiment onto a calendar panel, grading every day or month as bullish or bearish so recurring day-of-week effects and monthly tendencies surface at a glance. Three interchangeable methods score each period from its closing prices, and the panel also reports the percentage of bullish days or months across the longer frame: seasonality tooling at its most compact.
How to Trade the Buy Sell Calendar?
- Green and red cells: green marks periods graded bullish, red bearish. The checkerboard itself is the tendency map.
- Bullish percentage: the share of bullish days in a month, or bullish months in a year, quantifies the broader lean.
- Period lines: color-coded vertical lines mark each new day or month, and a line's color can update retrospectively as that period's sentiment resolves.
Sentiment depends on your chosen method. Linreg fits least-squares lines between consecutive periods and calls a positive slope bullish; Accumulated Deltas nets the bullish and bearish price changes within each period; Max/Min reads price against trailing extremes. Results can vary with the chart timeframe feeding the calculation, so pick it deliberately.
Buy Sell Calendar Settings
- Frequency: Daily or Monthly cells.
- Sentiment Method: Linreg, Accumulated Deltas, or Max/Min.
- Timezone Offset: aligns period boundaries with your UTC offset.
- Limit Date: confines the analysis to dates inside the chosen limit.
- Show Calendar / Location / Size: panel visibility, placement on the chart, and sizing.
Frequently Asked Questions
Free indicator
Get free access to this indicator on the platforms below.

The Library is free. Quant makes it yours.
Pull any concept or indicator into Quant: rebuild it, retune it, or turn it into a backtested strategy of your own.