ICT NWOG/NDOG & EHPDA
 By LuxAlgoApr 5, 2023
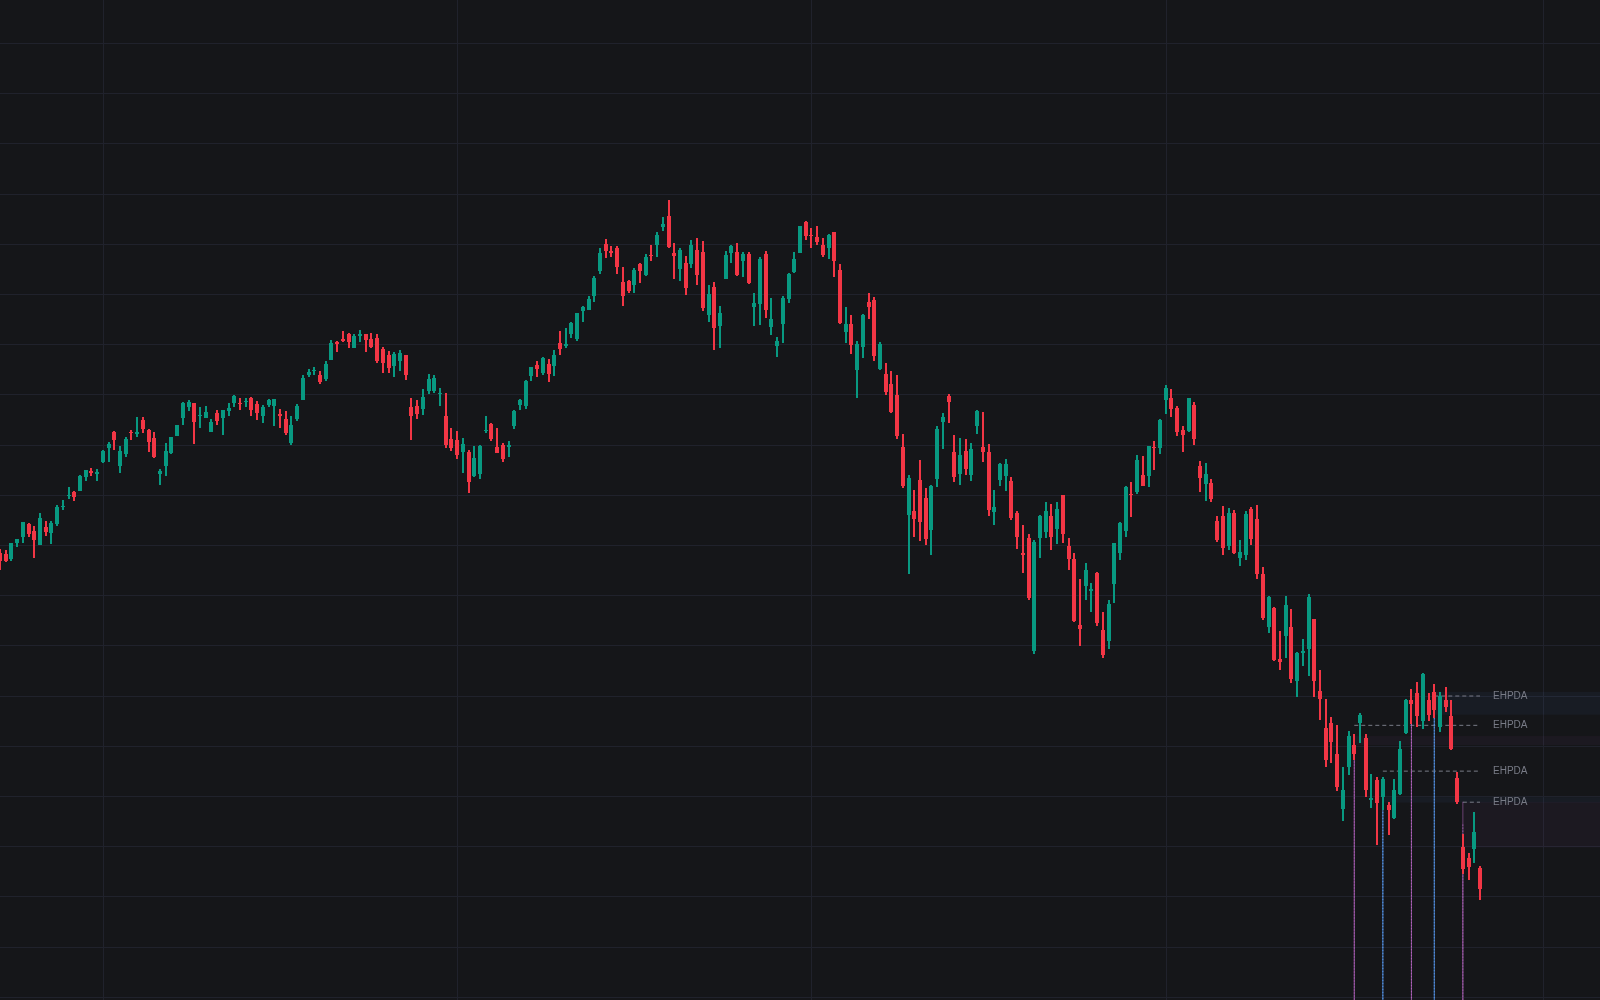

ICT NWOG/NDOG & EHPDA plots the new week opening gaps and new day opening gaps that ICT traders keep as standing reference levels, then adds the Event Horizon PD Arrays computed midway between adjacent gaps. Opening gaps have long been read as natural support and resistance: in consolidating markets especially, price has a habit of working back to them, in line with the broader observation that unfilled gaps attract price over time.
How to Trade the ICT NWOG/NDOG & EHPDA?
- Gap retests: treat NWOG and NDOG zones as potential support or resistance, areas where price is prone to react when it returns.
- Gap fills as targets: an open gap overhead or below can serve as a realistic objective for an existing position, since these zones often act as magnets.
- EHPDA reactions: in ICT's framing the mid-levels behave as barriers that stop price from escaping toward a particular gap, funneling moves toward the NWOG it has approached but not yet reached. Watch for momentum to stall or redirect there.
Limiting the display to a set number of recent gaps keeps the levels that matter in view without burying the chart in history.
ICT NWOG/NDOG & EHPDA Settings
- Show: choose whether NWOGs or NDOGs are displayed on the chart.
- Amount: how many of the most recent gaps stay visible.
- Show EHPDA: toggles the Event Horizon PD Arrays drawn between adjacent gaps.
Frequently Asked Questions
Free indicator
Get free access to this indicator on the platforms below.

The Library is free. Quant makes it yours.
Pull any concept or indicator into Quant: rebuild it, retune it, or turn it into a backtested strategy of your own.